
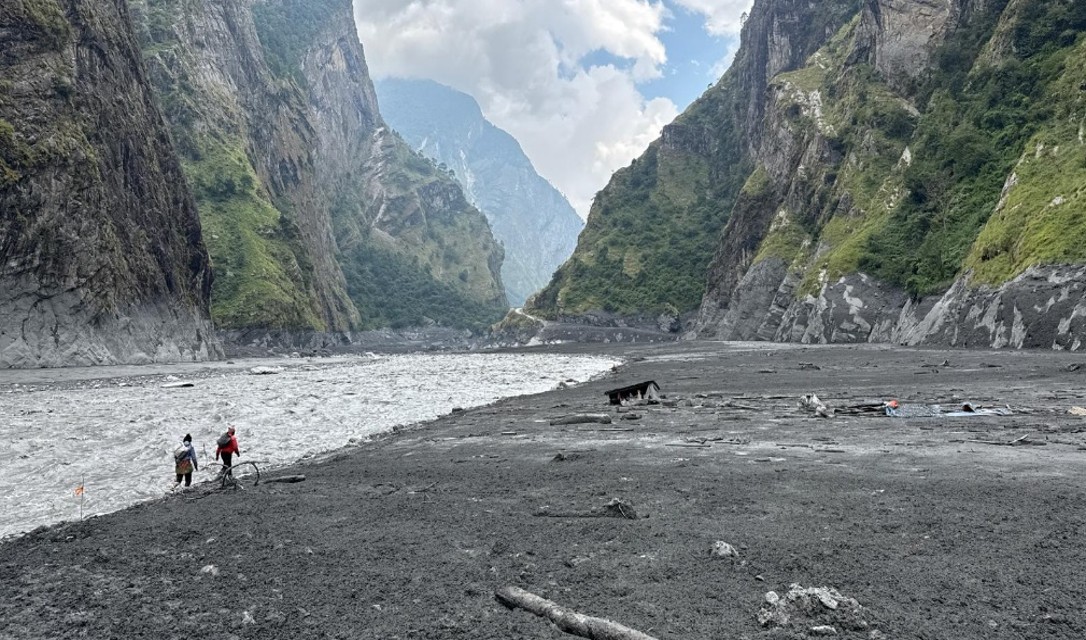
Just before 4:30 AM on October 11, 2026, people in the upper reaches of the Budhi Gandaki watershed in Nepal’s Gorkha district felt the earth shake and ran from their homes. People living along the river in the lower Tsum Valley said they heard and felt something that seemed like a massive landslide or avalanche coming, and minutes later, stones and dust rained down on their roofs in the dark. Over the next two hours, a terrifying series of debris flows came down the Budhi Gandaki River, sweeping away an estimated 121 homes in settlements along the riverbanks. The disaster also damaged bridges and hydropower projects throughout the watershed, and six people are still reported missing.
In the wake of this event, people across Nepal — still reeling from the trauma of the unprecedented Bhotekoshi-Trishuli Disaster of late August and then a wave of storm-triggered flooding and landslides nearby in Gandaki Province toward the end of September — wondered out loud: Is this the new normal?
The Stimson team once again conducted a rapid post-disaster assessment, working closely with disaster managers and technical experts from the Government of Nepal to try to figure out what happened, how, and why. We analyzed remote sensing data and satellite imagery, examined locally generated content shared on social media, reviewed drone survey data collected by our government counterparts, and visited the most-impacted areas to conduct three days of on-the-ground field research. Ten days later, we felt we finally understood the complex hazard interactions and processes that shaped this event, the multi-episodic patterns of flow propagation that resulted, and the ways local people responded to this disaster.
As extreme flow events repeatedly occur across the Himalayan region, experts and planners are doing their best to improve risk assessment techniques to keep up with rapidly evolving patterns of disaster risk. While the Budhi Gandaki disaster was, thankfully, nowhere near as deadly or devastating as the horrifying Bhotekoshi-Trishuli disaster, it is a) still a very large and destructive multi-hazard event that justifies focused inquiry, b) yet another wake-up call that highlights the need to reassess settlement planning and infrastructure development in the face of chronic patterns of exposure and c) part of a broader and deeply worrying pattern. Understanding this unique and incredibly offers another piece of the broader puzzle as we, collectively, work to make sense of changing patterns of disaster risk.
This issue brief — the public version of a report we created for our Government of Nepal partners — summarizes our findings and offers a handful of recommendations to improve disaster-risk management policies and protocols. Along the way, this piece also outlines the multimodal approach our team used to make sense of this complex multi-hazard event, which we hope offers methodological insights that will be useful to others conducting forensic analyses of future disasters
Key Takeaways
Before diving into the details of our analysis, we would like to provide a brief overview of a few of the key findings emerging from this assessment:
- This cascading disaster unfolded as a multi-episodic event, instead of a single massive flow like the Bhotekoshi-Trishuli Disaster. It was experienced as a series of distinct flows that propagated in pulses or waves — which is a big reason why casualties were mercifully limited during this event. Impacted communities reported both a series of flood pulse events and rapid fluctuations in the level of the river over a period of over two hours. Deviations between patterns of observed flows along the river course indicate that both the Syar Khola and the larger Budhi Gandaki River were blocked by landslide and debris dams at multiple points, and that these dams failed, triggering the debris flows that caused the majority of damage downstream.
- The initial high-elevation slope failure is best characterized as a rock avalanche, or simply a landslide, and did not include as much glacial material as most analysts initially anticipated. The initial failure that initiated the Budhi Gandaki disaster seems to have mostly been rock. Critically, because the percentage of ice/snow included in the early stages was lower, the water content of the rock avalanche landslide and the subsequent hyper-concentrated flow was also lower. This is likely a major reason why the initial flow didn’t move as fast or propagate as far as it could have if more ice had been included — and why the initial flow instead behaved more like a dry landslide. This is critical because, conversely, more ice could have led to greater loss and damage.
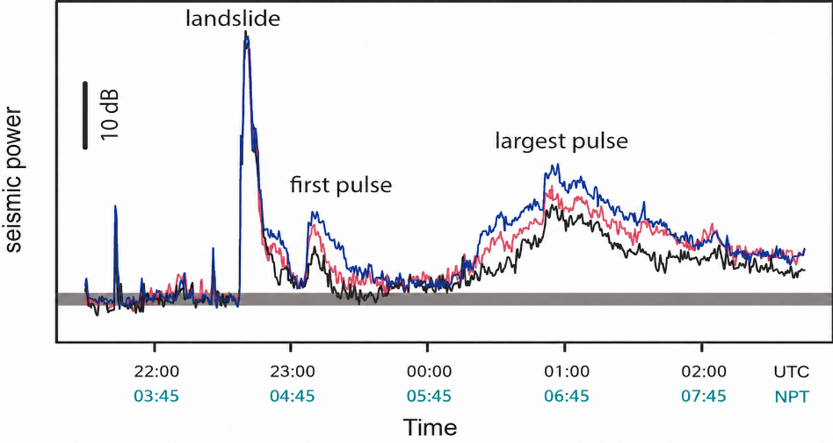
- The largest debris flow, which caused the majority of damage downstream, was caused by the failure of a landslide/debris dam created below the confluence of the Syar and Budhi Gandaki, which breached just before 6:00 AM NPT. As we discovered (and describe in detail below), the largest and most devastating debris flow occurred due to the creation and subsequent failure of a landslide dam that blocked the Budhi Gandaki River (further downstream than most post-disaster analysts had realized). Local eyewitnesses in the area around this dam report that it began to drain just before 6:00 AM NPT and drained over a period of over 20 minutes, and this correlates with both downstream observations and the pulses recorded in the seismic data (see Fig 2).
- The multi-episodic nature of this event created more lead time for downstream communities and more opportunities for localized information sharing and alerting. While several riverine settlements were partially destroyed, the loss of human life was minimal, and many people did receive some kind of warning — from locals or authorities, though mostly the former. Again, the most devastating impacts to downstream communities were caused by debris flows that occurred between 90 and 120 minutes after the initial slope failure. This meant that people had more time to react, evacuate, and share and receive alerts. And after witnessing the unthinkable devastation caused by the August disaster, people reported that they ran to high ground faster than ever before.
- Patterns of exposure and vulnerability along the river corridor were remarkably different than in the case of the Bhotekoshi-Trishuli Disaster. The total number of people exposed to this disaster in the Budhi Gandaki was also lower than in the August event because the overall pattern of development along the river corridor was different. Road development was in its earlier stages along most of the river course, hydropower projects were in the earlier phases of development, and most settlements were still located high above the river level. That said, plans for more intensive development in the area were in the works, and this event may lead to some rethinking, as yet another “wake-up call” to improve development planning in river corridors.
- Multimodal and interdisciplinary analysis is critical for this kind of rapid forensic analysis — and that includes qualitative analysis of local observations. Decoding the complex sequence of events that shaped this disaster required interpreting and integrating multiple different kinds of data, including: hydrological and seismic data, satellite imagery, drone footage, photographic and video evidence collected during the event, local testimonies collected during fieldwork, and our own observation of physical conditions on the ground. In this case, local accounts helped us gather critical pieces of the puzzle that helped us map out the multi-episodic pattern of propagation, understanding the timing, duration, and intensity of flows. In a broader sense, both disaster managers and scientists need to rethink the ways localized observations are collected and redesign information infrastructures to be able to make good use of local data.
- Post-disaster assessment protocols and workflows can be improved to help authorities make sense of complex events, using techniques like those we used here to triangulate between data sources — it just requires a focus on co-design and practice. Effective coordination between government organizations, scientific experts, and local disaster-risk managers is critical to increase the efficacy and accuracy of rapid post-disaster analyses. As Nepal and other Himalayan nations work to understand changing risks and prepare for future disasters, authorities need to also develop and refine post-event workflows for analyzing hazard processes and examining extant risks. Organizations like Stimson must work closely with government officials and technical partners in countries like Nepal to help build capacity for multimodal post-event analysis and protocols for rapid post-disaster assessment able to capture the nuance critical to understanding these complex multi-hazard events.
Deconstructing the Cascading Hazard Chain
The Budhi Gandaki disaster began with a high-elevationrock avalanche at an elevation above 6200 masl on the western ridge of Mount Chamar in the Sringi Himal. Like a handful of other cascading disasters in the Himalayan region — notably, the 2012 Seti Disaster in Nepal, the 2021 Chamoli Disaster in Uttarakhand, and the recent transboundary Bhotekoshi-Trishuli Disaster — this event was not triggered by precipitation and occurred on a clear weather day. Preliminary estimates based on seismic data and current satellite imagery suggest that the total volume of material mobilized could be between 15-30 million cubic meters, which is nearly one-quarter the size of the initial failure that triggered the Bhotekoshi-Trishuli Disaster (estimated at 120 million cubic meters).
Seismic signals from the initial landslide, detected globally in the immediate aftermath of this event, showed that the slope failure began around 4:22 am and suggested a magnitude for the initial failure of 5.1 Mw (Figure 2). With the seismic data in hand, we were able to clearly see the scale of the event, identify the watershed, and see multiple periods of high energy which correlated with parts of the observed pattern of multiple flood waves. (Though, we needed to collect more localized reports to really make sense of this complex multi-episodic pattern.)
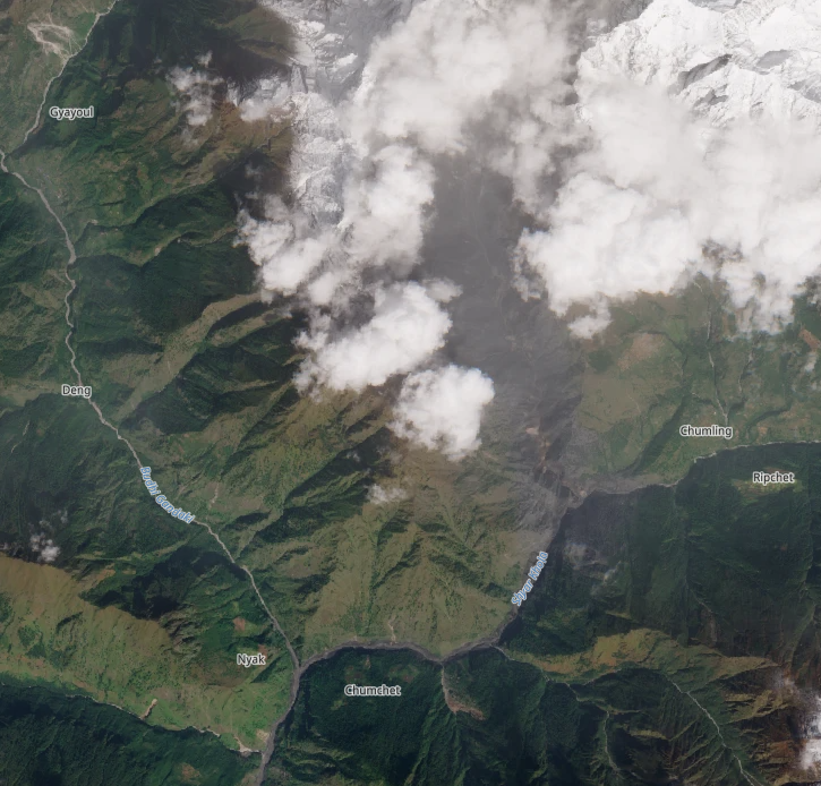
On the evening of October 11, a little more than twelve hours after the disaster, post-event satellite imagery (optical, Sentinel-2) from the European Space Agency’s Copernicus program was made publicly available (see Fig 3). This optical imagery provided visual confirmation of the scale of the initial landslide/avalanche and clearly indicated that the flow had come down the steep gorge of a small tributary called the Ungilung Khola, which aligned with local reports. The Oct 11 imagery also suggested that the disaster had originated somewhere above 5,000 meters, in a glaciated catchment, though it remained partially obscured by clouds for several days.
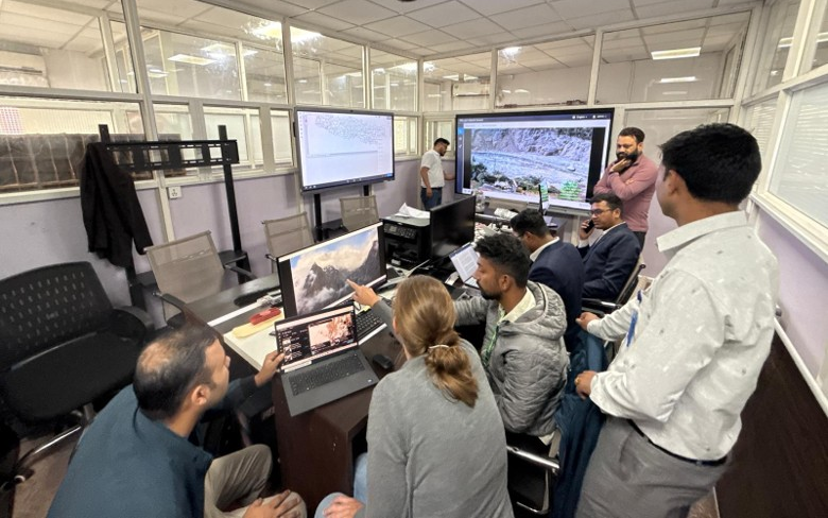
On October 13, our team was invited to the NDRRMA Situation Room to review and help analyze drone footage from October 12 collected by an NDRRMA-led team. This footage, which captured imagery of the Ungilung Khola up to 5200 masl, showed that the landslide had scoured the entire Ungilung drainage but had not significantly damaged the glacial front, apart from the failure of a relatively small part of the glacial snout. This strongly indicated that glacial material involved was not as significant as initially suspected. In other words, this was not a “glacier collapse” as some had previously thought. This relatively small loss of glacial material was subsequently confirmed with other post-event satellite imagery in the days that followed.
Analysis of optical satellite imagery released later that week (as well as field-based visual confirmation, see inset in Fig 5 below) confirmed the location and size of the initial failure. Our interpretation is that when the landslide/avalanche fell onto the glacier, it did entrain some material from the surface of the glacier, including recent snowpack, along with ice and rock deposited on the glacier’s surface by past landslides (exact estimates pending). Remarkably, however, this rock avalanche did not lead to a major detachment from the glacier; so, during this first stage, the flow behaved more like a dry landslide.
Again, this marks an important difference from the Bhotekoshi-Trishuli Disaster, where the bedrock failure triggered a detachment that included roughly 20 million cubic meters of glacier ice. While many are calling this another “rock-ice avalanche” — deploying the same term used to describe the initial cascade in the Bhotekoshi-Trishuli Disaster chain (following the bedrock failure trigger that took all that glacier ice along with it) — this initial failure for the Budhi Gandaki seems to have mostly been rock.
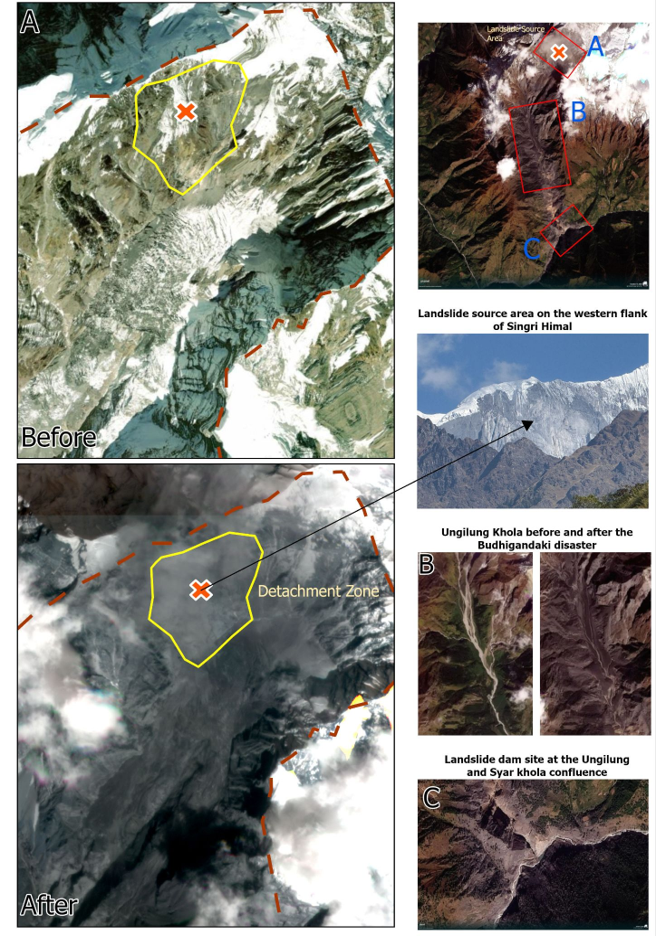
After the landslide crossed the glacier, it descended into the steep gorge of the Ungilung Khola where it entrained more rock and sediments along its path. From the source area to the point where this landslide reached the Syar Khola, it fell almost 4000 meters (Figure 3). During the first stage, this flow behaved more like a relatively dry landslide, carrying large volumes of material down the Ungilung drainage and along the Syar Khola to the point where the Syar Khola meets the Budhi Gandaki River. When the flow reached the Syar Khola, it created a massive cloud of dust and an air blast. The extent of this blast can be observed using satellite and drone imagery and by dust deposits in the landscape. Reports indicate that this initial cascade also created a wave in the main Budhi Gandaki River that propagated quickly downstream, although it was to be the smallest of the three major waves to reach these communities.
Downstream, along the Budhi Gandaki River, this disaster was experienced as a series of debris flows. These flows came as pulses or “waves” that propagated at different speeds, though much more slowly than the Bhotekoshi rock-ice avalanche. The first initial flood pulse down the Budhi Gandaki before 5 am was likely faster than the others, given a potentially higher water content (a surge of water forced by the landslide), while the timing and speed of the other flows seem to have varied at different locations along the river course. Most locals who observed the river after the first pulse reported a prolonged period of low flows, where the river ran close to “dry.” River levels continued to fluctuate over the coming hours due to blockages in a variety of locations upstream, caused by a) the initial landslide event, b) debris flows following the breach of landslide dams along the river course, and c) debris flows getting caught in different places along the way, likely causing smaller blockages and surges. Some locals report up to six waves total over a period of several hours, but most report either two or three large waves. The final “third” wave that came down the river after 6 am — almost 90 minutes after the initial slope failure — caused the most devastation.
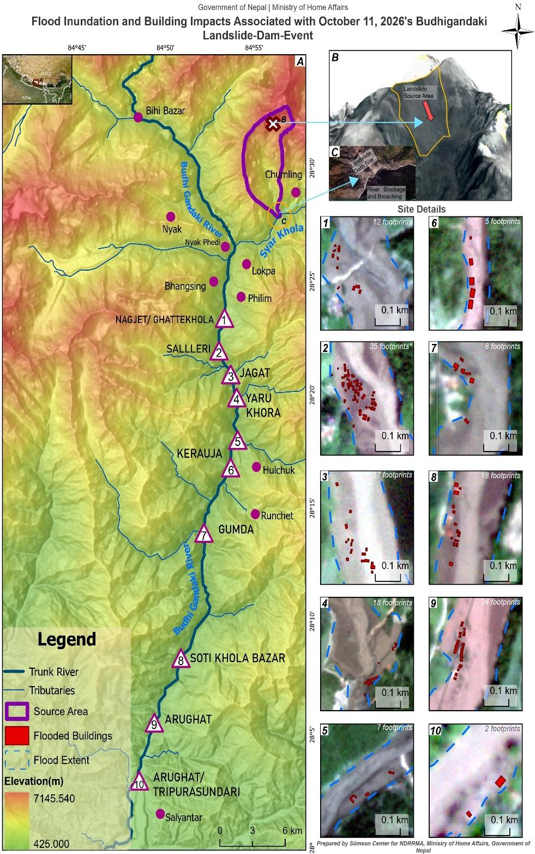
The debris flow front and highest-volume part of this flow went past the municipal headquarters in Philim between 6:25 and 6:35 AM, according to local testimonies and videos captured with time stamps. As the flow continued downstream, it washed away six houses and a school in Ghattekhola (which was thankfully empty due to leave for the approaching Dashain holiday). This largest debris flow reached Salleri just after 6:30 AM, where it swept away 11 houses and the hydropower project camp, and then hit Jagat just a few minutes later, washing away another 22 houses (Figure 6).
Thankfully, the overall level of loss and damage resulting from this disaster was limited. After watching (shocking and seemingly endless) footage of the Bhotekoshi-Trishuli disaster, people in this area were painfully aware of the potential risks of a catastrophic flood. Almost everyone knew to run to high ground when the river started to dry up, and as in Rasuwa, many people also made timely phone calls to contacts downstream, sharing information that helped save lives before government-issued SMS messages arrived. Moreover, people downstream responded rapidly this time after seeing what had happened in the Trishuli River valley. They ran higher than ever before, fearing the unthinkable.
While the jury is still out over the terminology (a common issue with these complex events), one fact remains extremely important here: The lower percentage of ice included meant that the water content of the landslide and the subsequent hyper-concentrated flow were lower. This is likely a major reason why the initial flow didn’t move as fast or propagate as far as it could have. Put differently, if more of the glacier had failed, it could have contributed millions of cubic meters of ice that would have increased the size of the initial flow and could have added additional water (melted ice), enhancing the mobility of the first pulse that came downstream around 4:30 AM NT. Alternatively, more glacial material could have also created larger landslide dams below, adding more water volume to the overall cascading hazard chain or system and increasing the volume of the debris flows that came later, thus intensifying the system’s impacts. In either case, a higher level of water content could have led to more lives lost.
Reconstructing the Multi-Episodic Debris Flows
During field research conducted in the Budhi Gandaki basin between October 17 and 19, our team collected testimony from a variety of differently positioned local people who had experienced this disaster firsthand at different locations along the river course between Jagat and Lokpa (27 people in total, see Fig 7 below). Information from these interviews helped us to reconstruct the complex interactions that caused and shaped the observed series of debris flows.
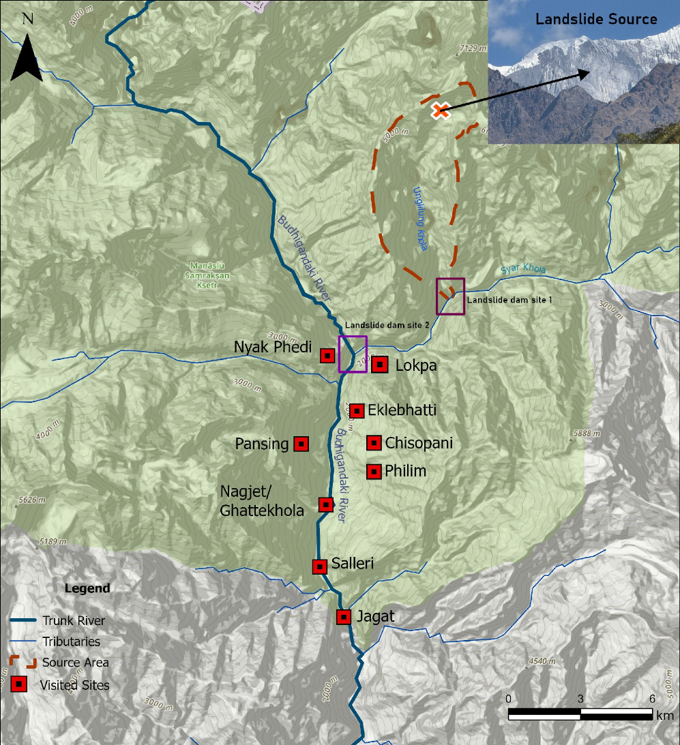
Integrating these localized observations with our own field-based observations and prior analysis using remote-sensing data and satellite imagery helped us reconstruct the complex flow propagation patterns that occurred and led our team to the following conclusions:
- There were significant blockages of river flow across at least two sites, and multiple landslide dam breach events occurred from these different barrier lakes. One major river-blocking dam was created at the confluence of Ungilung and Syar Khola, and a second was created just downstream of the Syar-Budhi Gandaki confluence, which blocked both rivers (see Fig 7). The most significant breach reported for the upper landslide dam at the Ungilung-Syar confluence occurred just after 5:00 AM NPT (reported by locals in Lokpa), and the most significant breach of the lower dam occurred just before 6:00 AM NPT (reported by locals in Nyak Phedi). Both of these reported events match with the pulses recorded in the seismic data (see Fig 1 above).
- Debris from the Ungilung Khola blocked the Syar River several times, both partially and completely, but the river was not fully impounded for very long. Our analysis, based on NDRRMA’s drone imagery and local reports, suggests that some part of this initial avalanche/landslide did get stuck at the Syar Khola confluence, but that this blockage was likely deposited during the middle of the initial landslide/avalanche flow through this chokepoint, after the fast-moving front had come through and continued downstream. Local reports from Lokpa suggest that the river was partially blocked multiple times, with two complete obstructions that led to large debris flows caused by dam breaches: The first flow happened around 4:35 AM NPT (perhaps after a partial blockage during the initial landslide), and then a second and much larger flow was released around 5:05 AM NPT (after a more sustained blockage).
- The largest landslide dam was created below the confluence of the Syar and Budhi Gandaki rivers. Material from the initial large landslide from the source up the Ungilung Khola propagated down past the confluence, as evidenced by dust deposits (dry landslide behavior) and local reports. We inferred that a river-blocking landslide dam was formed in this area after the initial event due to the sustained “dry riverbed” conditions reported in several locations below before 5am, which would require a near total blockage of the Budhi Gandaki mainstream, somewhere below the Syar-Budhi Gandaki confluence.
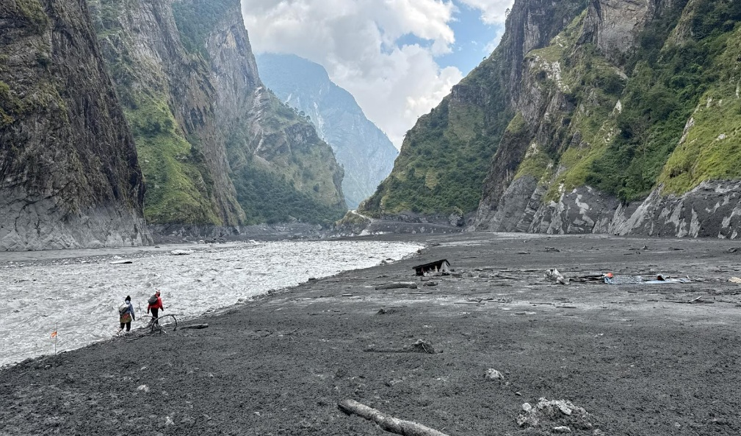
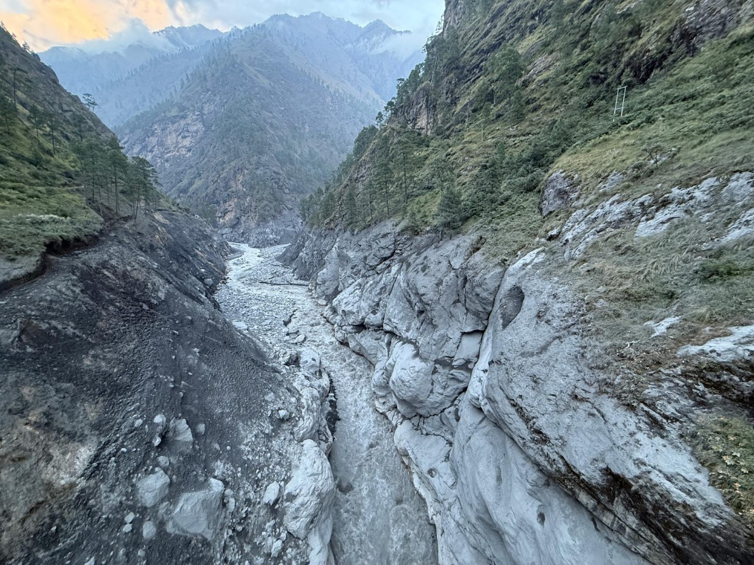
While conducting field research, locals living above Philim repeatedly mentioned that the Budhi Gandaki River had been blocked, too, forming a lake (using the Nepali term “taal”) in the area around Nyak Phedi. Arriving at the confluence on October 18, our team found clear evidence of this temporary lake, confirming our earlier hypothesis. Our analysis at the site suggests that this dam was formed somewhere near a narrow choke point in the gorge near the suspension bridge that crosses the Budhi Gandaki River just below Nyak Phedi (see Figure 6 below). High water marks indicate that impounded water levels could have been 30-40m above the riverbed (accounting for aggradation) and that water was ponded up to 1.1km upstream along the Budhi Gandaki River. This dam created a highly visible high-water mark, indicating ponded water, which we observed during field research. At present, we are still not sure how long the river was blocked by this dam. It possible that two main blockages and breaches occurred in this area, due to complex interactions with the debris flows down the Syar Khola caused by the failure of the dam near the Ungilung-Syar confluence, but the impounded water level continued to rise around the confluence area until almost 6:00 AM NPT. Full estimates of the impounded water volume here will also require further analysis and flow modeling, accounting for different sequences. However, given the high watermark, we estimate that the Budhi Gandaki River was blocked for a total of between 50 and 80 minutes prior to the point when the lake began to drain following the most significant breach event at 6:00 AM NPT. - The failure of the landslide/debris dam below the confluence of the Syar and Budhi Gandaki occurred just before 6:00 AM NPT, and this event caused the greatest amount of damage downstream. Local observations and seismic analysis suggest that the drainage of this lake occurred over a period of 20-30 minutes. This was likely a partial breach, rather than a single large outburst flood, given local reports from Nyak Phedi recalling the time it took the lake to drain and the river to return to normal and sustained high flows reported/videoed downstream for the same duration.
The exact causes and mechanics of the dam breach require further investigation. One theory is that a debris flow from above caused an overtopping wave or partial breach. This is supported by an eyewitness from Nyak Phedi (located right above the confluence) who told us that another debris flow full of mixed debris came down the Syar River just before 6 am, after which the lake began to drain rapidly. It is also possible that the flow from this breach encountered and incorporated water stored behind other smaller, partial blockages just downstream (see the next section). In any case, we are confident that the largest and most damaging debris flow experienced downstream was caused by the breach of this landslide dam just below the Syar-Budhi Gandaki confluence at 6:00 AM NPT.
Critically, local reports of the timing of this breach and downstream flows observed also correspond with the seismic record. The energetic seismic signal created by the rock-ice avalanche and the first wave along the river was followed by a period of quiet until the signal started to increase again at 5:58, which aligns with the time locals from Nyak Phedi reported seeing the lake formed by the nearby landslide dam blocking the Budhi Gandaki begin to drain. The seismic signal then rose again, reaching a peak from 6:36 to 6:43, and then decreased over the following hours (see Figure 1).
Summary of Evidence of a Landslide Dam on the Budhi Gandaki River
Because the finding that a dam formed below the Syar-Budhi Gandaki confluence is one of the most important outcomes of our assessment, we provide a summary of our field-based observations with photographic evidence below.
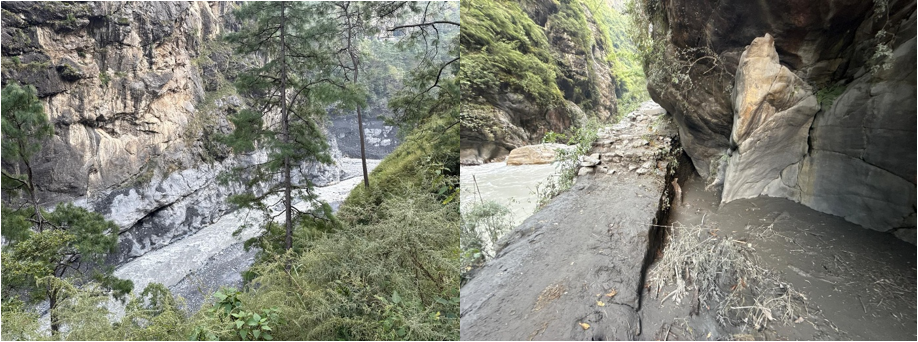
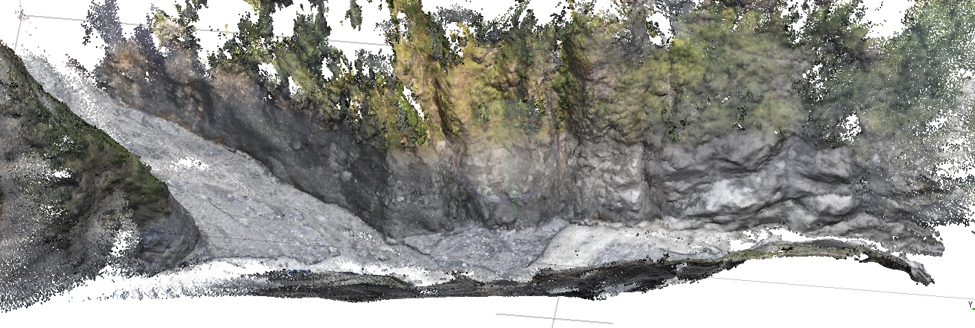
On October 18, after arriving at Nyak Phedi, our team observed clear evidence of high-water marks at a consistent elevation on all sides of the confluence of the Syar and Budhi Gandaki rivers — seemingly undisturbed by any other debris flows thereafter (see below). Using a phone-based tool, we estimated that this line was roughly 40 meters above the river level right at the confluence, which had reportedly aggraded a few meters. Using a phone-based tool, we took an elevation reading for the high-water mark lines left below the confluence and upstream on both the Syar and the Budhi Gandaki tributaries, and this was consistently measured at ~1680 masl. This extremely stark and obvious line (somewhat like a bathtub ring) suggests a large impounded water body in this area, created by a debris dam.
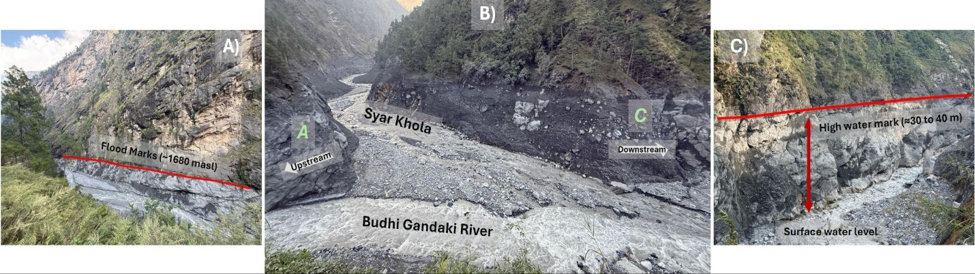
As we traveled upstream along the Budhi Gandaki River to the northwest of the confluence, away from the Syar River where the main flow came down, we continued to see a consistent high-water mark on the stone and on vegetation. This was a very consistent line at a sustained elevation, different from what would have been created by a sloshing backwater flow (like what occurred upstream on the Kyirong Khola after the initial flow came down the Lhende River to the confluence at Rasuwagadhi during the Bhotekoshi-Trishuli Disaster). This line was also inconsistent with what a high-water mark from a previous flood coming down the Budhi Gandaki during the late September cyclone would look like. This line continued up slightly beyond the bridge located almost exactly one kilometer upstream of the confluence at Nyak Phedi, and we found woody debris deposited across this bridge, and then very fine silt deposits just a few hundred meters further upstream, indicating ponding in this area (see Fig 7).
Lingering Uncertainties & Areas of Future Research
Our assessment also highlighted several important questions and sources of uncertainty. What follows is a sketch of two major areas of inquiry where future research is needed.
Linkages to Climate Change: An Open Question
As stated above, this high-elevation slope failure from steep and heavily fractured bedrock occurred on a clear weather day (meaning that precipitation was not a triggering factor). Analysis of this slope using satellite imagery indicates a) that this slope is extremely steep, with an average pitch of ~70 degrees, and b) that several other smaller landslides and avalanches had occurred here in recent years, depositing material onto the glacier below. While snowfall had accumulated at high elevations in recent weeks — causing avalanches in the central Himalaya, including a deadly avalanche on nearby Mount Manaslu — satellite imagery indicates that the majority of snow on the slope had already either slid onto the glacier below (a snow avalanche) or melted by October 11. As with the Bhotekoshi-Trishuli Disaster, the absence of a clear weather-related trigger makes formal climate attribution hard.
At the time of writing, no exact triggering dynamics have been identified, and like so many other cases, this likely represents a progressive, complex interplay of geological- and climate-driven processes rather than being attributable to any one factor. Geological structural discontinuities provide pathways along which meltwater generated by climate-driven glacier, snow, and permafrost thaw infiltrates the rock mass. Repeated freeze–thaw cycling and ice segregation then widen these fractures and reduce rock-mass cohesion over time. This, in turn, increases infiltration, creating positive feedback effects between warming, water penetration, weathering, and bedrock deformation. This feedback drives gradual destabilization and progressive movement until the weakened rock mass reaches a critical threshold and fails suddenly. While such longer-term progressive movement has been identified for Chamoli and Bhotekohsi-Trishuli disasters, this kind of analysis is still lacking for the slopes of Mt. Chamar.
It is possible that the southern exposure of the slope which failed could have enhanced more rapid warming of permafrost, and that recent warm temperatures and anomalies in snowmelt could have expedited the pathway towards a critical threshold or tipping point (as established for the Bhotekoshi-Trishuli disaster). But any recent climatic pre-conditioning is entangled with an overall progression of slope instability driven by long-term conditions of thermal and hydrological weakening.
Other Areas of Potential Blockage
This was an extremely complex cascading hazard event, which unfolded over the course of two hours. Field-based investigation and local testimony suggest that each of the three main pulses — the initial landslide-triggered cascade and the two larger debris flows triggered by landslide dam failures that followed — seems to have caused a series of other minor blockages at various chokepoints along the river course. The exact pattern remains uncertain and will require future research. To aid future research, however, we would like to share the following information collected by our team, which hints at one particular area of uncertainty that may be important for future inquiry.
Another important blockage seems to have occurred on the Budhi Gandaki, below a place called Gambul (a single hotel along the path between Eklaibhatti and Nyak Phedi), perhaps closer to Eklaibhatti. While this blockage was downstream of the main dam near the Syar-Budhi Gandaki, the water impounded by this blockage was incorporated into the debris flow that was initiated around 6:00AM when that dam failed, likely adding to the volume of the final major flow pulse.
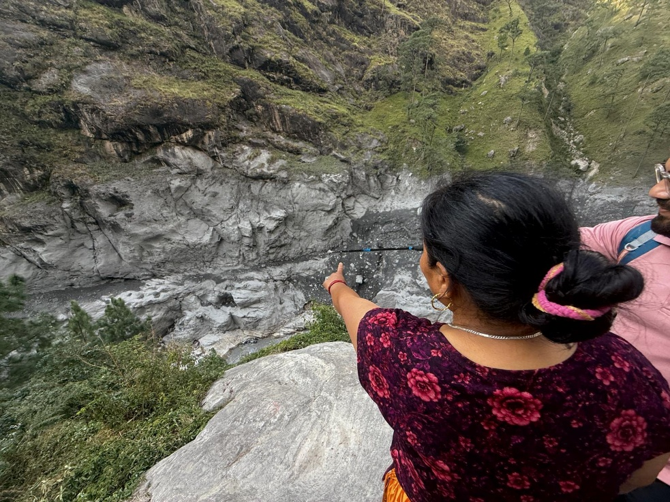
The couple who operate the hotel at Gambul told us that they observed that the river level had risen and stopped flowing (slack or ponded water) just below their house between 5:00AM and 6:00 AM. While talking with them, they confidently pointed to a place on the opposite cliff about 12-15 meters above the current level of the riverbed where the water may have reached. The riverbed in this area has risen by an estimated 3-4 meters since the disaster due to aggradation, according to locals. The blockage that created this impounded slack water seems to have been caused either by debris deposited by part of the initial landslide or (more likely) by the second wave that came down from the Syar Khola — perhaps the large flow from the dam failure at the Ungilung-Syar confluence reported at 5:05 AM. In any case, the larger flood wave around 6:00 AM appears to have cleared this blockage and incorporated the impounded volume, adding to the volume of that flow but also erasing the previous high-water mark that would have served as evidence of this blockage.
Again, debris flows, especially thick flows like this one, can also get caught or bound up at different chokepoints as they move downstream, creating temporary blockages, full or partial behind them, which may explain differing reports of multiple smaller flood waves observed at various places downstream. To understand these micro-dynamics of rheology, further research and field-based analysis are needed.
The Way Forward: Key Takeaways for Disaster Risk Managers
In recent years, the Stimson Center has conducted several rapid assessments of cascading disasters in Nepal, including the 2024 Thame GLOF and the supraglacial lake flood that hit Rasuwa in 2025, in addition to the recent Bhotekoshi-Trishuli Disaster. But in terms of the intricacy of cascading hazard interactions, the Budhi Gandaki disaster of October 11 may be the most complex we have analyzed to date.
In this piece, we have been at pains to describe the complexity of this disaster because a) the event remains poorly understood, with limited formal analysis published to date, b) we want to demonstrate why an interdisciplinary approach is necessary to decode this event, and c) it deserves attention from national policymakers and the international scientific community.
In closing, we would like to highlight a few key policy recommendations and suggestions about ways to improve post-disaster assessment practices that emerged from our analysis:
Early warning systems must be multimodal, given the Himalayan scale of uncertainties: The Budhi Gandaki Disaster again highlighted major gaps in the existing hazard monitoring and early warning systems in Nepal and the Himalaya region. Like so many other recent disasters, this event started in a place where no one was looking — a blind spot where no one was actively monitoring because no major risks had been previously identified there, either by government authorities or scientists working in the Himalayan region. Since no single monitoring tool or technology will catch all changes and emergent hazards in the Himalayan region, multimodal monitoring systems that use a portfolio of different sensing and monitoring technologies are essential.
Seismic data is extremely valuable for rapid detection: The Budhi Gandaki disaster stands as yet another case study that demonstrates the value of seismic data for rapid detection and basic alerting. In recent years, members of our team have tried to highlight the value of seismic monitoring systems for detecting extreme flow events, publishing papers that demonstrate the potential efficacy of these systems in the wake of the 2021 Chamoli Disaster (Cook et al, 2021) and hosting events that highlight the value of this approach (Stimson, August 2025). Simply put, developing a comprehensive seismic-based early warning system in Nepal that can rapidly detect and locate extreme flow events is crucial, especially when authorities don’t know where the next disaster may occur.
Local observations are critical and contain important data on flow dynamics: While sophisticated remote sensing techniques and sensor data can enable a general understanding, conducting field-based research and discussing the event with local people is often the only way to truly understand a complex event like this. Situated observations by local residents who experienced the disaster firsthand are essential when trying to understand complex hazard interactions or reconstruct the process-chain of such complex cascading events. Information about the timing and duration of flow conditions can often only be gleaned from local observations — by standing together and engaging in dialogue while pointing to specific locations and features along the river (as shown here). Working with photographs and videos recorded by locals are useful, especially when it comes to triangulation, but these often contain only fragments of the context, so conversation is critical to help with interpretation and validation. Investments in training that can help sharpen qualitative methods and data collection practices will pay significant dividends in the wake of disaster.
Locally generated warnings remain invaluable: Strengthening the pathways that can channel local observations and phone calls into an official warning pipeline is also critical. Yet again, this event revealed that local people attuned to changing landscapes and risks are often the first to share alerts with their contacts in downstream communities. In addition, it is vital to strengthen the pathways between phone calls, community reports, and official warning systems, as the residents are the first ones to alert others. Authorities should continue to develop other advanced technologies for hazard monitoring and change detection but should not forget that timely phone calls are also a highly effective and appropriate technology which complements other alerting modalities. In the face of increasing uncertainty in the mountain environment, it is critical to invest in community-engaged monitoring programs that integrate local knowledge, and investing in these efforts can help create channels for two-way dialogue which are critical when disaster strikes.
Pre-formulating post-disaster assessment protocols and analytical workflows is necessary to improve rapid analysis: Effective coordination between government organizations, scientific experts, and locals is also critical to increase the efficacy and accuracy of rapid post-disaster analyses. Preformulated workflows, combined with routine exercises, can increase the quality and depth of impact assessment, while also enabling the collection of other time-sensitive data crucial for scientific assessment. Rapid post-disaster research needs to go beyond summarizing impacts (headline data on households affected and infrastructural damage) to include the systematic collection of localized information about hazard processes, the timing and duration of impacts, and localized decision-making. Scenario-based trainings focused on qualitative data collection and analysis should be designed for local and central authorities to ensure they are well-equipped to collect and manage localized information when a disaster strikes.
—
Since 2023, the Stimson team and our scientific partners have worked to develop new techniques for multi-hazard risk assessment and repeatedly provided timely technical support and rapid post-disaster analysis to relevant government authorities. Through the iterative testing of different techniques and analytical workflows, we have developed an approach to rapid assessment that we feel is both useful and effective — the analytical process described herein is a prime example. Now, our team wants to leverage our collective experience to help improve the overall system by sharing this approach and training others to use these interdisciplinary techniques, both for post-event analysis and multi-hazard risk assessment.
Going forward, our team at the Stimson Center stands ready to provide continuing support and analysis to Government of Nepal institutions like NDRRMA and the Center for Hydrology & Resources Research (CHWRR) as needed. But, perhaps more importantly, we also stand ready to work with our government partners to co-develop training programs and protocols for post-disaster assessment that will enhance technical capacity and human resources within Nepal.
About the Authors:
Kristen Cook is a geomorphologist and a Research Officer with the French National Research Institute for Sustainable Development (IRD) with the Institute of Earth Sciences (ISTerre) at Université Grenoble Alpes. She is the President of the Division of Geomorphology within the European Geophysical Union (EGU) and an expert in extreme flow events in the broader Himalayan region.
Manish Raj Gouli is a Consultant for the Stimson Center who works as a Multi-Hazard Research Scientist for Stimson’s project on Early Warning Systems for Cascading Disasters in Nepal. In 2026 he has been providing technical support to the Government of Nepal’s National Disaster Risk Reduction & Management Authority (NDRRMA), helping assess multi-hazard risks and model complex flows.
Biraj Pokharel is a consultant for the Stimson Center working on a new multi-sited research project on Strengthening Local Disaster Risk Governance in Nepal. He has extensive experience with disaster risk management and humanitarian assistance in Nepal, having previously worked with organizations like MercyCorps and UNDP.
This group of authors has been working together for nearly three months in the aftermath of the Bhotekoshi-Trishuli Disaster to conduct technical and field-based assessments of disaster impacts and multi-hazard risks. In the wake of the Budhi Gandaki disaster of October, we worked together to conduct this assessment in both Kathmandu and in disaster-impacted regions of Gorkha.
Acknowledgements: The authors of this report would like to thank fellow Stimson team members Dipesh Pokharel, Jeevika Khadka, and Regan Kwan for their initial contributions to rapid analysis, as well as Bikram Karki for assisting with field research in Gorkha. We would also like to recognize our technical colleagues from the NDRRMA who invited us to co-analyze their drone data, including Dr. Prakash Pokharel, Sabin Shrestha, Rijan Gajurel, and Subash Gurung, and drone pilot Shishir Lhamsal. We would also like to thank Dr. Basanta Raj Adhikari for discussing our initial findings in the early days after the disaster, and Dr. Simon Allen for reviewing and providing feedback on this report.
The Stimson Center team’s work on this assessment was made possible with financial support from the Margaret A. Cargill Philanthropies.





Community Adaptation for a Water Festival Without Clean Water