
Executive Summary
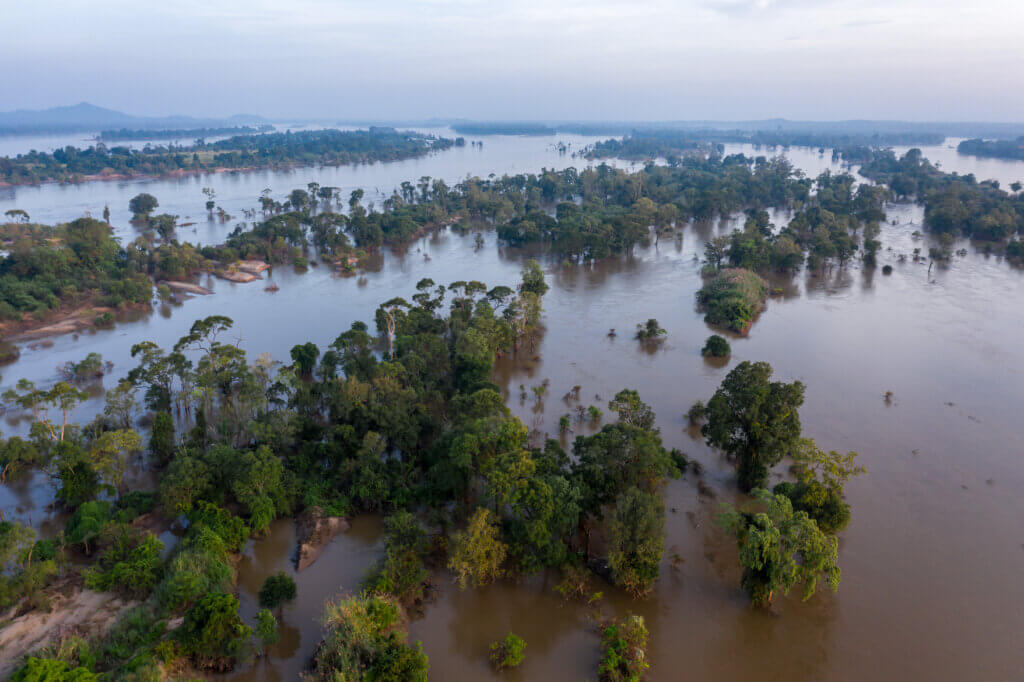
A large flooded forest, which covers much of the Stung Treng Ramsar Site (STRS), is a unique riparian ecosystem that underpins regional biodiversity and local livelihoods in northeastern Cambodia. Since 2008, upstream hydropower development in China and Laos has substantially reshaped the dry season hydrology, raising minimum river levels by more than one meter during much of the dry season, and essentially erasing a period of low‑flow that the forest requires to survive. This report shows: (1) dry season discharge at Pakse (the nearest Mekong mainstream gauge upstream of STRS) now remains above the pre‑2008 mean throughout January-May (core months of the dry season), with a series of weeks exceeding 150% of the historical mean and other weeks exceeding 200%; (2) cumulative dry season releases from major dams in China and Laos are the cause of high levels during the dry season; and (3) remote sensing analysis shows an at least 18% (500 hectare) decline in the flooded forest extent across whole of STRS between 2018 and 2026, with some hotspots experiencing 35-59% loss. However, losses certainly started long before 2018, but the exact losses cannot be measured using the instruments applied for this study. These findings lead to the conclusion that for the flooded forest to survive, major upstream dams must reduce and/or reschedule dry‑season releases (especially February through May) and shift some releases to November-December. In parallel, STRS management should focus on safeguarding deep pools and erosion hotspots and establishing active monitoring methods to enable adaptative interventions.
Introduction
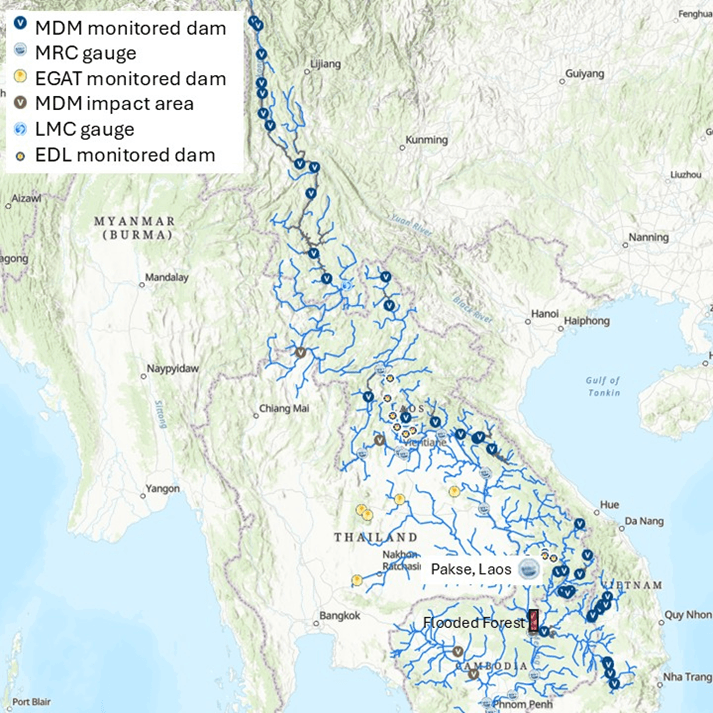
Covering 14,600-ha along a 37-km stretch of the Mekong, Stung Treng was designated as a Ramsar Site in 1999. The Stung Treng Ramsar Site (STRS) is home to a large area of seasonally flooded forest that provides habitat for many endemic and threatened species. Trees in the flooded forest grow along the riverbed, as well as on hundreds of braided islands, where their roots stabilize landforms. These trees are adapted to exposure to the atmosphere during the dry season. If their roots are permanently flooded, then they die – a process that is now well underway. Since large upstream dams began operating — particularly after 2008 when the Xiaowan Dam on the Lancang River (Upper Mekong) was built — the Mekong’s discharge patterns have shifted: Dry season flows increased, and wet season peaks decreased. This report uses data from the Mekong Dam Monitor archive and remote sensing data to analyze landform and vegetation loss to estimate the drivers of hydrological changes and their impact on the geological integrity of the flooded forest.
Figure 1: Location of the Stung Treng Ramsar Site and Flooded Forest
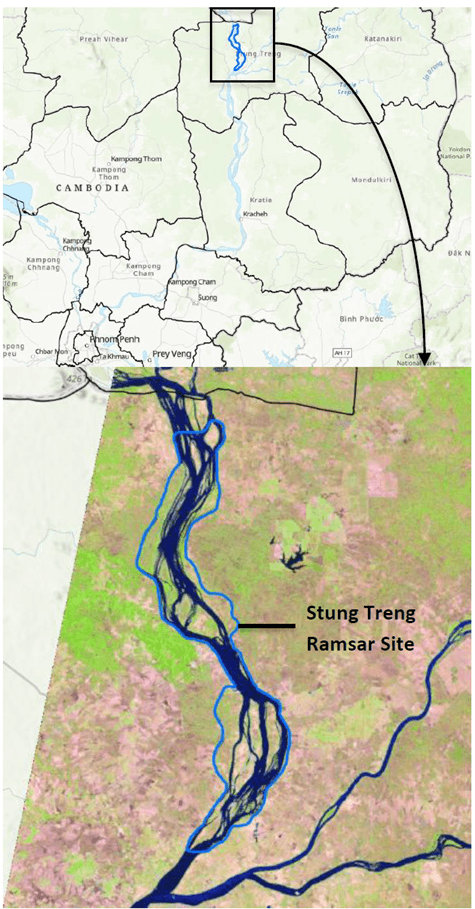
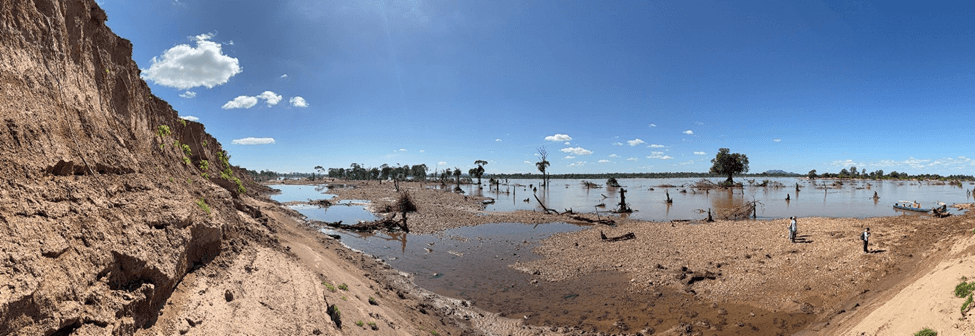
Image: Large scale land and vegetation loss at Koh Ko Ki in the flooded forest in December 2025. Photo: Austin Lord
How Upstream Dam Operations Have Impacted STRS Flooded Forest
Methods
Hydropower development throughout the Mekong Basin has expanded rapidly over the last 20 years, with more than 700 dams built or under construction. While the hydrological and ecological consequences of these dams have been widely discussed, information on how the largest dams are operated is limited, which in turn limits our ability to accurately assess the impact of specific dams. Only Thailand and Laos publicly share daily operational data, and even then, only for a subset of dams. Critically, no routine operational data are publicly available for the largest and most hydrologically influential dams in China.
Despite these constraints, a growing body of research (Dang et al., 2016; Räsänen et al., 2017) has demonstrated that dam operations have substantially altered the Mekong’s natural flow regime based on data and analysis of river gauges along the Mekong. These studies all show reductions in wet season flows and large increases in dry season flow. Observed dry season increases of 40-70% relative to natural conditions have been attributed primarily to the seasonal pattern of storage and release of water from large dams. The Mekong Dam Monitor (MDM), a project implemented by the authors of this report, observes changes in the Mekong’s largest 58 reservoirs in near-real time, and MDM analysis generally concurs with the above findings. Published research has also documented the dramatic impact of these changes on riparian ecosystems with specific discussion on the impact of higher water levels during the dry season on the biological cycles of particular trees and bush species in the STRS (Baird & Thorne, 2023). Baird and Thorne interviewed local fishers in the STRS in 2022. The fishers estimated that some common bush species that grew lower in the riverbed have nearly disappeared entirely, and that larger iconic trees such as the Anogeissuss rivularis and Acacia harmandiana have declined up to 50%. Baird and Thorne’s work suggests that species decline and loss began long before the 2018-2026 scope of this study.
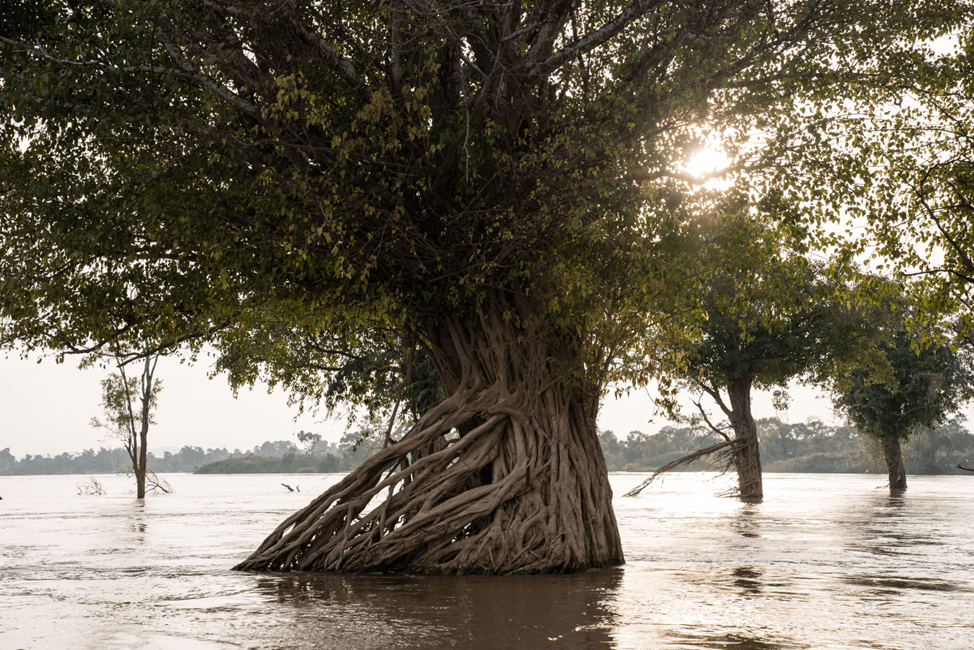
Common tree species in the STRS serving as host for a Ficus tree. (Photo: Andy Ball)
To address data gaps, this study calls on the Mekong Dam Monitor data archive, which is derived from remote sensing techniques that estimate reservoir operations at large dams. Using Sentinel‑1 radar imagery, which allows surface water detection regardless of cloud cover, reservoir surface area and storage changes can be estimated with a high degree of precision. These estimates are used to construct reservoir operating curves that approximate how dams store water during the wet season and release it during the dry season. These methods build on published peer-reviewed approaches.
This study uses data from the Mekong River Commission’s Pakse gauge in southern Laos as a proxy for hydrological conditions affecting the STRS. Pakse is located 120 km upstream of STRS, and there are no major tributaries entering the Mekong between Pakse and STRS that would significantly alter discharge. (The gauge at Stung Treng is located downstream of the flooded forest and cannot be used for this study because it includes flows from the Sesan, Srepok, and Sekong rivers, which contribute 20% of the Mekong’s annual discharge). Using data from the Pakse gauge therefore allows upstream Mekong dam impacts to be isolated. Baseline comparisons rely on mean discharge data from 1923-2007, representing the predam period prior to the filling of Xiaowan dam in 2008 — the year during which large upstream dams began exerting a discernible influence on seasonal flow patterns.
Figure 2: Locations of large dams and reservoirs upstream of the STRS
Results
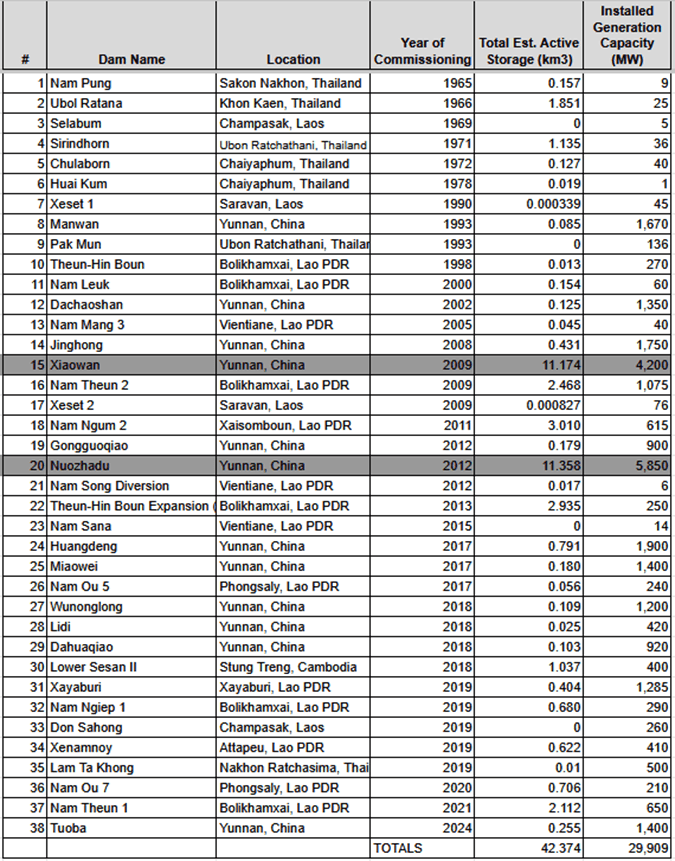
Analysis of reservoir storage capacity upstream of Pakse shows that a small number of very large dams account for most of the Mekong’s hydrological changes. The greatest expansion of active storage1Active storage is defined as the variable quantity of water in a reservoir. This quantity can be released for hydropower or other purposes, or an empty reservoir can be replenished up to the maximum allowance for active storage. above Pakse occurred between 2005 and 2015 (Figure 3). In total, the largest 38 dams upstream of STRS hold at least 42 cubic km of active storage according to MDM estimates (Figure 4). More than half of this capacity is in the Xiaowan and Nuozhadu dams in China, with most of the balance in several large dams in Laos.
Figure 3: Cumulative Active Storage of Large Dams Upstream of Stung Treng Flooded Forest (Data: Mekong Dam Monitor)
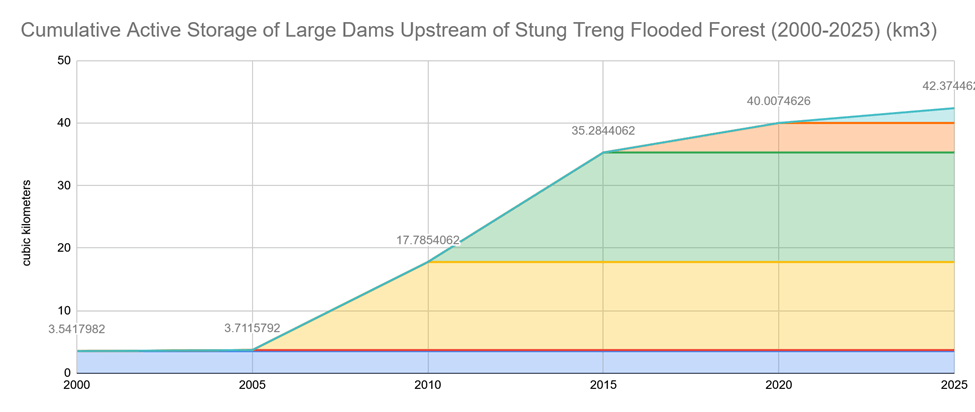
Figure 4: Dams above Pakse ordered by date of completion. (Source: Mekong Dam Monitor)
Although total active storage represents less than 14% of annual discharge to Pakse, its impact on the river’s seasonal flow is substantial and particularly observable during the dry season The total active storage upstream of STRS is equivalent to the pre‑2008 mean dry‑season discharge, meaning that these dams have the capacity to nearly double dry‑season flows if reservoirs are full and release most of their water during this period. Conversely, this same storage can reduce wet‑season flows by 16%. Essentially, these dams have a flattening effect on the Mekong’s hydrological cycle, with greater observable effects during the dry season.
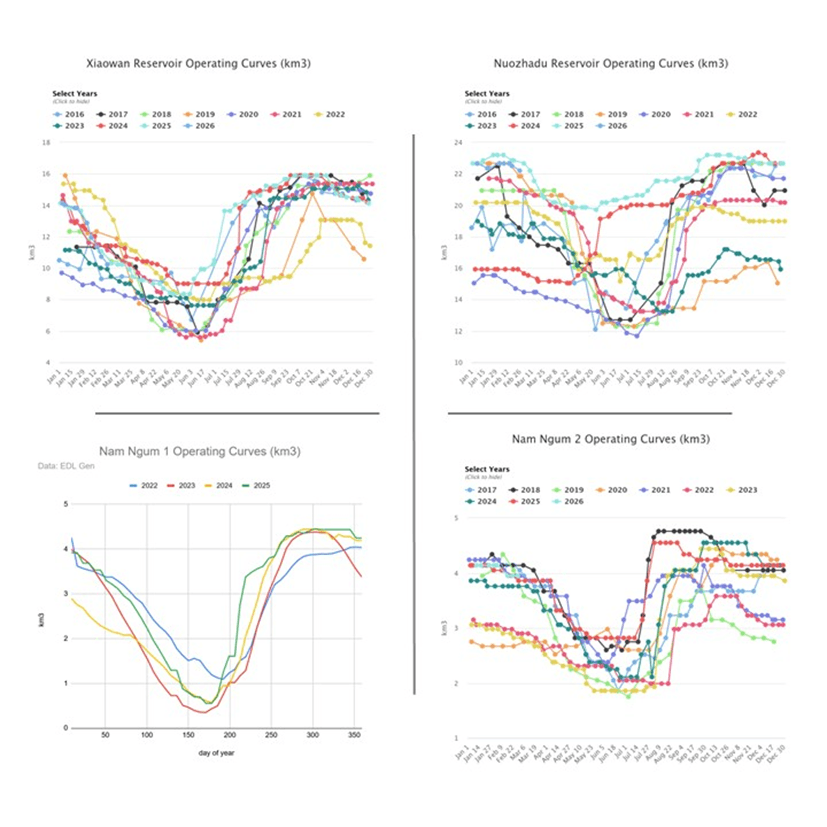
Figure 5: How active storage upstream of Pakse compares to seasonal river flow (Data: MDM and MRC)
Three of the four operating curves shown in Figure 5 are estimated using Mekong Dam Monitor (MDM) methods (Xiaowan, Nuozhadu, and Nam Ngum 2). Operating data for Nam Ngum 1 are sourced from the EDL‑Gen website. In general, the operating curves show how these dams store water during the wet season (June-November) and release stored water during the dry season to support hydropower generation.
Nuozhadu deviated from this typical pattern in 2024 and 2025. In 2024, the reservoir filled earlier than in previous years, during the early months of the wet season. In 2025, the dam released only about 30% of its available active storage. The reasons for these deviations are unknown and may reflect water availability or other seasonal factors. Nonetheless, these departures from past operating patterns indicate that the dam could be operated differently in ways that would reduce alteration of the Mekong’s natural downstream flow regime.
Figure 6: Estimated operating curves of the four largest dams upstream of flooded forest (Source: Stimson Center, EDL-Gen)
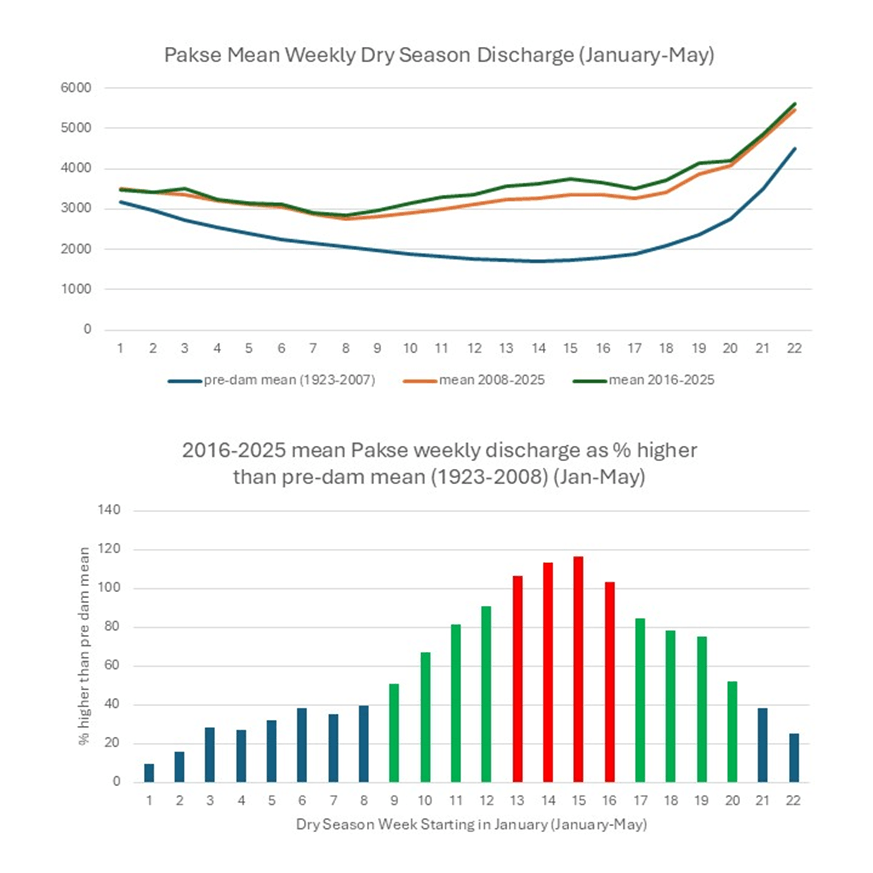
Pakse discharge data confirm this impact. Since 2008, dry‑season discharge has exceeded long‑term historical averages, with the most pronounced deviations occurring between January and May. The seasonal shape of the hydrograph has also changed: The lowest river levels now occur earlier in the dry season, typically in February, rather than in March or April as before. Instead of gradually declining through the dry season, discharge rises sharply during months that were once characterized by low and stable flows. For 12 weeks (roughly end of February through May), discharge at Pakse is more than 150% above the pre-dam mean, and for four of those weeks (roughly end of March through mid-April), discharge is greater than 200% of the pre-dam mean.
Figure 7: Pakse Discharge Analysis (Data: Mekong River Commission)
Community consultations conducted in STRS in December 2025 align with these findings. Residents reported that dry‑season water levels are now much higher than in the past and that the river no longer exhibits clear seasonal lows. Several community members described the river as having “switched seasons,” with high water during the dry months and lower than expected levels during parts of the wet season.
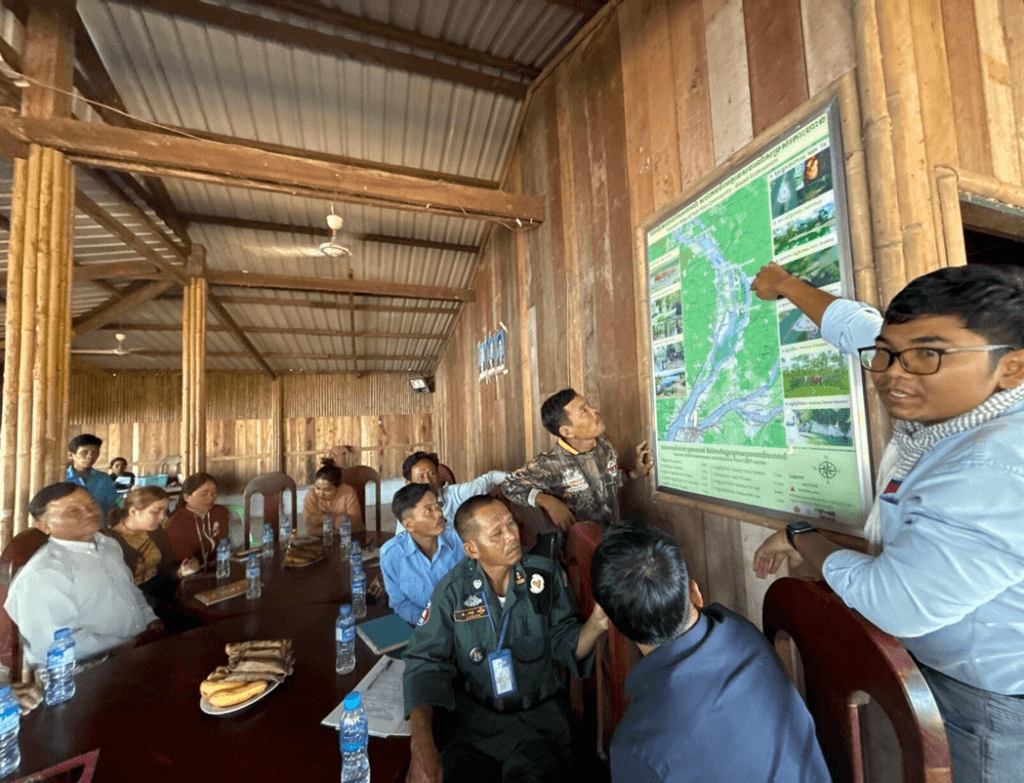
Community consultations held in the STRS in December 2025 (Photo: Austin Lord)
Connecting Dry Season Dam Releases to Flow Increases Downstream
Estimated reservoir releases from upstream dams were aggregated and lagged to approximate the timing of their arrival at Pakse during the dry season. Figure 8 provides evidence that the hydrological alteration observed at the Pakse gauge is a result of upstream dam releases. Cumulative releases were grouped geographically: China (purple), central Laos (teal), and Thailand’s dams (green). By subtracting estimated dam releases from observed discharge, counterfactual cumulative natural flow estimates for the 2022-2025 dry seasons were derived.
Figure 8: (Data: Mekong River Commission, Stimson Center)
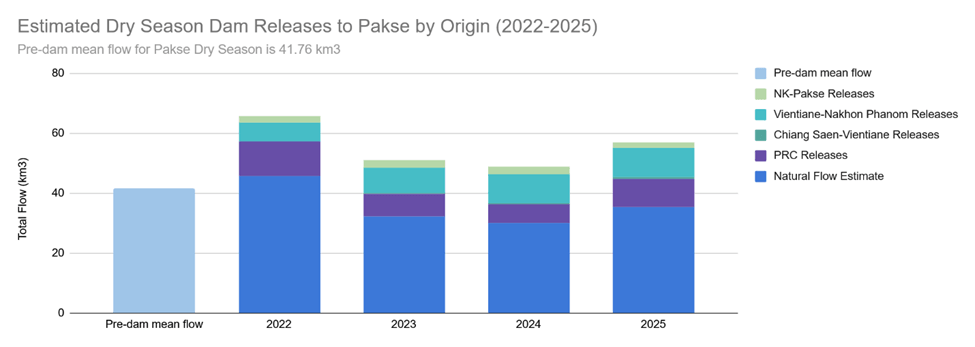
During all years, we estimate that total dry season discharge would have been either close to or below the long-term mean. Importantly, river levels below the long-term mean can be extremely beneficial for trees and vegetation in the flooded forest, which regenerate when river levels are low. In all years, upstream dam operations lifted discharge well above these natural levels. 2022 had the greatest effect of lifting discharge to 157% of the long-term mean. 2023 was 122% higher, 2024 was 116% higher, and 2025 135% higher. This increase varied by year, reflecting both natural hydrological variability and differing reservoir operation patterns, but the impact was consistent: Dam releases prevented the Mekong from reaching ecologically important low‑flow conditions during the dry season.
While China’s dams often contribute the largest single share of dry‑season releases, dams in Laos have a similar — and in some years greater — hydrological impact. This underscores that dry‑season flow alteration is a basin‑wide phenomenon driven by cumulative operations rather than the actions of any single country.
Figure 9 presents a year‑by‑year view of how upstream dam operations altered Mekong River discharge at Pakse during the 2022–2025 dry seasons. Scroll through the four panels that summarize monthly deviations from natural flow conditions and highlight year‑specific operational patterns. Taken together, this analysis shows a consistent outcome across all years: The river rarely, if ever, returns to its long‑term low‑flow conditions. Discharge remains above the historical average in nearly every dry‑season month, with the seasonal low now typically occurring in February rather than March or April. In several mid‑dry‑season months, observed flows exceed 200% of the long‑term average.
Figure 9
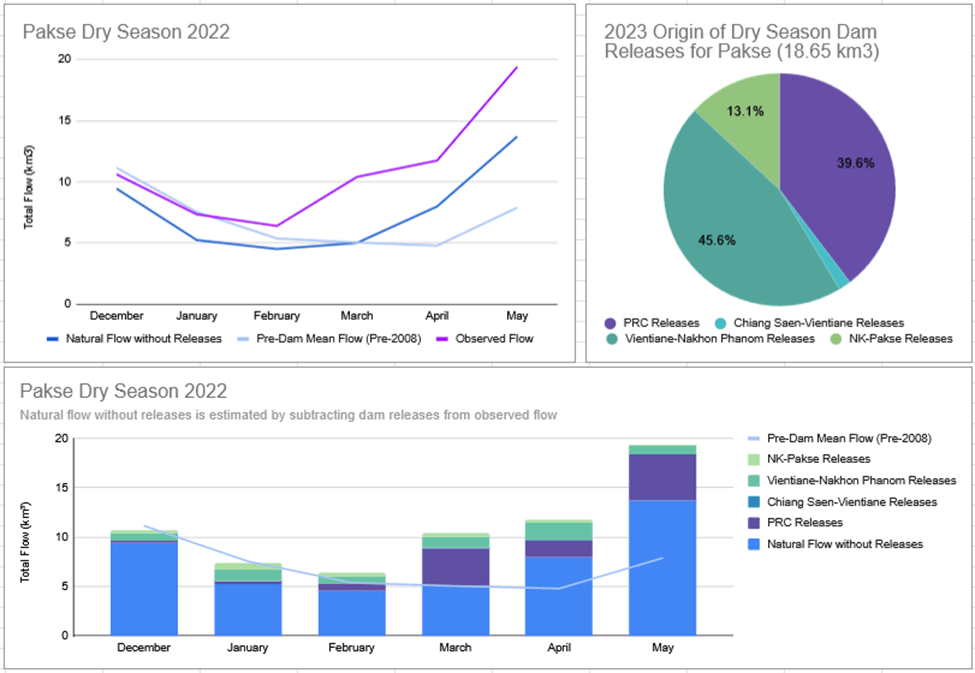
Under natural flow conditions, 2022 dry season discharge would have been lower than the long-term pre-dam average from December to February. Natural flow would have increased to levels above the long-term pre-dam average in April (167%) and May (173%) likely due to unseasonable rains.
Dam releases above Pakse significantly lifted natural flow conditions, and from December to February, observed flow (inclusive of dam releases) tracked close to the long-term pre-dam average. After February, dam releases lifted flow significantly. In March, observed flow was 206% higher than the long-term average, in April 245%, and in May 245%.
Total dam releases equaled 19.98 cubic kilometers, close to the four-year average of 19.74 cubic kilometers. China’s dam releases reached 11.31 cubic kilometers, the highest of all four years of data for China’s dam releases.
56% of dry season dam releases originated from within China. 31.7% originated within Laos between Vientiane and Nakhon Phanom. 10.9% originated within northeast Thailand.
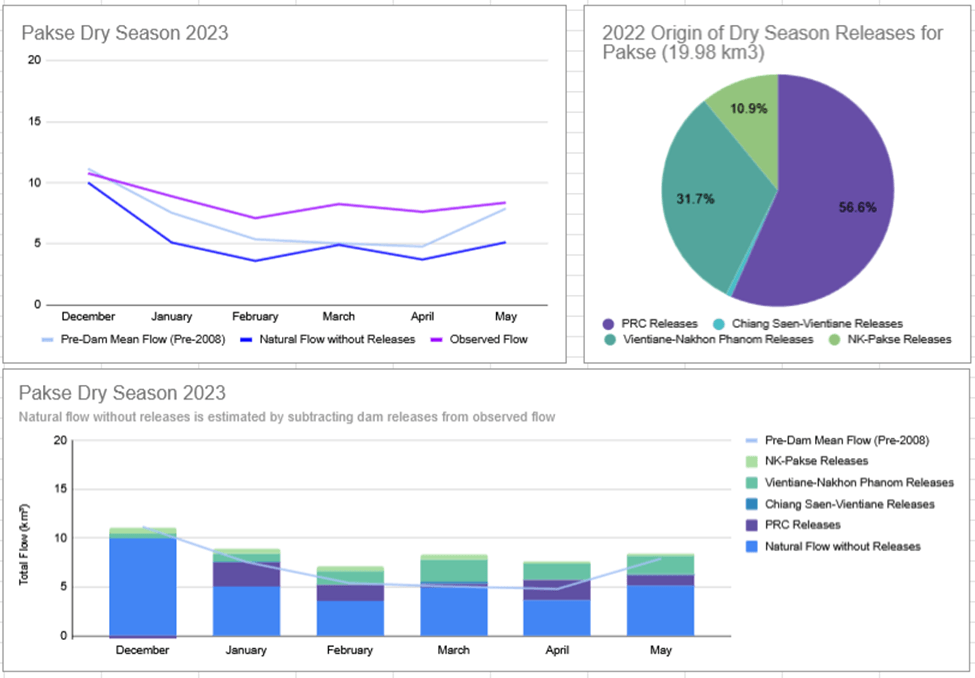
Under natural flow conditions, 2023 dry season discharge would have been lower than the long-term pre-dam average for all months during the dry season with the exception of March, which matched the pre-dam average.
Dam releases above Pakse significantly lifted natural flow conditions particularly between February and April. In February, dam releases increased discharge to 132% of the long-term average. In March and April, dam releases increased discharge to about 160% of the long-term average.
Total dam releases equaled 18.65 cubic kilometers, just under the four-year average of 19.74 cubic kilometers. China’s dam releases totaled 7.4 cubic kilometers (significantly lower than China’s 2022 dam releases, which totaled 11.3 cubic kilometers). Dam releases from north-Central Laos exceeded China’s at 8.5 cubic kilometers.
39.6% of dry season dam releases originated from within China. 45.6% originated within Laos between Vientiane and Nakhon Phanom. 13.1% originated within northeast Thailand.
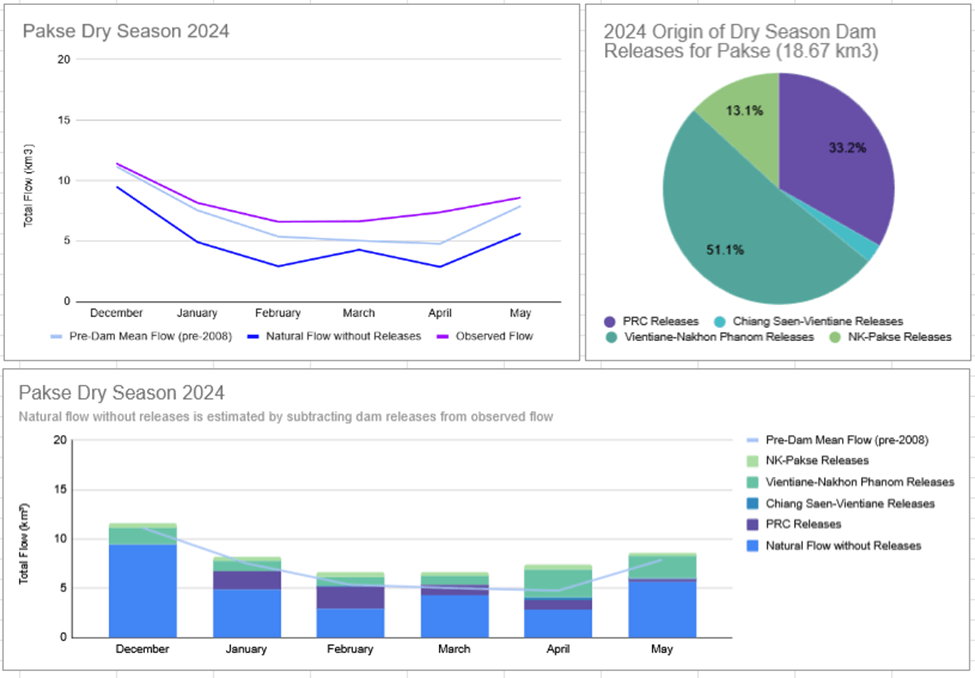
2024’s dry season analysis is similar to 2023. Under natural flow conditions, 2023 dry season discharge would have been lower than the long-term pre-dam average for all months during the dry season. Dam releases above Pakse significantly lifted the river level above the long-term average particularly from February to April. In February, observed flow was 122% of the pre-dam average, in March 132%, and April 154%. So even in relatively low flow years for the river (under natural conditions) dam releases can significantly increase flow to well above the pre-dam average.
Total dam releases equaled 18.67 cubic kilometers, just under the four-year average of 19.74 cubic kilometers. China’s dams released the least amount of water across the four years of study, with 6.2 cubic kilometers. China’s dams also somewhat anomalously released nearly one cubic kilometer of water in November 2023. Dam releases in north-central Laos were much higher than China’s during the dry season with a total of 9.53 cubic kilometers of releases.
33.2% of dry season dam releases originated from within China. 51.1% originated within Laos between Vientiane and Nakhon Phanom. 13.1% originated within northeast Thailand.
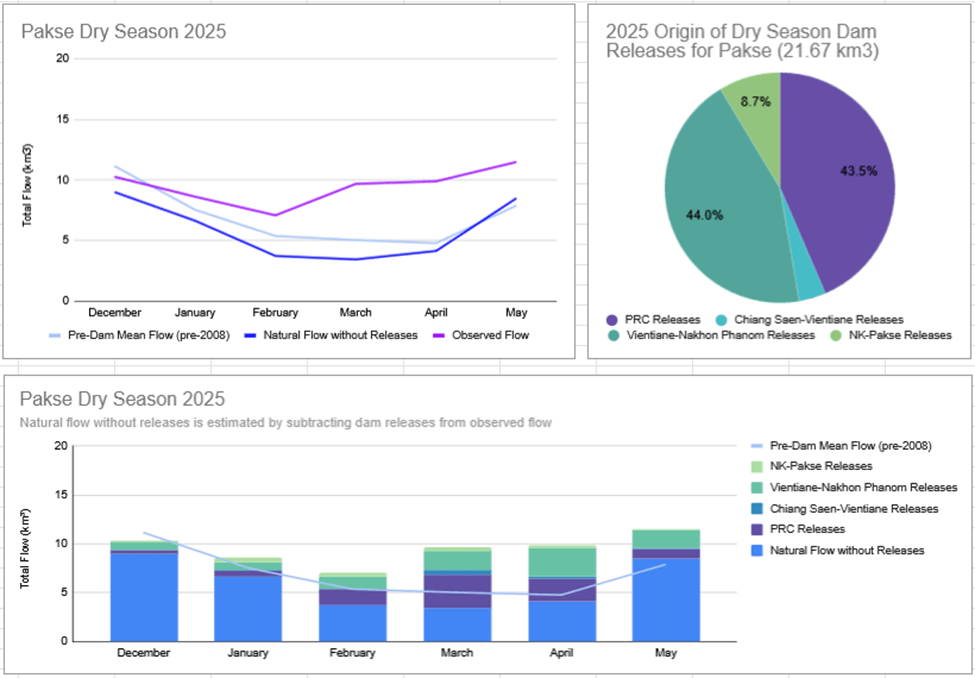
Analysis of 2025’s dry season conditions is similar to 2022, with discharge levels much higher than the long-term average, particularly due to what would have been slightly higher natural flow conditions than the previous two dry seasons and a resumption of significant dam releases from China. Under natural flow conditions, 2022 dry season discharge would have been lower than the long-term pre-dam average from December to April, slightly exceeding the long-term average in May.
Dam releases above Pakse significantly lifted natural flow conditions particularly from January through May. In January, observed flow was 114% of the long-term average, in February 132%, in March 192%, in April 207%, and in May 146%.
Total dam releases equaled 21.67 cubic kilometers, the highest of the four years of this study. China’s dam releases reached 9.43 cubic kilometers, and dams in central Laos released 9.54 cubic kilometers.
43.5% of dry season dam releases originated from within China. 44% originated within Laos between Vientiane and Nakhon Phanom. 8.7% originated within northeast Thailand.
While the magnitude of impact varies by year and by country, China’s dams can at times exert a dominant influence. In 2022 — the most hydrologically altered year in the series — releases from China accounted for 56.6% of total dry season dam contributions. In contrast, dam releases from central Laos exceeded those from China in both 2023 and 2024, while impacts from the two regions were broadly comparable in 2025. This interannual variability underscores that dry season flow alteration at Pakse is driven by cumulative, basin‑wide dam operations rather than any single project or country.
How Landforms and Vegetation Have Changed in the Flooded Forest
Methods
Remote sensing analysis was used to quantify changes in land and vegetation across the STRS flooded forest using images for nine years between 2018 and 2026, a period chosen due to data availability. The indicator applied was the Normalized Difference Vegetation Index (NDVI), a widely used metric derived from red and near infrared light reflectance that provides a proxy for vegetation density and health at the pixel scale. However, there are known limitations with using NDVI which restrict this research’s interpretation of the changing flooded forest landscape. Ecological impact from consistently high dry season water levels on plants species vary depending on their habitat; NDVI cannot distinguish between species, many of which are significantly smaller than spatial resolutions currently available for remote sensing analysis. For the purposes of this research, remote sensing analysis covers changes to remaining trees consistently submerged, trees only submerged during the wet season, and some critical islands and terrestrial forests that have been impacted by the loss of riparian forests. Finally, as losses in the flooded forest have been documented as having begun prior to 2018, much of what is left are likely the most resilient plant species, and particularly species that grow higher up in the riverbed, largely tree species that can endure hydrological alterations longer than more vulnerable species.
To define the region of interest, the maximum wet season extent of the river was delineated using Sentinel-1 radar imagery. This allowed high areas that are never flooded to be excluded from the analysis, leaving behind landforms and vegetation that are either permanently flooded or seasonally submerged. The resulting region of interest includes the sections of the STRS that include flooded forests and terrestrial forests flooded for a portion of the year located along the edges of islands.
In order to accurately measure year-on-year loss of land and vegetation, we used MRC river level data for Pakse to identify dry season optical images from Planet Labs that correspond to the same or similar river level conditions over the course of the 2018-2026 period. We prioritized finding comparative imagery at relatively low levels in order to analyze as much exposed land within the flooded forest as possible. This approach reduces the risk of overstating loss simply because more land was exposed in some years than others.
Finally, the quality of the Planet Labs Planetscope data has limits. The 3-meter spatial resolution provides a level of analysis necessary to locate and track changes to some of the smaller groves of trees in the flooded forest; however, because tracking minute changes to the flooded forest requires high precision, any spatial misalignment across satellite images could lead to imprecise calculations. While this limitation makes precise calculations at the scale of an entire river segment challenging, it is still possible to track and understand changes by scaling down and analyzing hot spots around the STRS, such as the three highlighted in the results section below.
While these methods can generally measure land and vegetation loss, further studies conducted by specialists can, either through more developed remote sensing methods or through on-the-ground field research, determine what species, whether trees, bushes, or grasses, have experienced the greatest rate of decline. Additionally, more field-based scientific research can identify the growth patterns of important species to the flooded forest and the ecological connections and interdependencies formed between those species.
Results
Across the flooded forest, we estimate more than 500 hectares, about 18% of the total land and vegetation area, were lost between 2018 and 2026 (Figure 10). Losses were not evenly distributed across time. Two periods stand out, 2018-2019 and 2024-2025, when landmass and vegetation loss decreased by 10% during both periods. These periods also coincide with reports of unusually high dry‑season water levels and intense wet‑season storms such as Typhoon Yagi in September 2024.
Figure 10
The two periods previously mentioned correspond with findings from interviews conducted with community members and fisherfolk during field consultations in December 2025. Villagers across three focus groups from communities in different parts of the flooded forest often noted 2018 as a year when major changes to the flooded forest occurred, although Baird and Thorne (2023) note their conversations with villagers in 2022 suggest that unnatural tree death and disappearance of flooded forests, especially species growing in lower parts of the river, began prior to 2018. Observations of this period included island erosions, later wet season peaks, and consistently higher-than-normal water levels during the dry season. Villagers noted that 2025, particularly July to August, had been more severe than the previous few years because of storms inundating the Mekong basin further upstream. Over this period, villagers estimated that 30% of the flooded forest had died out and all islands had experienced some level of erosion.
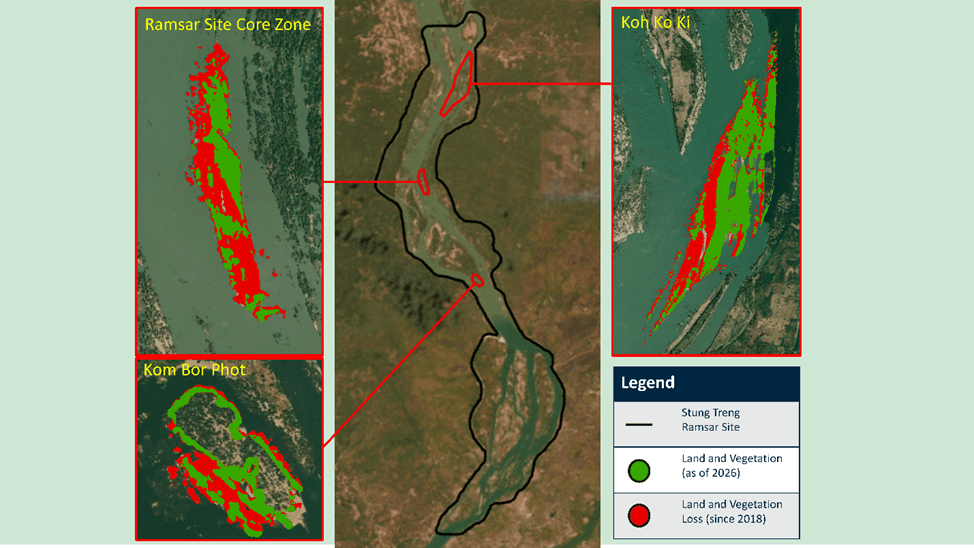
To show how these processes play out, three areas in the STRS were selected for detailed analysis: Koh Ko Ki, Ramsar Site Core Zone Island, and Kom Bor Phot Area (Figure 11).
Figure 11: Focal areas of significant land and vegetation loss in the STRS
Koh Ko Ki:
Koh Ko Ki is one of the largest islands near the upper boundary of the STRS, and according to community interviews, this island and its neighboring smaller islands have been used for farming since the 1960s. Between 2018 and 2026, the island and nearby vegetation experienced a 35% loss in area, or 62 hectares (Figure 12). Early losses occurred gradually along the island’s margins, particularly at the northern tip and southwestern edge. Between 2024 and 2026, the western half of the island eroded dramatically. This loss was driven by extreme river conditions during the wet season, but the island had been progressively weakened over preceding decades by persistently high dry-season water levels. Those sustained dry-season conditions slowly killed riparian trees and shrubs that once stabilized the banks, leaving sandbars and riverbanks exposed to the full force of wet-season flows.
Figure 12
The earliest signs of collapse appeared in 2020 along the island’s northwestern edge, where a small river braid began carving into and scouring the riverbank. Erosion intensified along this same braid in 2023. By the following dry season, the smaller island section separated from the main landmass by this channel had washed away, further exposing the already-eroded western side of Koh Ko Ki.
During the 2024 wet season, a substantial portion of the island’s western half collapsed, leaving a newly formed sandbar and isolating riparian trees and shrubs that had once defined the riverbank. Erosion continued into the subsequent dry season, and, as reported by community members during a field visit and confirmed by satellite imagery, the southern half of the island also collapsed. The newly exposed areas then separated and washed away, stripping most of the remaining vegetation and leaving only a few small clusters of trees where the original riverbank once stood.
Figure 13: 2018-2026 visual timeline of change at Koh Ko Ki
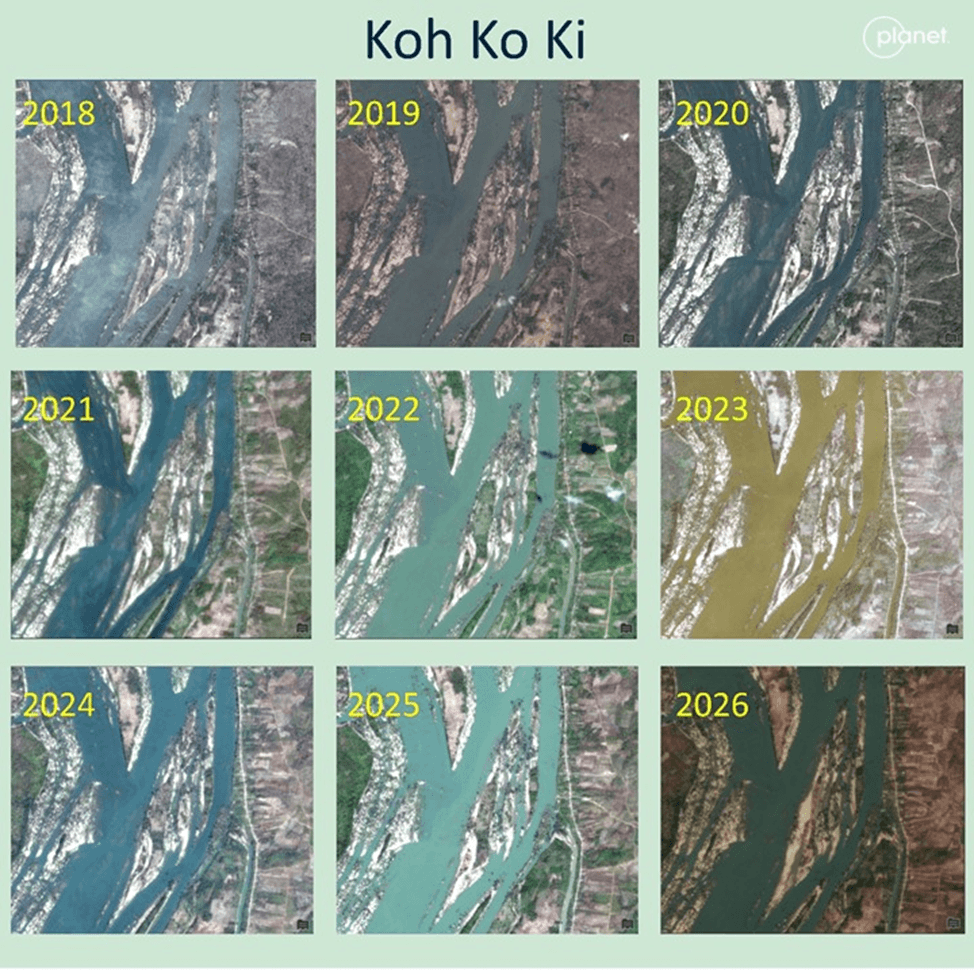
Planet Labs Planetscope imagery of Koh Ko Ki from 2018 to 2026.
STRS Core Zone
This site experienced the greatest proportional loss, declining by 59% (19 hectares) between 2018 and 2026 (Figure 14). From 2018 to 2023, annual losses ranged from 1–8% in landmass and vegetation. Comparisons across satellite imagery reveal consistent patterns of vegetation die-off along the island’s margins, particularly within the northern riparian forest and along the western edge. Because the island is largely submerged during the wet season, imagery also shows evidence of gradual scouring that likely occurred during preceding wet seasons. The declining presence of large vegetation, such as mature trees and shrubs, has reduced bank stability and increased susceptibility to scouring and erosion on this seasonally inundated island — processes that are further amplified by the hungry-water effect associated with upstream dam operations and increasingly intense and prolonged wet-season weather events (Kondolf et al., 2014).
Figure 14
The most severe losses occurred in the final two years of analysis, with landmass and vegetation declining by 25% in 2025 and a further 31% in 2026. Satellite imagery shows continued degradation of riparian vegetation, particularly along former riverbanks and within flooded forest north of the island, accompanied by pronounced changes in island morphology. Images were selected from dates when observed water levels fell within an allowable range based on the highest minimum water level recorded between 2018 and 2026. As a result, the disappearance of island surfaces that were exposed in 2018, but absent by 2025 and 2026, is most plausibly attributed to intense scouring and erosion during the two preceding wet seasons. These processes have produced new, and likely permanent, river channels across formerly low-lying portions of the island, exposed bare soil and sand following vegetation die-offs, and reduced once-contiguous forested areas to isolated clusters of trees that continue to withstand extreme weather and persistently elevated dry-season water levels.
Figure 15: 2018-2026 visual timeline of change at the STRS Core Zone
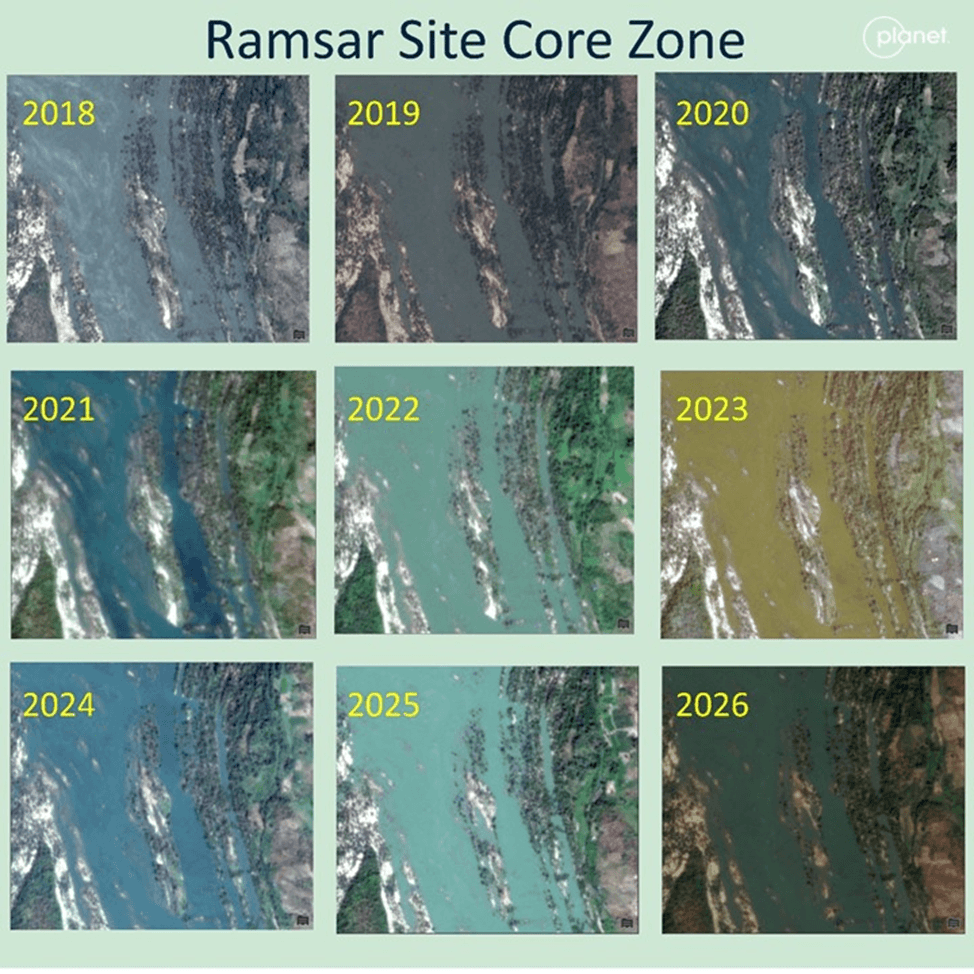
Planet Labs Planetscope imagery for the Ramsar Site Core Zone area from 2018 to 2026.
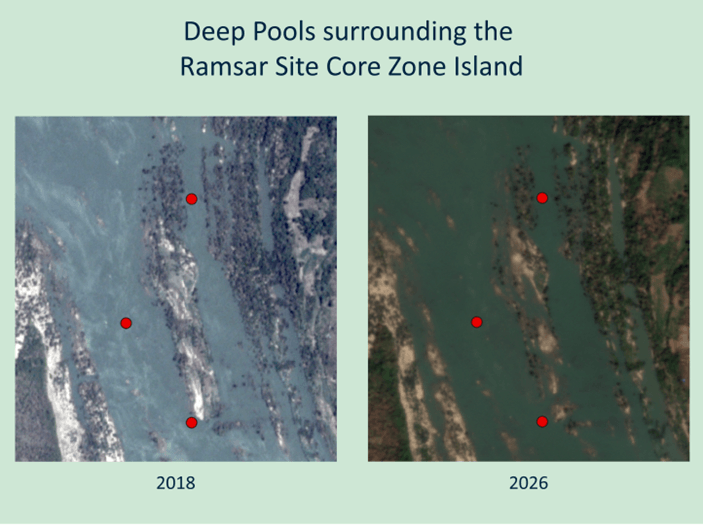
This island is notably surrounded by three deep pools. These deep pools are distributed across the Ramsar Site, but many are located around Koh Phone Kep, including these three. They are integral to aquatic biodiversity, especially in the dry season when they act as refuge habitats and spawning areas, and play a critical role in the life stages of fish (Cowx et al, 2024). Additionally, these areas have been identified as habitats for endemic fish species like the endangered Mekong giant catfish, giant stingrays, and giant barbs (Mongabay, 2022). Although it is not possible to observe changes to these deep pools using optical satellite imagery, as conducted in this research, there are understood pathways to how these deep pools may be threatened by ecological changes due to nearby land and vegetation loss, including the filling of these pools with silt and sediment (MRC 2005).
Figure 16: Locations of deep pools around the unnamed island east of Koh Phone Kep in 2018 and 2026. Data source: Planet Labs, IUCN
Kom Bor Phot
The final spotlighted area focuses on an unnamed island in the Kom Bor Phot area immediately south of Koh Hib island. This area is similar to the Ramsar Site Core Zone in terms of seasonal inundation: During the wet season the island is submerged with only trees appearing above water. Analysis of this area shows a steadily sharp decline in land and vegetation from 2018 to 2026. Much of this loss comprises riparian vegetation die-offs around and within the island and scouring and erosion of loosened or exposed sediment.
Over the nine-year period of analysis, the surface area of land and vegetation declined by approximately 41%, equivalent to about 5.6 hectares. Two periods of sharp loss stand out: 2019, when land and vegetation declined by 13%, and 2025, when losses reached 21%. Although the overall trend is one of decline, satellite imagery and corresponding data also show intermittent year-to-year increases in surface area. These gains most likely reflect the formation of “new” land surfaces, particularly at the southern tip of the island, where eroded and scoured sediment settles and accumulates. Over time, this process causes the island to appear elongated, with newly formed mudflats or sandy shorelines relative to earlier imagery.
Figure 17
The earliest signs of degradation emerged in 2019, marked by die-offs of riparian tree groves on the southwestern side of the island and noticeable sediment and soil movement at the southern tip. In subsequent years, increasing areas of exposed sand and bare soil became visible, indicating a gradual thinning of what was once dense vegetation. By 2026, the island had visibly narrowed, with substantial losses of land and vegetation along the northeastern and southwestern margins, even as sediment continued to accumulate at the southern end. As the remaining riparian trees in the southwest continue to die off, the loss of vegetation that once dampened the force of wet-season flows and storm events is likely to accelerate further deterioration, leaving the increasingly vegetation-sparse island more exposed to seasonal river dynamics.
Figure 18: 2018-2026 visual timeline of change at Kom Bor Phot
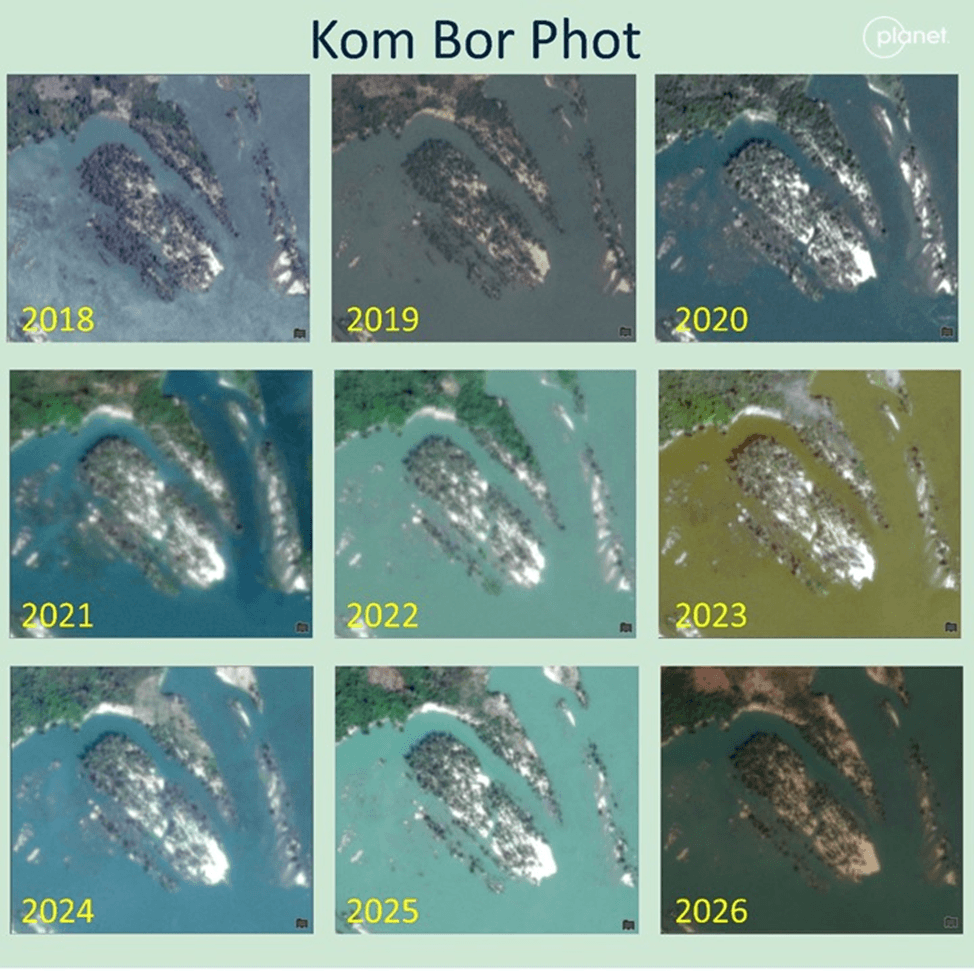
Planet Labs Planetscope imagery of Kom Bor Phot from 2018 to 2026.
Recommendations
The recommendations below suggest feasible pathways for action to conserve the STRS without compromising regional energy security. A top priority is to restore the low‑flow window in February-May while maintaining energy generation through shifting storage management and release timing to earlier and possibly later periods in the dry season.
- Re‑time dry‑season dam releases: Shift a portion of dam releases from February-May to November-December; target lower weekly discharge at Pakse during weeks 9-20 (week 1 is the first week of January), moving closer to the pre‑2008 hydrograph. Use January as a gradual ramp‑down period and avoid late dry‑season pulses that raise water levelsinweeks 13-14.
- Operate large reservoirs to reduce alteration, not only to meet generation: Adjust operations of the Xiaowan and Nuozhadu dams in China and large dams in Laos to prioritize earlier wet‑season recharge and slower dry‑season drawdown. 2024-2025 deviations at Nuozhadu when the reservoir did not fill or release water following previously operational patterns indicate operational flexibility that can be institutionalized. Because of the diversification of energy sources in southern China, there is less dependence on Lancang hydropower and therefore more scope to adjust dam operations to allow ecological recovery downstream.
- Publish routine operations information: Expand daily/week-ahead public reporting of reservoir levels throughout the basin, including planned releases for major dams. This enables a coordinated approach to shaping the dry season hydrograph and transparent performance tracking to evaluate which dam operators are acting in a way that reduces ecological damage downstream.
- Continue to research and chronicle loss in the flooded forest: Our methods provide a general picture of land and vegetation loss but further refinement and downscaling via in-situ field work or evolved remote sensing methods can identify loss per species in the flooded forest and build awareness around the forest’s ecological connections such as how the loss of one species can lead to the loss of others.
- Protect critical habitats now: Designate and enforce protection of deep pools and erosion hotspots adjacent to high‑loss islands.
- Avoid premature reforestation schemes: Community consultations revealed that local officials in Cambodia are considering planting trees to replace those that have died in an attempt to reinforce the geological integrity of the islands in the STRS. Such reforestation projects will inevitably fail under consistently elevated dry‑season levels. However, sequencing restoration after hydrological adjustment produces a stable exposure period for seedling survival.
- Institutionalize joint monitoring and adaptive management: Establisha technical working group to maintain the satellite‑based operations archive, integrate MRC data, and conduct quarterly reporting on hydrology and habitat indicators; add UAV surveys at priority sites for higher‑precision tracking.
NOTE: This report was originally launched on April 27, 2026. The current version of this report updated on May 11, 2026 reflects updates on the limits of the NDVI tool to measure loss of vegetation and improved clarity on when loss of vegetation and land started. We are grateful to Dr. Ian Baird for a request and guidance for these improvements. The updates do not significantly alter the results of the originally published study.
This report is generously supported by the BRIDGE (Building River Dialogue and Governance) Project, which aims to build water governance capacities through learning, demonstration, leadership, and consensus building and is funded by the Swiss Agency for Development and Cooperation and implemented in Cambodia, Lao PDR, and Vietnam by IUCN.


Community Adaptation for a Water Festival Without Clean Water