
This report presents the CORVI Climate Risk Summary Report for the Western Province of Sri Lanka.
As risks from climate change to coastal cities continue to increase, governments, public and private investors, and the insurance industry need targeted risk information to prioritize action and build resilience where it matters most. In response, the Stimson Center developed the Climate and Ocean Risk Vulnerability Index (CORVI). CORVI is a decision support tool which compares a diverse range of ecological, economic, and social risks across 10 categories and nearly 100 indicators to produce a holistic coastal urban risk profile. The full CORVI assessment provides a much more in-depth analysis, which requires 15-18 months, while a rapid assessment provides a higher level of analysis in a 6-month timeframe.
This Climate Risk Summary Report is one of three CORVI Rapid Assessment Protocol pilot projects taking place in Sri Lanka, Kiribati, and Barbados, developed in partnership by the Commonwealth Secretariat’s Blue Charter program and the Stimson Center, with cooperation and participation by government representatives from each pilot country.1The project partners would like to thank the Government of Sri Lanka for their support and cooperation as well as the project’s funders, the Ocean Risk and Resilience Action Alliance (ORRAA). This pilot CORVI Rapid Assessment is a condensed version of the CORVI methodology.2To read more about the CORVI methodology, please visit https://stimson.org/project/corvi/resources-research/methodology/ It assesses the 30 highest priority CORVI risk indicators across 10 categories, selected by local stakeholders. Each risk indicator and category are scored using a 1-10 risk scale relative to other locations in the region. The CORVI Climate Risk Summary Report combines these risk scores with information from stakeholder workshops, surveys, desk research including secondary data to analyze how climate and ocean risks are impacting the study area, in this case, the Western Province of Sri Lanka. This information is used to develop high-level priority recommendations for the Government of Sri Lanka and other key stakeholders to reduce climate vulnerabilities and work to build a sustainable future.
Further, there is potential to build on the rapid assessment and undertake a future full CORVI risk analysis which offers a more comprehensive profile of the climate risks and more targeted recommendations. The purpose of the rapid assessment is to provide initial high-level findings or results for a country allowing for the development of further climate risk initiatives or progression to the full CORVI assessment.3For more information on the methodology, please see the section entitled CORVI Rapid Assessments. A complete list of the risk indicators used for the Western Province rapid assessment is provided below. In addition, a list of organizations who responded to surveys is included in Appendix 1, and a detailed methodology is provided in Appendix 2.
Summary Findings
The Western Province of Sri Lanka is the most densely populated and most urbanized province of Sri Lanka and is home to the country’s capital and commercial center of Colombo. The province is comprised of three districts: Colombo, Gampaha, and Kalutara. The province is home to over 5.8 million people according to the 2012 Census, an increase of almost 50 percent since the 1981 Census. Colombo Port, one of the 25 largest ports in the world and a major regional transshipment point, is located in the Western Province and the Kelani River, one of the largest rivers in the country, flows through Colombo and provides 80 percent of its drinking water. To capture how climate change is interacting with environmental and urbanization challenges, the geographic scope of this report consists of the entire province.

The CORVI Rapid Assessment identified significant vulnerabilities in Financial and Political Risk, particularly in the Economics category, highlighting the recent state of affairs of a country currently in the midst of its worst economic crisis since independence in 1948. The highest risk indicator is the Debt Ratio (9.17), which has been a consistent challenge in the country’s history as it has obtained 16 loans from the International Monetary Fund since 1965.4R. Ramakumar, “What’s Happening in Sri Lanka and How Did the Economic Crisis Start?,” The Conversation, April 13, 2022, https://theconversation.com/whats-happening-in-sri-lanka-and-how-did-the-economic-crisis-start-181060. Accompanying this has been a large informal economy, the third-highest risk indicator (7.72). Smaller, less efficient firms, unable to access formal credit, characterize a large informal economy and constrain economic growth. These challenges are further exacerbated by annual flooding, which the World Bank has projected may cause average annual losses of approximately $800 million, equivalent to one percent of Sri Lanka’s economy. 5Nadeera Rajapakse, Caitriona Palmer, Priyanka Dissanayake, and Thalyta Ernandya Yuwono, “Can Nature-Based Solutions Be an Answer to the Climate Crisis?,” World Bank Blogs, February 3, 2022, https://blogs.worldbank.org/endpovertyinsouthasia/can-nature-based-solutions-be-answer-climate-crisis.
Sri Lanka experienced rapid growth in tourism from 2009 through 2018, and the government has identified tourism as a key source of income from foreign countries. Tourist arrivals dropped in the following years, however, due to a series of bombings on Easter in 2019, the COVID-19 pandemic in 2020 and 2021, and instability driven by the current economic crisis in 2022. Another economic pillar of the Western Province is Colombo Port, though it faces growing risks from increasing congestion. Additionally, two major shipping accidents have occurred in Sri Lankan waters in recent years, highlighting the country’s vulnerability more generally to such events.
Major changes in population structure also pose potential risks to the Western Province, and Sri Lanka more generally. Sri Lanka has been urbanizing rapidly since the end of its civil war in 2009, and much of that population growth has occurred in the Western Province. This increase has put pressure on the built environment and natural systems, including transportation infrastructure and marine ecosystems such as wetlands and mangroves. At the same time, the Sri Lankan population is aging; more than 12 percent is already aged 60 or older, the highest in the region, with that figure projected to rise to over 25 percent in a decade and a half.6“Growing Old Before Becoming Rich: Challenges of An Aging Population in Sri Lanka”, Asian Development Bank, December 2019, https://www.adb.org/publications/growing-old-becoming-rich-sri-lanka. An aging population will put pressure on the country’s healthcare and pension systems, reducing the resources available to respond to climate risks. In addition, an aging population will increase the challenge of responding to extreme weather events, such as flooding and extreme heat.
The number of flood events and nearshore fish stock status are the highest ecological vulnerabilities for the Western Province. The province frequently experiences heavy flooding due to heavy rains, which often impacts those living in informal settlements the most.7“Flooding in Sri Lanka 2018,” JBA Risk Management, 2019, https://www.jbarisk.com/flood-services/event-response/flooding-in-sri-lanka-2018/. Severe flooding occurred in 2019 and 2021, displacing hundreds of thousands of people nationwide, including the Western Province. Heavy rainfall and flooding can also exacerbate sediment and nutrient runoff and untreated wastewater discharge into coastal waters. The impacts of flooding have been exacerbated by the progressive degradation of the area’s wetlands for decades. Those waters provide the foundation for a coastal fishing industry that accounts for the majority of total fish production in Sri Lanka. Fish make up half the average annual animal protein intake for Sri Lankans, three times the global average. Pollution, a rapid increase in the coastal fishing industry, and habitat destruction have driven declines in these crucial coastal fish stocks, putting Sri Lanka’s food security at risk.8“Priorities for Sustainably Managing Sri Lanka’s Marine Fisheries, Coastal Aquaculture, and the Ecosystems That Support Them” World Bank, September 2021, https://openknowledge.worldbank.org/handle/10986/36503.
In cooperation with external partners, Sri Lanka has taken several key steps to strengthen coastal resilience, especially around the vulnerability of the Western Province to flooding. Supported by the World Bank, the Metro Colombo Urban Development Project (MCUDP) has worked for nearly a decade to mitigate flood risk in Colombo through artificial and natural infrastructure, including conserving the city’s remaining wetlands.9Rajapaske, Palmer, Dissanayake, and Yuwono. To assist with rebuilding after flooding events, the National Natural Disaster Insurance Scheme (NNDIS) provides insurance for uninsured households and small businesses affected by natural disasters. The NNDIS focus on low-income households, who often live in informal housing, and microenterprises, which are usually part of the informal economy. These two groups are usually among the worst affected by flooding,10“Flooding in Sri Lanka 2018.” and both have a significant presence in the Western Province, as seen in the risk scores for unplanned settlements and informal economy. In addition, Sri Lanka’s National Adaptation Plan outlines priority actions for 10 key sectors, several of which overlap with the vulnerabilities identified in this assessment. The government of the Western Province also developed a climate change adaptation plan for the period 2015-2018 which recognized the importance of mainstreaming climate risk into provincial planning processes and improving climate resilience of both its residents and the built environment.
Summary of High-Level Recommendations
Based on an analysis of the CORVI risk scores, stakeholder workshops, and desktop research, three priority areas for action have been identified by the CORVI rapid assessment:
- Invest in climate-smart infrastructure and community-based adaptation in vulnerable neighborhoods. The MCUDP has helped to mitigate flood risk, but Sri Lanka can take additional steps to reduce the impacts of flooding in the most vulnerable neighborhoods. This may include a strategic combination of actions such as improving and clearing drainage systems, replacing concrete and pavement with permeable surfaces, restricting development on wetlands and floodplains, and creating spaces that can retain rainwater. Multi-sectoral partnerships to share knowledge, expertise, and resources are likely to improve the success of such measures. Incorporating community-based organizations is particularly valuable, both in the decision-making process and in the implementation of infrastructure projects and early warning systems.
- Build resilience in marine and coastal ecosystems. Marine and coastal ecosystems in the Western Province provide vital ecosystem services that can mitigate the impacts of frequent flooding. These services include flood control, water purification, and erosion regulation. The national, provincial, and local governments could expand their work and partner with the private sector to conserve remaining wetlands, mangroves, seagrass, and coral reefs. This work could include both new government regulations as well as better government enforcement of existing regulations, such as the ban on coral mining. Further, there is a need for better management of solid waste, wastewater, and agricultural runoff to minimize the contamination of marine ecosystems. The government might also consider debt-for-nature swaps, which forgive a portion of a country’s external debt in exchange for passing environmental policies and commitments to improved biodiversity conservation.
- Enhance the climate adaptability of key industries. The tourism, garment production, shipping, and agriculture industries comprise a major part of the Sri Lankan economy. Mitigating these sectors’ exposure to climate risks such as increasing temperatures, drought, and flooding is important. Similarly, reducing any associated negative impacts on coastal and marine ecosystems, such as solid waste pollution and chemical contamination from shipping accidents is also important. For tourism, this includes building awareness of climate risks and mitigation strategies among industry stakeholders, improving regulations around solid waste management, and establishing plans to coordinate response in the event of an extreme weather event. For shipping, there is a need to focus on enhancing safety standards and improving accident response plans to reduce the sector’s harms to coastal and marine ecosystems, thereby helping to preserve the benefits offered by those ecosystems. For agriculture, the government could work with community-based organizations to improve uptake of climate-smart agricultural practices, including flood- and heat-tolerant crop varieties, seasonal-adapted planting schedules, and dry sowing techniques.
Pilot CORVI Rapid Assessments
Island states and coastal cities are at the forefront of the climate crisis. Rising sea levels, extreme storms, and heat events are amplifying the vulnerability of citizens. At the same time, island states and coastal cities face underlying economic and social concerns, such as expanding populations, limited resources, and aging infrastructure, at times compounded by poor governance. These interconnected pressures threaten ocean and land-based ecosystems, which are critical for economic and food security. To combat these systemic risks, decision makers need information to help them prioritize actions to build resilience through climate-smart policies, including increased use of nature-based solutions. However, rigorous data collection and subsequent integrated analysis necessary for the development of successful solutions are resource intensive and out of reach for many Small Island Developing States (SIDS) and developing coastal states.
The Stimson Center and the Commonwealth Secretariat partnered to pilot a rapid climate risk assessment methodology in three Commonwealth countries (Sri Lanka, Barbados, and Kiribati) under the Commonwealth Blue Charter program. The project is based on the cross-cutting methodology of the Climate and Ocean Risk Vulnerability Index (CORVI). Developed by the Stimson Center, CORVI produces comprehensive risk profiles for coastal cities and island states and helps leaders make climate-smart investments designed to build cross cutting climate resilience in their country. The Commonwealth Secretariat led country engagement, review, and advisory support, while the Stimson Center led the research and conducted the analytical work. An in-country engagement officer was contracted to support the project. She assisted in the selection of diverse experts from the national government along with private sector and NGO stakeholders, who helped identify priority areas of climate risk.
To adapt the CORVI methodology for a rapid assessment, the 97 indicators used in a full CORVI assessment were reduced to thirty, three indicators for each of the ten risk categories (see Figure 1 below), in consultation with national stakeholders.

Fifty-one expert surveys were collected from 28 subject matter experts in Sri Lanka. Note: Experts are defined broadly, as described in USAID’s Climate Vulnerability Assessment: An Annex to the USAID Climate-resilient Development Framework. Experts include: Key donors, responsible ministries, NGOs, universities, research institutions, local planning and other departments, private sector, sector/livelihood organizations, vulnerable populations, etc. Risk scores for each of the 30 indicators were calculated using expert surveys and pre-existing secondary data collected for Southern Asia during prior full CORVI assessments.

A complete list of the indicators used for the Western Province rapid assessment is provided on the next page. In addition, a list of organizations that provided surveys is included in the appendix.
CORVI Analysis
The following sections provide a greater level of detail on the climate risks faced by the Western Province of Sri Lanka delineated by the 30 selected indicators across ecological, financial, and political risk areas.
Ecological Risk
Ecological risks in the Western Province are spread across the four categories of Climate, Ecosystems, Fisheries, and Geology/Water. The risk scores are also very similar; on a 1-10 scale, the lowest score is 4.84 and the highest is 6.52. Ten of the 12 indicators are rated as medium-high risk and the two rated as medium risk fell just below the threshold.
- In the CLIMATE category, Number of Flood Events (6.40) is the second-highest risk indicator in Ecological Risk, reflecting the heavy flooding the area often experiences. Change is Sea Surface Temperature (5.57) is also rated as medium-high risk while the Number of People Affected by Extreme Weather Events (4.84) is scored as medium risk.
- All three of the selected indicators in the ECOSYSTEMS category are rated as medium-high risk. The two highest risk indicators in the category, Incidence of High Invasive Species Abundance (6.13) and Rate of Occurrence of Harmful Algal Blooms (5.86), reflect some of the possible secondary effects of rising terrestrial and marine temperatures.
- All three of the selected indicators in the FISHERIES category are rated as medium-high risk, including Nearshore Fish Stock Status (6.52), the highest risk indicator in Ecological Risk, which reflects the area’s reliance on overexploited coastal fisheries.
- In the GEOLOGY/WATER category, Rate of Coastal Erosion (5.85), and Degree of Saltwater Intrusion in Coastal Aquifers (4.95) show the moderate but real vulnerabilities associated with rising sea levels. Percent of Study Area at Risk of Flooding (5.65), which includes coastal and runoff flooding, is also scored medium-high risk.
The Western Province has experienced repeated incidents of major rainfall flooding. In just the last ten years, large floods have occurred in 2016, 2017, 2019, and 2021. Given the future increased intensity and frequency of heavy rainfall, flooding is likely to pose an ongoing challenge. The Western Province of Sri Lanka has a particular history of vulnerability to flooding; one of the main river basins in Sri Lanka, the Kelani River, flows through the center of Colombo. The flooding that occurred in May 2016 was particularly damaging as the Kelani catchment area received 350mm of rain across three days, resulting in inundation that killed 104 people, damaged more than 4,000 houses, affected more than 340,000 people, and caused close to $310 million in economic damages to households, with the Western Province one of the worst hit.11“Flooding in Sri Lanka 2018.” A year later, severe flooding driven by a heavy southwest monsoon and the precursor system to Cyclone Mora resulted in 246 deaths and displaced over 600,000 people across the country, with the Western Province again severely affected.12Mahinda Senevi Gunaratne, R. B. Radin Firdaus, and Shamila Indika Rathnasooriya, “Climate Change and Food Security in Sri Lanka: Towards Food Sovereignty,” Humanities and Social Sciences Communications, October 12, 2021, https://doi.org/10.1057/s41599-021-00917-4. The United Nations Office for Disaster Risk Reduction found that by the 2030s, average annual losses from disaster – of which floods are the largest contributor – is expected to increase to 26,000 people and $338 million under RCP8.5.13“Climate Risk Country Profile: Sri Lanka”, World Bank Group and Asian Development Bank, September 24, 2021, https://doi.org/10.1596/36371.
The commercial fisheries sector plays a key role in Sri Lanka’s economy14“FAO Fishery Country Profile: Sri Lanka”, Food and Agriculture Organization, January 2006, https://www.fao.org/fishery/docs/DOCUMENT/fcp/en/FI_CP_LK.pdf. – fish make up an average of 50 percent of the annual animal protein intake for Sri Lankans, three times the global average,15“Towards Improved Livelihoods and Higher Revenues From Sustainable Fisheries in Sri Lanka,” World Bank, March 2, 2022, https://www.worldbank.org/en/news/feature/2022/03/02/towards-improved-livelihoods-higher-revenues-from-sustainable-fisheries-srilanka. and the fisheries sector directly and indirectly employs 2.7 million people. 16Fazeeha Azmi Ibrahim, “Between the Sea and the Land: Small-Scale Fishers and Multiple Vulnerabilities in Sri Lanka,” Sri Lanka Journal of Social Sciences, June 30, 2020, https://doi.org/10.4038/sljss.v43i1.7641. Coastal fisheries accounted for 51 percent of total fish production in Sri Lanka between 2014 and 2017.17Ibrahim. However, a rapid expansion of the coastal fishing industry has driven declines in coastal fish stocks, exacerbated by habitat destruction and pollution.18“Priorities for Sustainably Managing Sri Lanka’s Marine Fisheries, Coastal Aquaculture, and the Ecosystems That Support Them.” The experts surveyed as part of this rapid assessment all agreed that the status of nearshore fish stocks has declined over the past ten years and that they expect further decline over the next ten. Coastal fisheries are also likely to be further impacted by the destruction of Sri Lanka’s mangrove forests, which provide critical feeding and rearing habitat for many coastal marine species, as well as seagrass beds.19A. K. H. Priyashantha and T. Taufikurahman, “Mangroves of Sri Lanka: Distribution, Status and Conservation Requirements,” Tropical Plant Research, 2020, https://doi.org/10.22271/TPR.2020.V7.I3.083. Approximately one-quarter of the country’s mangrove habitats are estimated to have been destroyed between 1980 and 2005, primarily due to conversion to aquaculture, agriculture, or urban land.20“Mangroves – IUCN,” IUCN Sri Lanka, https://iucnsrilanka.org/conservation-sri-lanka/coastal-and-marine-ecosystems/mangroves/. Fringing mangroves around estuaries and lagoons are mostly what remain, particularly outside the northwest.21“Mangroves – IUCN.” A 2020 study found that the Western Province has only around seven square kilometers of remaining mangroves. Note: Priyashantha and Taufikurahman.
Offshore fishing of tuna and billfish in Sri Lanka’s exclusive economic zone contribute 45 percent of the fishery sector export revenue,22“Priorities for Sustainably Managing Sri Lanka’s Marine Fisheries, Coastal Aquaculture, and the Ecosystems That Support Them.” though fishery exports accounted for only around two percent of total exports in 2020.23“Sri Lanka (LKA) Exports, Imports, and Trade Partners | OEC,” OEC – The Observatory of Economic Complexity, accessed May 17, 2022, https://oec.world/en/profile/country/lka?compareEciSelector=compareBy1&depthSelector1=HS4Depth&scaleSelector1=eciScale0. Regionally, yellowfin tuna stocks are overfished, which does not allow for increases in harvest.24“Priorities for Sustainably Managing Sri Lanka’s Marine Fisheries, Coastal Aquaculture, and the Ecosystems That Support Them.” However, there is an opportunity to increase exports and income from foreign countries without increasing the quantity of fish harvested. Currently, Sri Lanka is only able to export 16 percent of its tuna catch.25Ibid. This figure could be increased by improving quality-control standards and the infrastructure of the country’s fishing fleet.26Ibid. However, concerns expressed by surveyed experts about the capacity of Sri Lanka’s fishery enforcement institutions suggest that efforts to implement these or other regulations to improve the sustainability of the country’s fisheries may face enforcement challenges. Rising sea surface temperatures may pose additional challenges as increasing water temperatures have been shown to drive relocation of some fish species. Further study is needed to determine the degree to which this will affect Sri Lanka specifically.27“IPCC Sixth Assessment Report, Working Group 2: Chapter 3,” IPCC, October 1, 2021, https://www.ipcc.ch/report/ar6/wg2/downloads/report/IPCC_AR6_WGII_FinalDraft_Chapter03.pdf
Over 80 percent of experts surveyed as part of this rapid assessment believe that incidents of high invasive species abundance have increased over the past ten years, and over 70 percent expect them to continue increasing over the next ten. The available research echoes this concern; a 2021 study found that donkey grass [Panicum trichocladum] – identified as a potential invasive in 2016 – has increased its population density and distribution in Sri Lanka in the preceding 2-3 years.28Buddhi Marambe and Siril Wijesundara, “Effects of Climate Change on Weeds and Invasive Alien Plants in Sri Lankan Agro-Ecosystems: Policy and Management Implications,” Frontiers in Agronomy, June 15, 2021, https://www.frontiersin.org/articles/10.3389/fagro.2021.641006/full. Another study published the same year found that the majority of Sri Lanka’s aquatic habitats are vulnerable to the invasion of two of the world’s worst aquatic invasive alien plant species, water hyacinth and Salvinia,29The two species scientific names are Eichhornia crassipes and salvinia molesta, respectively. which can undermine biodiversity and agricultural production. 30C. Kariyawasam, L. Kumar, and S. Ratnayake, “Potential Distribution of Aquatic Invasive Alien Plants, Eichhornia Crassipes and Salvinia Molesta under Climate Change in Sri Lanka,” Wetlands Ecology and Management, April 21, 2021, https://doi.org/10.1007/S11273-021-09799-4. The increases in temperature and rainfall projected to occur in Sri Lanka are likely to increase the costs of managing invasive species in both marine and terrestrial settings; a 2014 study found that weed control costs in agricultural lands in several districts in Sri Lanka were nearly doubled during the years that experienced El Niño Southern Oscillation.31H.G.A.S. Sathischandra, B. Marambe, and R. Punyawardena, “Seasonal Changes in Temperature and Rainfall and Its Relationship with the Incidence of Weeds and Insect Pests in Rice (Oryza Sativa L) Cultivation in Sri Lanka,” Climate Change and Environmental Sustainability, November 24, 2014, https://doi.org/10.5958/2320-642X.2014.00002.7. Experts noted that non-native ornamental fish and plants are both accidentally and deliberately introduced into the waters of the Western Province and that saltwater species are increasingly present inland due to saltwater intrusion. Experts also called for greater study, noting the lack of baseline measurements of species already present and the lack of study around marine species that may be present in ballast water. Sri Lanka is not a signatory to the Ballast Water Management Convention, a 2004 international treaty that requires signatories to ensure that ships flagged by them comply with standards and procedures for the management and control of ships’ ballast water and sediments.
There was also almost universal agreement among the experts surveyed for this rapid assessment that the occurrence of harmful algal blooms (HABs) have increased in the past ten years and will continue to increase in the next ten. While studies on harmful algae are rare in the waters around Sri Lanka, Note: 32D. Dissanayake, D. Wickramasinghe, and P. Manage, “Harmful Diatoms and Dinoflagellates in the Indian Ocean: A Study from Southern Coast of Sri Lanka,” Ukrainian Journal of Ecology, 2021, https://www.ujecology.com/abstract/harmful-diatoms-and-dinoflagellates-in-the-indian-ocean-a-study-from-southern-coast-of-sri-lanka-63566.html. harmful algae species have been found both off Sri Lanka’s southern coast, Note: Dissanayake, Wickramasinghe, and Manage. as well as in water supplies in the inland city of Kandy.33S. K. Yatigammana, O.A. Ileperuma, and M.B.U. Perera, “Water Pollution Due to a Harmful Algal Bloom: A Preliminary Study from Two Drinking Water Reservoirs in Kandy, Sri Lanka,” Journal of the National Science Foundation of Sri Lanka, March 23, 2011, https://doi.org/10.4038/jnsfsr.v39i1.2930. While neither is within the study area for this rapid assessment, they suggest the need for further evaluation. Experts also noted that dead zones are increasing in the Indian Ocean and that runoff contaminated with agricultural fertilizers and untreated sewage, especially during flooding events, have triggered HABs, though a campaign to reduce pollution in waterways in the Western Province catchment may help alleviate this concern.
Coastal erosion in Sri Lanka has long been a pressing problem and helped initiate the country’s first Coastal Zone Management Plan in 1990.34“Coastal Zone Management in Sri Lanka – IUCN,” IUCN Sri Lanka, https://iucnsrilanka.org/conservation-sri-lanka/coastal-zone-management-in-sri-lanka/. Despite that plan and the revisions made to it in 1997, 2004, and 2018, coastal erosion in Sri Lanka continues, driven both by storm surge and human activity, including river sand mining, the removal of coastal vegetation, and beach sand mining.35“Coastal Zone Management in Sri Lanka – IUCN.” A study published in 2017 found that while isolated locations on the northeastern and eastern coastlines showed considerable erosion, no “severe long term erosion conditions prevail in the western, southwestern, and northwestern coasts”, with accretion during northeastern monsoon conditions balancing erosion during stormy southwestern monsoon conditions.36E. N. Lakmali et al., “Long Term Coastal Erosion and Shoreline Positions of Sri Lanka,” Survey in Fisheries Sciences, February 10, 2017, https://doi.org/10.18331/SFS2017.3.2.1. Some experts have noted that coastal erosion has frequently been associated with certain kinds of coastal infrastructure, for example the rail line close to the shore near Galkissa Beach.
Sri Lanka has undertaken several initiatives to reduce the risk of flooding in the Western Province and to help the post-flooding recovery process, especially for the most vulnerable. Supported by the World Bank, the Metro Colombo Urban Development Project (MCUDP) has worked to mitigate flood risk through both artificial and natural infrastructure.
A key part of the MCUDP was the preservation and restoration of the city’s wetlands, which play a vital role in reducing flood risk, but which had been progressively degraded for decades.37“Can Nature-Based Solutions Be an Answer to the Climate Crisis?” This work built on the 2012 Metro Colombo Urban Wetland Management Strategy, initiated by the Sri Lankan government, to assess flood risk and examine the potential benefits offered by wetlands.38Ibid. The wetlands also clean Colombo’s water and provide food and supplemental income. In 2018, the city was declared the first world capital to be accredited as an International Wetland City by the Ramsar Convention on Wetlands.39Ibid.
Alongside flood mitigation efforts, Sri Lanka’s National Insurance Trust Fund operates a national disaster relief program, the National Natural Disaster Insurance Scheme (NNDIS). The NNDIS helps low-income homeowners and microenterprises, of the sort that are especially common in the informal economy, to recover from natural disasters such as flooding.40“Flooding in Sri Lanka 2018.” The NNDIS focuses on supporting those living in informal settlements, which were among the worst affected in the 2016 and 2017 flooding.41Ibid.
Financial Risk
Financial risks in the Western Province are concentrated in the Economics category, which contains the three highest-risk indicators in the rapid assessment. The indicators in the Major Industries category are also elevated. This reflects both long-term and acute economic challenges that Sri Lanka has faced, including its reliance on a small number of select industries.
- In the ECONOMICS category Debt Ratio (% of GDP) (9.17), Market Losses from Extreme Weather Events (8.20), and Level of Informal Economy (7.72) are all rated as high risk. The vulnerabilities associated with Sri Lanka’s Debt Ratio have come to the forefront in the country’s ongoing (at time of writing) economic crisis.
- In the INFRASTRUCTURE category, Level of Informal or Unplanned Settlement (6.47) is rated as medium-high risk, reflecting the challenges with accommodating the rapid urbanization in the Western Province in recent years. Percent of Low-Income Housing in Relation to Flood Zones (4.87) and Percent of People Living Below 5 Meters Above Sea Level (4.27) are both rated as medium risk.
- All three of the selected indicators in the MAJOR INDUSTRIES category are rated as medium-high risk, reflecting the large share of the national economy based in Ports and Shipping (6.71), Tourism (6.63), and Agriculture (6.16).
Of the 30 indicators included in this rapid assessment, the surveys of experts, which were conducted between January 27 and April 13, 2022, identified Sri Lanka’s debt ratio as the highest risk. On April 12, Sri Lanka announced that it would suspend payments on its foreign debt – the first time it has done so since its independence in 194842Krishan Francis, “Sri Lanka Halts Debt Repayment Pending IMF Bailout Plan,” AP News, April 12, 2022, https://apnews.com/article/business-international-monetary-fund-sri-lanka-foreign-debt-f48b3cfb388c3a11af5d2d8a3d1a4391. – to save its shrinking reserves of dollars to pay for fuel and food imports.43Gerry Shih, “How war in Ukraine turned Sri Lanka’s economic crisis into a calamity”, The Washington Post, April 17, 2022, https://www.washingtonpost.com/world/2022/04/17/sri-lanka-crisis-default-ukraine/. As the country faces the worst economic situation in its history, Sri Lanka’s debt is no the sole cause, there are several contributing factors which added to the economic downturn. These drivers include a precipitous drop in tourism following the Easter Sunday attacks and during the COVID-19 pandemic, government policies, and soaring global prices of staples like food and fuel due to the war in Ukraine.44Gerry Shih.
Sri Lanka is likely to continue to face high debt servicing costs even after the resolution of the current economic problems, which will reduce the public funds available to finance climate resilience measures.45Travis Mitchell, “Debt Swaps for Climate Change Adaptation and Mitigation,” The Commonwealth Secretariat, February 23, 2015, https://doi.org/10.14217/5JS4T74262F7-EN. In addition, a 2018 study showed that climate vulnerability has already been found to increase the costs of debt, accounting for controls such as per capita income, government revenue and expenditure, inflation, and foreign direct investment.46Gerhard Kling et al., “Climate Vulnerability and the Cost of Debt,” SSRN Scholarly Paper, June 27, 2018, https://doi.org/10.2139/ssrn.3198093. The study showed that the costs of interest on debt was ten percent higher over the past 10 years for the members of the Vulnerable Twenty Group, an organization of 55 countries, including Sri Lanka, dedicated to strengthen economic and financial responses to climate change.47Ibid. The study also found that investments in social readiness partially offsets the increased debt costs due to climate vulnerability.48Ibid.
Extreme weather events also impose costs on the government’s budget. A report released by the Ministry of Finance and the World Bank found that between 1998 and 2012, extreme weather events caused $380 million in losses, equivalent to three percent of government expenditures. Note: 49Chandana S. A. Siriwardana, G. P. Jayasiri, and S. S. L. Hettiarachchi, “Investigation of Efficiency and Effectiveness of the Existing Disaster Management Frameworks in Sri Lanka,” Procedia Engineering, January 1, 2018, https://doi.org/10.1016/j.proeng.2018.01.141. Floods were the greatest contributor, accounting for almost two-thirds of those losses, with cyclones accounting for another 22 percent.50Siriwardana, Jayasiri, and Hettiarachchi. In 2017, Sri Lanka was the second most-affected country by climate impacts, with losses totaling over $3 billion. 51David Eckstein and Marie-Lena Hutfils and Maik Winges, “Global Climate Risk Index 2019,” Germanwatch,” November 27, 2018, https://www.germanwatch.org/en/16046. By 2050, the World Bank projects this to reach “a 1.2 percent annual GDP loss due to climate change”,52“Sri Lanka, World Bank Sign Agreement to Strengthen Climate Resilience,” World Bank, September 20, 2021, https://www.worldbank.org/en/news/press-release/2021/09/20/sri-lanka-world-bank-sign-agreement-to-strengthen-climate-climate-resilience. equivalent to nearly $1 billion, with historical patterns of high variance in climate impacts suggesting that some years losses will reach much higher.53Gunaratne, Radin Firdaus, and Rathnasooriya.
The informal economy scored as the third highest-risk indicator in this rapid assessment. The informal economy has remained persistently high in Sri Lanka, with its share of national employment remaining at around 60 percent between 2006 and 2017.54“Informality, Job Quality, and Welfare in Sri Lanka,” World Bank, 2020, https://openknowledge.worldbank.org/bitstream/handle/10986/34399/Informality-Job-Quality-and-Welfare-in-Sri-Lanka.pdf?sequence=5&isAllowed=y. Informal employment is lowest in the Western Province, but it still makes up 56 percent of total employment.55Ibid. A 2020 report from the World Bank on the informal sector in Sri Lanka attributes the large size of the informal economy in the country to both the high costs and low benefits of formalizing employment. The high costs come in three principal forms. The first is the stringency of labor laws, which makes it difficult and expensive both to hire and to dismiss employees – Sri Lanka has the second highest costs in the world associated with terminating a redundant worker – inhibiting the ability of firms to adapt to changing market conditions. The second is the ambiguous and overlapping scope for many labor regulations, creating a complex operating environment in which compliance is difficult and costly, and can leave firms open to expensive litigation. The third is the high cost of labor regulations, with the report specifically citing the generous requirements around paid leave and overtime pay as well as the cost of using the Employees’ Trust Fund in the absence of public social protection programs. The report also finds that formalization offers limited benefits to employers, particularly noting that formalization does not appear to increase access to credit.56Ibid.
The Percent of National Economy Based in Port and Shipping Industries indicator scored medium-high risk. The port of Colombo is a major transshipment hub, driven by Sri Lanka’s strategic location along the busiest trade routes between East Asia, South Asia, the Middle East, and Europe. In 2021, Colombo Port became the 22nd largest port in the world by volume, and President Gotabaya Rajapaksa has expressed a desire for the port to become one of the world’s 15 largest by 2025.57“Colombo Port Continues Growth in 2021 TEU Levels,” Global Trade Magazine, April 7, 2022, https://www.globaltrademag.com/colombo-port-continues-growth-in-2021-teu-levels/. The Port is currently Sri Lanka’s only container port,58Chathumi Ayanthi Kavirathna et al., “Port Development and Competition between the Colombo and Hambantota Ports in Sri Lanka,” Case Studies on Transport Policy, March 2021, https://doi.org/10.1016/j.cstp.2020.12.003. and is one of only 24 ports in the world with the capacity to handle the largest class of cargo vessels currently in operation.59“World’s Largest Container Vessel Calls on Sri Lanka’s Colombo Port,” XinhuaNet, October 7, 2021, https://www.news.cn/english/2021-10/07/c_1310230047.htm. It plays an especially large role in transshipment of trade to and from India and Bangladesh. Over 70 percent of transshipment at the Port is linked to India,60Meera Srinivasan, “Explained: The Adani Group’s Recent Port Deal in Sri Lanka,” The Hindu, October 4, 2021, https://www.thehindu.com/news/national/explained-the-adani-groups-recent-port-deal-in-sri-lanka/article36825539.ece. and the Port handles 40 percent of Bangladesh’s exports and 30 percent of its imports.61Shahadat Hossain Chowdhury and Jasim Uddin, “Colombo Port Congestion Comes as Fresh Supply Chain Woe,” The Business Standard, March 31, 2022, https://www.tbsnews.net/economy/colombo-port-congestion-comes-fresh-supply-chain-woe-394238. The shipping industry presents risks to the marine ecosystems off the coast of the Western Province, exemplified by the sinking of the X-Press Pearl off the coast of Colombo in June 2021, releasing nitric acid, oil, and plastic pellets known as nurdles, among other pollutants.62“Oil, Acid, Plastic: Inside the Shipping Disaster Gripping Sri Lanka,” UNEP, January 12, 2022, https://www.unep.org/news-and-stories/story/oil-acid-plastic-inside-shipping-disaster-gripping-sri-lanka. This likely contributed to unusually high fatalities among marine life in June 2021 and will have longer term effects.63Ibid. X-Press Feeders, the ship’s owners, expect salvage operations to continue through April 2023.64“Home | X-Press Pearl – Incident Information Centre” X-Press Pearl Incident Information Centre, May 13, 2022, https://www.x-presspearl-informationcentre.com.
The Sri Lanka Ports Authority (SPLA) has expressed concern about increasing capacity constraints and congestion at Colombo Port and has therefore decided to develop Colombo primarily for container handling, shifting bulk cargo to other ports, including Hambantota. Hambantota Port, located in the Southern Province, will be Sri Lanka’s second container port. Controversy has surrounded its development, particularly after a 70 percent stake in the port was leased to China Merchants Port Holdings Company for 99 years for $1.12 billion.65Umesh Moramudali, “The Hambantota Port Deal: Myths and Realities,” The Diplomat, January 1, 2020, https://thediplomat.com/2020/01/the-hambantota-port-deal-myths-and-realities/. The Sri Lankan government used the payment to increase foreign reserves and pay short-term debt.66Ibid.
Tourism has grown rapidly in Sri Lanka in recent years, becoming one of its most important industries, this is reflected in the medium-high risk score for the Percent of National Economy Based in Tourism Industry indicator. As recently as 2009, Sri Lanka earned just $0.76 billion from international tourism. By 2018, that figure had increased to $5.61 billion, almost 7.5 times higher.67“International Tourism, Receipts (Current US$),” The World Bank, accessed May 19, 2022, https://data.worldbank.org/indicator/ST.INT.RCPT.CD?locations=LK. This growth made tourism into Sri Lanka’s third-largest export earner.68Lasika Madhawa Munasinghe, W. H. T. Gunawardhana, and R. G. Ariyawansa, “Sri Lankan Travel and Tourism Industry: Recent Trends and Future Outlook towards Real Estate Development,” SSRN Scholarly Paper, June 25, 2020, https://doi.org/10.2139/ssrn.3614984. In 2019, a series of suicide bombings hit a group of churches and luxury hotels in Colombo on Easter Sunday. The resulting drop in tourist arrivals caused receipts to fall by 17 percent in 2019. Receipts fell further in 2020, to $1.08 billion, due to the impacts of COVID-19 and associated restrictions on international visitors. The government removed all quarantine requirements in November 2021, and there were signs of a recovery in tourist arrivals at the beginning of 2022 before the onset of the economic crisis.69Sunil Kataria, “Sri Lanka’s Economic Crisis Dashes Hopes for Post COVID-19 Tourism Recovery,” Reuters, April 22, 2022, https://www.reuters.com/world/asia-pacific/sri-lankas-economic-crisis-dashes-hopes-post-covid-19-tourism-recovery-2022-04-22/.
Informal and unplanned settlements have long been a part of the Western Province. Sri Lanka’s Development Policy Framework from several years ago included a goal of “no more shanty dwellers” by 2020.70“Colombo City – Livelihood Assessment of Flood-Prone Low-Income Settlements,” UN-HABITAT, CEPA, and Savantha, June 2013, https://pubdocs.worldbank.org/en/482241460466145516/Output-Colombo-City-Livelihood-Assessment-of-Flood-Prone-Low-Income-Settlements.pdf The medium-high risk score based on expert surveys suggests that that objective has not been achieved. There is limited information on the number of informal or unplanned settlements in the Western Province, though one survey from 2001 identified 77,612 families living in 1,614 low-income settlements in Colombo.71“Urban Slums Report: The case of Colombo, Sri Lanka,” Savantha, 2003, https://www.ucl.ac.uk/dpu-projects/Global_Report/pdfs/Columbo.pdf One unique characteristic of those settlements that the survey identified was their small size, with 74 percent containing fewer than 50 housing units.72Ibid. Another study found that 40 percent of the country’s population living in poverty live in informal settlements on the urban outskirts of greater Colombo.73“Disaster Risk Reduction in Sri Lanka: Status Report 2019,” UNDRR and Asian Disaster Preparedness Center, 2019, https://www.unisdr.org/files/68230_10srilankadrmstatusreport.pdf Residents are often more vulnerable to flooding as many of these settlements are built on floodplains.74Ibid. The Sri Lankan government has recognized the climate risks to its major industries and urban settlements, incorporating both as key parts of its adaptation strategy in the updated nationally determined contributions to the Paris Agreement (NDC). The agriculture sector, fisheries sector, coastal and marine sector, urban planning and human settlement sector, and tourism and recreation sector are all identified as priority sectors for Sri Lanka’s Adaptation NDCs.75“Sri Lanka: Updated Nationally Determined Contributions,” Sri Lanka Ministry of Environment, July 2021, https://unfccc.int/sites/default/files/NDC/2022-06/Amendmend%20to%20the%20Updated%20Nationally%20Determined%20Contributions%20of%20Sri%20Lanka.pdf Sri Lanka has also worked with international partners to help address climate risks, particularly the United Nations Development Programme and the World Bank. These partnerships have focused on promoting a green economic recovery from the COVID-19 pandemic and on flood-risk mitigation,76Jeevethan Selvachandran, “Preparing for the Impact of Climate Change in Sri Lanka,” Policy Forum, October 30, 2021, https://www.policyforum.net/preparing-for-the-impact-of-climate-change-in-sri-lanka/. including a $92 million financing agreement with the World Bank signed in September 2021 to modernize weather, flood, and landslide forecasting and early warning systems.77“Sri Lanka, World Bank Sign Agreement to Strengthen Climate Resilience.” To improve the climate resilience of the Western Province specifically, the World Bank and the government of Sri Lanka jointly financed the Metro Colombo Urban Development Project (MCUDP).78“Metro Colombo Urban Development Project,” Ministry of Urban Development and Housing, accessed May 24, 2022, https://www.mcudp.lk. The MCUDP aims to reduce the impacts of flooding in the Colombo metropolitan area and improve priority local infrastructure and services, particularly ground transportation and drainage infrastructure79.“Development Projects: Metro Colombo Urban Development Project,” World Bank, accessed May 24, 2022, https://projects.worldbank.org/en/projects-operations/project-detail/P122735.
Political Risk
- The GOVERNANCE category reflects vulnerabilities around the public response to the threats posed by climate change and extreme weather events. Investment in Climate Resiliency Development Projects (6.47) and National Adaptation Plan (5.22) are both rated as medium-high risk while Capacity for Current Disaster Response (4.40) is rated as medium risk.
- The medium-high risk indicators in the SOCIAL AND DEMOGRAPHICS category reflect the vulnerabilities associated with changing population patterns, including those from the Western Province’s Urbanization Rate (7.15) and Urban Population Density (6.80) along with those due to the aging reflected in Dependency Ratio (6.45).
- The STABILITY category includes both the medium-high risks stemming from the Number of Incidences of Civil Unrest or Instability (7.03) and the medium-high risks associated with the high employment in both the Tourism Industry (6.78) and the Port and Shipping Industries (5.40).
The indicators around urbanization, Urbanization Rate and Urban Population Density, scores as two of the three highest risk indicators in Political Risk, driven by the rapid growth in Sri Lanka’s urban population over the past decade. As a share of the total population, the urban population fell slowly for 30 years beginning in the early 1980s.80“Urban Population (% of Total Population),” The World Bank, accessed May 23, 2022, https://data.worldbank.org/indicator/SP.URB.TOTL.IN.ZS?locations=LK. The end of the civil war in 2009 expanded opportunities for population movement, reversing this trend and driving rapid urbanization.81Weeraratne, Bilesha, “Transitioning to Middle Income and Beyond: The Urbanization Challenge in Post-Conflict Sri Lanka,” Managing Domestic and International Challenges and Opportunities in Post-conflict Development, June 1, 2019, https://doi.org/10.1007/978-981-13-1864-1_14 The country remains, however, much less urbanized than the regional average. Less than 20 percent of Sri Lanka’s population is urban, compared to an average of 35 percent for South Asia.82“Urban Population (% of Total Population)” The Western Province is the country’s most urbanized province, with nearly 40 percent of its population living in urban areas according to the 2012 census.83“Census of Population and Housing: Sri Lanka 2012,” Sri Lanka Department of Census and Statistics, accessed May 23, 2022. https://www.statistics.gov.lk/pophousat/cph2011/pages/activities/Reports/SriLanka.pdf This increase in the urban population has in many cases outstripped improvements to urban infrastructure. One example of this is urban road infrastructure. The number of vehicles in the Western Province increased 57 percent between 2009 and 2014 and as of 2018, the Western Province was home to over one-third of total vehicles in Sri Lanka.84“Transitioning to Middle Income and Beyond: The Urbanization Challenge in Post-Conflict Sri Lanka.” Congestion has consequently increased, constraining the efficiency of businesses in the province, most notably Colombo Port.
The Dependency Ratio also scored as a medium-high risk since as Sri Lanka’s population urbanizes, it is also aging. Already, 12.3 percent of its population is aged 60 years or older, the highest rate in the region.85René Leon Solano, “Sri Lanka Must Increase Its Efforts to Protect and Promote the Human Capital of the Elderly,” World Bank, October 1, 2021, https://blogs.worldbank.org/endpovertyinsouthasia/sri-lanka-must-increase-its-efforts-protect-and-promote-human-capital-elderly. In just a decade and a half, over one quarter of the country’s population is projected to be over 60 years old. Note: Ibid. Sri Lanka’s total population will peak even sooner, increasing until 2026 and falling thereafter.86Utsav Kumar, “Charting Sri Lanka’s Aging Population,” Asian Development Bank Blog, February 20, 2020, https://blogs.adb.org/blog/charting-sri-lankas-aging-population. An aging population is going to have three major effects that may increase the vulnerabilities of the Western Province to climate risk. First, an aging population is one that is more vulnerable to extreme weather events. For example, elderly people face greater challenges evacuating from flooding and are more susceptible to the effects of extreme heat. Second, an aging population will put additional pressure on the country’s healthcare system,87René Leon Solano. which may also face challenges from infectious diseases due to climate change. Third, a higher share of retired workers will increase the financial burdens on the country’s pension scheme,88Ibid. reducing the resources available for strengthening climate resilience.
Number of Incidences of Civil Unrest or Instability scored as the second-highest risk indicator in Political Risk, reflecting that the Western Province, and especially Colombo, has often been a central location for civil unrest and instability in Sri Lanka. Most recently, Colombo has been the site of large protests during the ongoing economic crisis, including violent clashes between government supporters and opposition protesters. By early May, the unrest had left hundreds injured, several dead, over a hundred buildings set alight,89Hannah Ellis-Petersen, “Sri Lanka Unrest: Shoot on Sight Order Issued as Troops Deployed in Colombo,” The Guardian, May 11, 2022, https://www.theguardian.com/world/2022/may/11/sri-lanka-unrest-shoot-on-sight-order-issued-troops-deployed-colombo. and at least 1,500 people arrested.90“Sri Lanka Unrest: 1,500 People Arrested in Connection with May 9 Violence,” Zee News, May 23, 2022, https://zeenews.india.com/world/sri-lanka-unrest-1500-people-arrested-in-connection-with-may-9-violence-2466363.html. In 2018, Colombo was also the center of protests and riots in the wake of President Sirisena’s decision to replace Prime Minister Wickremesinghe with Mahinda Rajapaksa.91“Democratic Disorder in Sri Lanka,” ACLED, November 19, 2018, https://acleddata.com/2018/11/19/democratic-disorder-in-sri-lanka/. Other spikes in protest activity occurred at the end of 2015 and beginning of 2012. This kind of repeated instability can have two major effects related to climate risk. First, climate change can act as a threat multiplier, exacerbating existing grievances and civil unrest, particularly when government legitimacy is low. Second, unrest can inhibit the response to both long-term and acute climate risks, for example by absorbing attention and constraining consistent planning.
As detailed in the previous section, the tourism, port, and agriculture industries play major roles in the Sri Lankan economy, and the percent of people employed in the tourism and ports and shipping industries both scored as medium-high risks. The Western Province is in many respects a national outlier. It is the most urbanized, has the highest population density, and wealthiest province.92“Sri Lanka Socioeconomic Data 2020,” Central Bank of Sri Lanka, accessed May 23, 2022. https://www.cbsl.gov.lk/sites/default/files/cbslweb_documents/publications/otherpub/publication_sri_lanka_socio_economic_data_folder_2020_e.pdf Nonetheless, it shares many of the same vulnerabilities as the nation as a whole. Sixty percent of its population is rural, and agriculture remains an important part of the provincial economy.93“Census of Population and Housing: Sri Lanka 2012.” Greater Colombo is one of the country’s seven major tourism zones,94Kumudika K. E. Perera, “An Analysis of Recent Trends in Tourist Arrivals in Sri Lanka,” Athens Journal of Tourism, February 2017, https://www.athensjournals.gr/tourism/2017-4-1-4-Perera.pdf and Colombo Port handles 90 percent of the country’s seaborne cargo.95Pavithra Jayasinghe, Venkatesh Raghavan & Go Yonezawa, “Exploration of expansion patterns and prediction of urban growth for Colombo City, Sri Lanka,” Spatial Information Research, January 9, 2021, https://doi.org/10.1007/s41324-020-00364-4 Both agriculture and tourism are vulnerable to climate impacts, including flooding, extreme heat, and changes to rainfall patterns.
Although the Sri Lankan government has developed a series of climate change adaptation plans, including specifically for the Western Province, the risk scores calculated from surveys of experts found a medium-high level of risk for National Climate Adaptation Plan, with experts attributing this to concerns around the capacity for implementing adaptation plans, a lack of clarity around the planning process outside of government, and the need for better linkages between government and other stakeholders, especially in beyond the planning stages. The government of Sri Lanka has received funding from the Green Climate Fund to prepare climate adaptation plans for all nine provinces, including the Western Province, and work is scheduled to commence in the near future, making addressing these challenges a priority. The risk score for Investment in Climate Resiliency Development Projects is elevated, and experts noted that process challenges results in underfunding to these types of projects. Experts also noted that climate vulnerability and risk is not currently a part of environmental impact assessments, but that could be an area to better integrate climate risk into existing planning and implementation processes.
High-Level Recommendations to Build Resilience
The central piece of Sri Lanka’s climate change adaptation strategy is the National Adaptation Plan for Climate Change Impacts in Sri Lanka, 2016-2025, which builds on previous comprehensive and sectoral planning documents. The Plan also serves as Sri Lanka’s National Adaptation Plan (NAP). It includes priority actions for 10 key sectors, several of which overlap with the vulnerabilities identified in this assessment, including:
- Coastal and Marine Sector
- Human Settlements and Infrastructure
- Ecosystems and Biodiversity
- Tourism and Recreation
- Cross-Cutting Adaptation Needs
Sri Lanka has worked with international partners, including the Green Climate Fund, to implement the Plan in a way that recognizes the interconnected nature of climate risks and adopts integrated solutions and adaptation measures. 96“Strengthen the Process and Capacity of Implementation of National Adaptation Plan of Sri Lanka,” Green Climate Fund, August 12, 2020, https://www.greenclimate.fund/document/strengthen-process-and-capacity-implementation-national-adaptation-plan-sri-lanka.
The government of the Western Province also developed a climate change adaptation action plan, which outlined four major areas of adaptation for the period 2015-2018:
- Mainstreaming climate change risk in the Western Province planning process
- Improving climate resilience, the health of communities, and the built environment
- Reducing the impacts of climate change on food security
- Reducing the impacts of climate change on natural resources and biodiversity
Updating the Western Province adaptation plan and effectively implementing the NAP will depend on detailed, locally specific information which CORVI can help deliver to decision makers. The rapid CORVI and full CORVI assessments are developed to provide an understanding of the environmental, economic, and social dimensions of climate risks in the Western Province. This rapid assessment provides a set of high-level recommendations for the government and people of the Western Province and a full CORVI assessment would provide more specific, and targeted recommendations.
Invest in climate-smart infrastructure and community-based adaptation in vulnerable neighborhoods
Rapid urbanization in the Western Province has driven growth in informal and unplanned settlements. These settlements often suffer from inadequate drainage, sanitation, and waste management, and were among the worst affected during the flooding that hit Colombo in 2016 and 2017. The National Natural Disaster Insurance Scheme (NNDIS) has worked to support the recovery of those living in informal settlements from flooding and the Metro Colombo Urban Development Project has worked to reduce flood risk in Colombo, but it is essential to further mitigate these risks.
Other cities facing similar risks have reduced the impact of flooding by improving drainage systems and removing debris and waste from them, replacing concrete and paved surfaces with permeable surfaces, restricting new development on wetlands and floodplains, and creating spaces that can retain rainwater.97“How to Reduce Flood Risk in Your City,” C40 Knowledge Hub, November 2021, https://www.c40knowledgehub.org/s/article/How-to-reduce-flood-risk-in-your-city?language=en_US. This may include transforming informal dump sites, which Chennai did as part of a project to restore 210 waterbodies in the city to reduce flood risk.98“Cities100: Chennai Is Restoring Waterbodies to Protect against Flooding and Drought,” C40 Knowledge Hub, October 2019, https://www.c40knowledgehub.org/s/article/Cities100-Chennai-is-restoring-waterbodies-to-protect-against-flooding-and-drought?language=en_US. Bringing community-based organizations into the decision-making process can help design and implement effective flood reduction measures in informal settlements, as shown by the success in Cape Town.99Ashley Fox, Gina Ziervogel, and Suraya Scheba, “Strengthening Community-Based Adaptation for Urban Transformation: Managing Flood Risk in Informal Settlements in Cape Town,” Local Environment, May 24, 2021, https://doi.org/10.1080/13549839.2021.1923000. Multi-sectoral partnerships between government, the private sector, and civil society to share knowledge, expertise, and resources have been successful in Durban.100David Samuel Williams et al., “Informal Settlements and Flooding: Identifying Strengths and Weaknesses in Local Governance for Water Management,” Water, June 29, 2018, https://doi.org/10.3390/w10070871. Community-based local disaster risk management committees, staffed by volunteers and supported by the government, reduced the damage caused by flooding in Mozambique.101“Mozambique Disaster Risk Management and Resilience Program: Technical Assessment Report,” The World Bank, February 20, 2019, https://documents1.worldbank.org/curated/en/168731551137716732/pdf/Final-Technical-Assessment-Mozambique-Disaster-Risk-Management-and-Resilience-Program-P166437.pdf
Build resilience in marine and coastal ecosystems
The Western Province of Sri Lanka is home to diverse marine and coastal ecosystems, especially mangroves, wetlands, and coral reefs, which provide essential ecosystem services, including flood control, water purification, carbon sequestration, and erosion regulation.102“Coastal and Marine Ecosystems – IUCN,” IUCN Sri Lanka, accessed May 24, 2022, https://iucnsrilanka.org/conservation-sri-lanka/coastal-and-marine-ecosystems/. A World Bank study found that keeping Colombo safe from a major flood was impossible without preserving the city’s wetlands, even with the installation of drainage tunnels, pumping stations, and improved canal diversion.103“Can Nature-Based Solutions Be an Answer to the Climate Crisis?” These ecosystems have been damaged by both human activity and climate change. The principal cause of degradation for mangroves and wetlands has been habitat destruction for conversion to other uses. The main threats to coral reefs in Sri Lanka are coral mining, plastic and polythene waste pollution, along with rising sea temperatures and marine heat waves according to statements made in 2019 by the head of Sri Lanka’s Marine Environment Protection Authority.104Pallavi Pundir, “Ninety Percent of Sri Lanka’s Coral Reefs Are Dead,” Vice News, July 9, 2019, https://www.vice.com/en/article/3k3mwn/ninety-percent-of-sri-lankas-coral-reefs-are-dead.
The Metro Colombo Urban Development project (MCUDP) has already made important progress in preserving Colombo’s wetlands and in 2018 the city was the first capital to be accredited as an International Wetland City by the Ramsar Convention on Wetlands. The national, provincial, and local governments could build on this progress by working with the private sector and civil society on a multiprong approach. This approach could include better enforcement of existing regulations, such as the ban on coral mining, as well as new regulations, including limitations on building on wetlands and mangroves. It could also include a focus on reducing urban pollution through improved waste management, particularly in the province’s informal settlements. Given the size of its informal economy, Sri Lanka could consider learning from best practices in integrating informal and formal waste management practices to improve waste management and poverty alleviation while reducing the health impacts associated with informal waste management.105Hong Yang et al., “Waste Management, Informal Recycling, Environmental Pollution and Public Health,” Journal of Epidemiology & Community Health, 2017, https://doi.org/10.1136/jech-2016-208597. These efforts could be accompanied by enhanced monitoring of ecosystem health and greater outreach and public education on the importance of these ecosystems and the risks they face.
Another strategy for preserving marine ecosystems is debt-for-nature swaps, which offer the opportunity to improve ecosystem resilience and address the country’s debt ratio. Debt-for-nature swaps are deals that forgive portions of a country’s external debt in exchange for commitments to invest in biodiversity conservation and environmental policy measures. In 2015, the first debt-for-nature swap for ocean conservation was completed in the Seychelles. The Nature Conservancy bought almost $22 million of the country’s debt in exchange for a promise to create 13 new marine protected areas.106Isabelle Gerretsen, “The Deal That Saved Seychelles’ Troubled Waters,” BBC News, August 3, 2020, https://www.bbc.com/future/article/20200803-the-deal-that-saved-seychelles-troubled-waters. In November 2021, the government of Belize signed a debt-for-nature swap with the Nature Conservancy, the US International Development Finance Corporation, and Credit Suisse that reduced it external debt by $553 million. The deal included a commitment to increase Biodiversity Protection Zones from the current 15.9 percent of Belize’s ocean area to 30% by 2026, among other promises.107Nicholas Owen, “Belize: Swapping Debt for Nature,” IMF, May 4, 2022, https://www.imf.org/en/News/Articles/2022/05/03/CF-Belize-swapping-debt-for-nature. Given the time required to complete such an agreement – it took several years to finalize Belize’s debt-for-nature swap – such an option must be considered a medium- to long-term solution.
Enhance the climate adaptability of key industries
The tourism, shipping, garment production, and agriculture industries comprise a major portion of the economy of Sri Lanka, and of the Western Province specifically. In 2021, Sri Lankan authorities identified the blue economy as key to the country’s sustainable development and Sri Lanka’s National Policy Framework, “Vistas of Prosperity and Splendour”, includes a focus on sustainable ocean resource management to promote a blue-green economy. As part of this focus, it is critical to both protect these key industries from the climate risks they face as well as to minimize their negative environmental impacts.
Tourism is a rapidly growing sector, and the national government has identified it as a key one of the most important for earning foreign exchange in Sri Lanka’s updated nationally determined contributions to the Paris Agreement (NDC). It is also vulnerable to climate impacts and is one of the 10 priority sectors in the National Adaptation Plan (NAP). During this period of growth and flux for the industry, it is critical that the public and private sectors work together to structure it in a way that minimizes climate risk and minimizes its negative environmental impact. This can include regulations around solid waste management and the clearing of marine ecosystems as well as efforts to increase awareness of climate and environmental risks among tourism industry stakeholders, establish emergency response plans, and monitor shorelines and marine ecosystems. It is important to harmonize efforts between local governments, the provincial government, national government bodies including the Sri Lanka Tourism Development Authority and the Ministry of the Environment, and the private sector to blend financial resources and ensure that adaptations in one area do not increase risk in another.
Shipping accidents remain a major source of environmental contamination, as demonstrated by the MT New Diamond, which caught fire off the coast of Sri Lanka in September 2020 and the sinking of the X-Press Pearl in June 2021. To address these risks, the government could work to enhance safety standards on vessels operating through Colombo Port and could strengthen the capacity of the Marine Environment Protection Agency, the Sri Lankan Ports Authority, and the Sri Lankan Navy to respond to these types of accidents. Sri Lanka could strengthen its collaboration with its neighbors and other countries with major shipping industries to share technical knowledge and provide mutual support in the event of future disasters.108Arachchige, Udara, et. al. “The Impact of Shipping on Marine Environment – A Study of Sri Lankan Water Ways,” International Journal of Scientific Engineering and Science, July 2021, https://www.researchgate.net/publication/353582453_The_Impact_of_Shipping_on_Marine_Environment_-A_Study_of_Sri_Lankan_Water_Ways Existing organizations like the World Association for Waterborne Transport Infrastructure (PIANC) are one option for undertaking this kind of knowledge sharing. Experts highlighted that formal information sharing mechanisms and improved capacity to respond to maritime chemical spills as priorities for improved collaboration.
Although the Western Province is the most urbanized province in the country, 60 percent of its population lives in rural areas and agriculture remains an important part of its economy. The sector faces climate risk from increasing temperatures, drought, flooding, and invasive species. Agriculture is a key focus area of both the NAP and updated NDC, which both outline several strategies for increasing the resilience of Sri Lankan agriculture, including promoting integrated pest management, introducing crop varieties resistant to climate stressors, improving water management practices, and enhancing early warning systems. 109“Sri Lanka: Updated Nationally Determined Contributions”. Strategies like agroforestry and integrated systems agriculture, which combine crops, livestock, and/or forestry in a single farm can provide additional adaptation benefits.110Miguel Calmon and Rafael Feltran-Barbieri, “4 Ways Farmers Can Adapt to Climate Change and Generate Income,” World Resources Institute, December 5, 2019, https://www.wri.org/insights/4-ways-farmers-can-adapt-climate-change-and-generate-income. Including community-based organizations in decision making can help improve uptake and monitoring of climate-smart agriculture practices. Urban planning could integrate the agricultural sector to improve consideration of risks to the agricultural sector from urban expansion. Innovative financing and insurance products, such as parametric insurance, can also be considered.
Gaps and Limitations
As the output of a pilot CORVI rapid assessment, this report was only able to focus on the 30 highest priority indicators, less than a third of those included in a full CORVI assessment. Workshop participants particularly highlighted the absence of indicators around cultural issues in the Western Province. Although a full CORVI assessment does not have any risk indicators specifically focused on cultural issues, the inclusion of expert interviews in a full assessment would provide greater opportunity for those issues to be raised and incorporated into the resulting city risk profile.
Appendix 1: Surveyed Organizations
Expert surveys were submitted by individuals from these organizations. 51 surveys were collected for the Western Province rapid assessment.
| Automated Barcode Solutions LTD | Hayleys Advantis |
| Blue Resources Trust | Institute of Policy Studies |
| Center for Environmental Justice | International Water Management Institute |
| Central Engineering Consultancy Bureau | Land Use Policy Planning Department |
| Department of Coast Conservation and Coastal Resource Management | Ministry of Tourism |
| Department of Forest | Munasinghe Institute for Development |
| Department of Wildlife Conservation | National Aquatic Resources Research and Development Agency |
| Environmental Foundation Limited | Royal Asiatic Society of Sri Lanka |
| Food and Agriculture Organization | SDB Bank |
| Foreign Ministry | Sri Lanka Navy |
| Green Movement | Wayamba University |
Appendix 2: The Climate and Ocean Risk Vulnerability Index
It is clear that urban coastal areas are likely to experience the earliest onset and potentially most severe impacts from climate change. The risks associated with climate change for specific coastal cities, however, are much more difficult to untangle. In order for coastal cities to efficiently allocate resources and enact effective adaptation strategies, it is critical that they understand their multidimensional climate risk. However, these efforts are impeded by poor and incomplete data.111Hunt, Alistair, and Paul Watkiss. “Climate change impacts and adaptation in cities: a review of the literature.” Climatic change 104, no. 1 (2011): 13-49. Data on climate risks is rarely available at the city level, and when it does exist, it is often poorly managed and stored in silos that make it difficult to access and use, even for city government officials.112Hardoy, Jorgelina, and Gustavo Pandiella. “Urban poverty and vulnerability to climate change in Latin America.” Environment and Urbanization 21, no. 1 (2009): 203-224. This issue is compounded by technical, financial, and capacity gaps, trapping coastal cities in a vicious cycle where they cannot develop holistic strategies to prioritize investment and access the funds needed to implement resilience actions.
Without data at the appropriate geographic scale, decision-makers are often left with the choice of either waiting for greater data availability, or attempting to downscale national level data, neither of which are ideal solutions for effective climate change adaptation. This problem is particularly acute in small and intermediate cities, which along with absorbing the bulk of East Africa’s future urban population growth, often lack the resources to gather and maintain necessary data.113“Demographic Trends and Urbanization,” World Bank, last modified May 19, 2021. Accessed August 16, 2021. https://www.worldbank.org/en/topic/urbandevelopment/publication/demographic-trends-and-urbanization.
Despite these challenges, decision makers need to act now in the face of uncertainty to build resilience to the climate crisis. To do this, they need tools that will enable them to consider multidimensional climate risks, develop cohesive strategies, and utilize this information to unlock additional climate finance and implement resilience actions.
In response, the Stimson Center developed the Climate and Ocean Risk Vulnerability Index (CORVI). CORVI is a decision support tool which compares a diverse range of climate-related risks across the land-seascape to produce a coastal city risk profile.114Stuart, J and Sally Yozell, 2020, CORVI: Understanding and measuring climate risk, A guide to the Climate and Ocean Risk Vulnerability Index, The Stimson Center, Environmental Security Program. Accessed August 16, 2021. https://stimson.org/2020/corvi-understanding-and-measuring-climate-risk/. These risks are displayed across 10 categories, grouped under three risk areas: ecological, financial, and political (see figure 2). The 10 categories are in turn made up of close to 100 indicators, covering a range of issues including the vulnerability of vital infrastructure, the health of marine ecosystems, and urbanization dynamics in the chosen coastal city. Each indicator and category are scored using a 1-10 risk scale relative to other cities in the region, offering a simple reference point for decision-makers looking to pinpoint and categorize climate risks. The CORVI risk scores, which form the basis of a coastal city risk profile, are augmented with existing academic and grey literature, government documents, and key informant interviews to develop a comprehensive narrative and understanding of the coastal city’s climate risks and identify priority policy recommendations.
CORVI was successfully piloted in the coastal cities of Castries, Saint Lucia and Kingston, Jamaica. These first two CORVI city assessments demonstrated the value of CORVI’s holistic approach in helping leaders and decision makers prioritize actions and smart investments for risk reduction in coastal cities. Despite the challenges posed by COVID0-19, data and recommendations from both risk profiles are beginning to be incorporated into urban resilience planning.

How CORVI is Different
CORVI builds on the work of previous indices but is distinct in three ways.
- City-Based: Unlike many other indices which tend to focus on the national level, CORVI is city based, providing sub-national level detail on the nature and impact of climate and ocean risks. This focus is based on extensive interviews with potential issuers of the CORVI tool, who noted the difficulty of down-scaling national level risk and vulnerability data to inform policy action to build climate resilience in specific communities.
- Holistic: CORVI looks across a broad set of ecological, financial, and political risk factors connected to climate change impacts and that influence vulnerability of coastal cities and their residents. As part of the category and indicator selection process, indicator inclusion was primary based on its ability to capture and explain climate change risks in coastal cities, and not if data was available. This approach promotes a holistic understanding of climate change impacts to coastal cities.
- Data Driven: Through utilizes SEJ, CORVI is suited to producing actionable insights in data sparse environments. By combining empirical and survey data across a wide range of indicators, CORVI fill data gaps to provide a holistic assessment, while reducing data availability bias. This approach provides a contextual and data driven assessment of climate and ocean risk vulnerability.


Advancing the Sustainable Development Goals
CORVI also aims to contribute to the delivery of the SDGs – an essential framework to guide lasting, positive change. By providing data and information to measure climate risks in coastal cities, this project supports the delivery of the following SDGs:

Complete & Ongoing Assessments
In collaboration with a wide range of on-the-ground research institutions, with the support of different levels of governments, eight additional CORVI coastal cities assessment are now underway across the globe. In addition to providing decision makers in the specific city with a complete risk picture, each risk profile is also added to a global database, to improve understanding of regional risk dynamics.
Rapid Assessments Completed
- Western Province, Sri Lanka
- Southwestern Urban Corridor, Barbados
- Tarawa, Kiribati
Assessments completed
- Castries, St. Lucia
- Dar es Salaam, Tanzania
- Kingston, Jamaica
- Mombasa, Kenya
- Suva, Fiji
Assessments underway
- Basseterre, St. Kitts and Nevis
- Chattogram, Bangladesh
- Dagupan, Philippines
Indicators
To ensure that the CORVI indicator scores provide a holistic risk rating, each is made up of five factors: current, past, and expected trends, the rate of change of the risk, and the impact of this risk on the coastal city.
- The BASELINE measures the current level of risk for each indicator relative to other coastal cities in the region. Baseline data for economic and social indicators is derived from the most recent year of complete data. Climate indicators use a longer time period of 15 years. Note: 30-year time horizons are traditionally used to calculate the seasonal cycle and other long-term averages of climate variables. However, as the climate changes, current conditions are more dissimilar to those from 30 years ago than they are from 10 years ago. In this environment, the optimum climate normals (OCN) method can be used to calculate the minimum number of years required to accurately produce the climatological average for climate variables. The National Oceanic and Atmospheric Administration suggests that a 10-year time series for temperature and a 15-year time series for precipitation are acceptable minimum limits to produce an accurate climatology within a non-stationary period. CORVI follows the same limits that NOAA uses in their experimental seasonal forecast product by using a similar 15-year time horizon to measure climate indicators. For more information on OCN, see Wilks 2013.
- PAST TREND assesses the trend of risk for the past 10 years, measured from the baseline year. The only exception to the 10-year trend measure are the climate indicators, which use a 15-year trend horizon to account for slow onset changes.
- EXPECTED TREND assesses the anticipated trend of risk in the next 10 years, measured from the baseline year. The only exception to the 10-year trend measure are the climate indicators, which use a 15-year trend horizon to account for slow onset changes.
- MAGNITUDE assesses the degree of expected future trend change relative to other cities in the region. Change that happens quicker than expected is assumed to increase risk when compared to changes that take place over a longer time scale. This assumes that longer time periods of change contribute to less risk, as decision makers have more time to adapt and build resilience.
- Finally, IMPACT assesses the importance of change for each indicator in describing future risk in the coastal city.

Data Collection and Structured Expert Judgement
To overcome data gaps, CORVI employs structured expert surveys to collect data that is otherwise unavailable. This primary data is combined with secondary data using the approach of structured expert judgement (SEJ) to produce a comparative score for each indicator in the assessment.115For an introduction to structured expert judgement, see Cherie Maestas, “Expert Surveys as a Measurement Tool: Challenges and New Frontiers,” in Lonna Rae Atkeson and R. Michael Alvarez (eds) The Oxford Handbook of Polling and Survey Methods (Oxford: Oxford University Press, 2018). SEJ is well-established social science technique that seeks to quantify risk when pre-existing secondary data is inadequate. Through interviews and surveys, as well as a series of weighting procedures to ensure data is representative, SEJ allows researchers to quantify topics that might otherwise be challenging to study in such a systematic fashion.
To apply SEJ to CORVI, subject matter experts across academia, government, civil society, and the private sector are identified through research and extensive outreach to stakeholders in the target coastal cities. These experts then refer the project team to other experts and stakeholders with appropriate expertise using “snowball sampling.”116Snowball sampling or chain-referral sampling is a non-probability sampling technique used when samples have traits that are difficult to find. In this sampling technique, existing subjects provide referrals to recruit additional subjects required for a research study. To guard against confirmation bias, survey answers are compared to a regional secondary empirical dataset to weigh the expert responses by utilizing a coherence check.117Abigail Colson and Roger Cooke, “Expert Elicitation: Using the Classical Model to Validate Experts’ Judgements,” Review of Environmental Economics and Policy 12, no. 1 (2018): 113-132. This ensures that experts whose answers do not match secondary data are not weighed as highly as those who do.
This approach has several strengths. First, CORVI incorporates the views of subject matter experts and local stakeholders at each stage of its implementation. This allows the final product to better reflect the specific context which it is seeking to measure and provide more focused information for end users. Second, pairing primary survey data with secondary data through SEJ also allows CORVI to provide insight into risks relating to urban coastal environments that existing secondary datasets do not cover. While the use of SEJ allows CORVI to assess a diverse range of risks, it should not be regarded as a substitute for empirical data collection. Rather, SEJ is best viewed as an alternative research technique specialized to analyzing topics with significant data gaps.1184 Kunreuther H., S. Gupta, V. Bosetti, R. Cooke, V. Dutt, M. Ha-Duong, H. Held, J. Llanes-Regueiro, A. Patt, E. Shittu, and E. Weber, 2014: Integrated Risk and Uncertainty Assessment of Climate Change Response Policies. In: Climate Change 2014: Mitigation of Climate Change. Contribution of Working Group III to the Fifth Assessment Report of the Intergovernmental Panel on Climate Change [Edenhofer, O., R. Pichs-Madruga, Y. Sokona, E. Farahani, S. Kadner, K. Seyboth, A. Adler, I. Baum, S. Brunner, P. Eickemeier, B. Kriemann, J. Savolainen, S. Schlömer, C. von Stechow, T. Zwickel and J.C. Minx (eds.)]. Cambridge University Press, Cambridge, United Kingdom and New York, NY, USA.
Acknowledgements
This project was supported by the Ocean Risk and Resilience Action Alliance (ORRAA) and was funded with UK aid from the UK government.

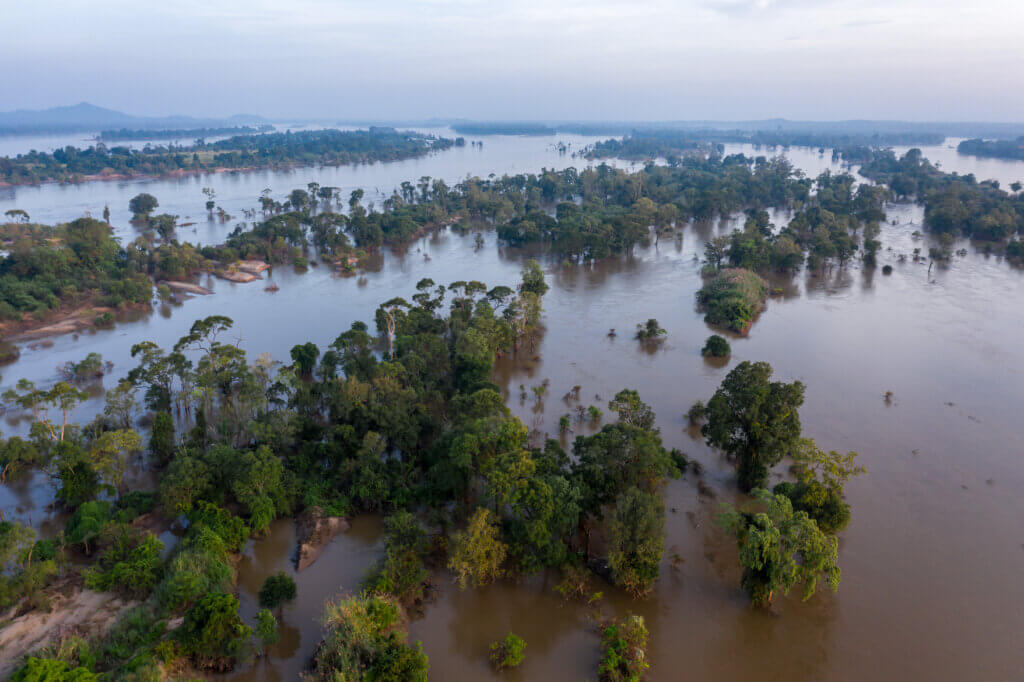


Current Geopolitics Shift Deep-Sea Mining Debates