Executive Summary
This report summarizes analysis and key findings of the Mekong Dam Monitor’s (MDM) efforts to track the impacts of dams and climate on the Mekong’s natural hydrological system across the 2023 wet season-2024 dry season cycle. The MDM integrates multiple remote sensing and earth observation inputs to track the impacts of 60 dams throughout the entire Mekong Basin. Our efforts increasingly help stakeholders parse out the negative impacts of dams from the dynamic impacts that a changing climate brings to the Mekong. Our early warning service for sudden dam releases along the Thai-Lao border protects vulnerable people and their assets.
We use a wet to dry season cycle as our reporting time frame because, as is explained below, wet season dam operations directly impact wet season river levels and also impact river levels in the subsequent dry season. This report provides evidence to show that there is a reciprocal relationship between dam restrictions and subsequent dam releases, the degree of which is also linked to climate conditions. Establishing this relationship is important because if goals related to fisheries productivity or conservation are set, such as a suitable peak volume of seasonal inundation around Cambodia’s Tonle Sap Lake, then it is in turn possible to use improved climate forecasting to inform an optimal schedule for wet season dam restrictions that can hit fisheries or conservation goals and still optimize hydropower production targets. Such optimization of tradeoffs across the food-water-energy nexus is now possible, but achieving this optimization requires coordinated operations of dams across the entire Mekong Basin.
In brief, the 2023 wet season was exceptionally dry, particularly in China for most of the wet season from June-November. This led to the lowest observed cumulative dam restrictions in China since the MDM began operations in 2020. This then translated into lower negative impacts of dams during the wet season to the Mekong downstream and to key features like the Tonle Sap Lake and the Mekong Floodpulse. While Mekong flow at the beginning and end of the wet season followed a relatively normal historical flow pattern, dam restrictions added to a “missing middle” of wet season flow (explained below) during the core months of August and September, sending the Mekong from normal conditions to below normal conditions. As a result, dam restrictions reduced the Tonle Sap Lake’s annual expansion process and the Mekong Floodpulse.
A relatively dry 2023 wet season also led to lower flows during 2024’s dry season compared to previous recent years. For the first time in many years, local communities enjoyed the bounties provided by low river levels in the early months of the dry season. Dry season dam releases have the ability to lift the river level to 2-3 times its normal historical average, but flow conditions remained mostly normal for the initial 2024 dry season months. However, dam releases still lifted river flow to 60% higher than the historical average during the later dry season months of March and April.
The findings above are detailed in the later sections of this report and are illustrated with interactive infographics and rich satellite imagery. The report kicks off with a discussion of key developments, advancements in data sharing, and joint collaborative efforts made by Mekong governments over the report’s one year timeline. This section also uses new findings to highlight the need for further strengthening of the 1995 Mekong Agreement’s core protocols. The final sections of the report review new products and services added to the Mekong Dam Monitor platform, list webinars and media mentions, and discuss what’s next for the Mekong Dam Monitor.
Key Developments
Improved data sharing
Knowledge produced by the MDM over the course of the last year has continued to enable a constructive discourse among key actors and organizations in the basin. Recently, MRC member countries have begun sharing dam operations data with the MRC Secretariat in Vientiane, Laos. Further, the governments of Laos, Cambodia, and Vietnam agreed in 2024 to a pilot a project to study and possibly jointly operate dams in the transboundary 3S Basin, a recommendation we made in comprehensive report on the 3S Basin published in 2023. The Cambodia National Mekong Committee also restored a gauge at Siempang, Cambodia (another recommendation we made in our 2023 3S Basin report) that will allow Cambodia and the MRC to better understand the impacts of upstream dams in Laos and Vietnam on the transboundary Sekong River.
Sharing dam data to a centralized institution like the MRC enables the MRC to understand how dams impact and reduce the Mekong’s ecological benefits such as its fisheries. Increased data sharing can lead to more effective transboundary planning initiatives and investments. With more dam operations data in hand, the MRC can advise member countries on disaster risk reduction when transboundary floods hit the Mekong Basin. China pledged in September 2023 to share dam operations data to the MRC in some capacity by the end of the 2023 calendar year but has yet to follow through with that pledge as of late 2024.
Sharing dam operations data with the public is still needed. Vietnam, Thailand, and Laos provide dam operations data on a limited set of dams located in their respective portions of the Mekong Basin on public websites. Cambodia has yet to establish such a portal. Public provision of dam operations data helps build trust and accountability. For instance, local disaster responders, some of whom are supported through non-government efforts, can better anticipate the impacts of natural disasters to communities living below or around dams if given access to dam operations data. Researchers can use dam operations data to better understand how changes to the Mekong’s natural hydrological cycle are affecting socio-economic changes, biodiversity, and other indicators in the basin.
Most importantly, however, when communities have access to information on dam operations, they will better identify effects on livelihoods, adapt to changing situations, and develop trust with the governance structures that surround them. Data sharing can also go both ways, allowing communities to integrate their knowledge and guidance to more effectively manage water resources in their part of the basin. It also allows various communities along the basin to understand how human alterations to natural flow such as sand mining or dam operations impact communities downstream. This dialogue among communities and researchers can inform better policy in the Mekong Basin at large.
Figure 1 shows a breakdown of the number of Mekong Basin dams for which operations data are shared publicly. This is compared to the number of operational dams in the basin of all sizes and functions as identified by the Mekong Dam Monitor’s surveying efforts.
Figure 1: Only a handful of Mekong dam data is shared publicly
Arguments for Strengthening the 1995 Mekong Agreement
In May 2024, we published an All Dams Map of the Mekong (Figure 2) which shows the locations of all 745 dams completed or under construction throughout the Mekong River Basin. Click the link to understand more about the methods used to map and catalogue these dams and also download the map’s underlying dataset. This dataset includes dams of all sizes and functions including hydropower generation, water supply, and mixed-use. After we published this map, the Phnom Penh Post published an article entitled “MRC members see 61 projects along the Mekong River and its tributaries” – a startlingly low number since it is well established that Laos alone has nearly 100 dams completed on the mainstream and tributaries.
Figure 2: All Dams Map of the Mekong
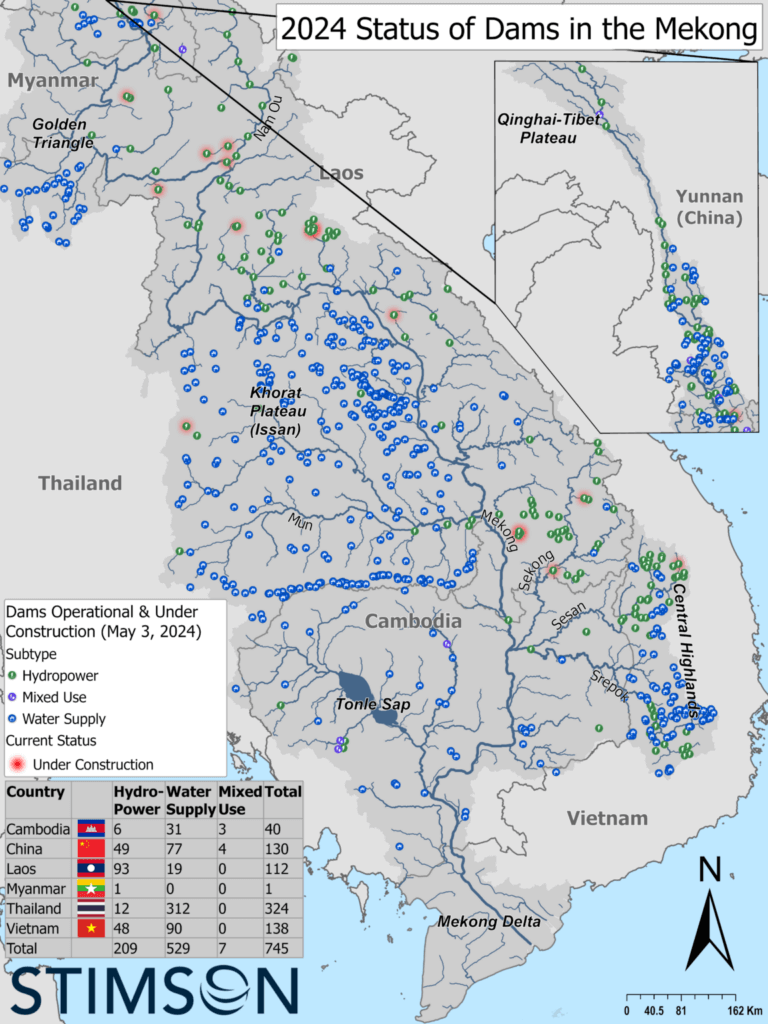
Inquiries to government authorities revealed to our team that 61 was the number of times MRC member governments have notified the MRC Secretariat of the construction of a dam or other infrastructure project that impacts the Mekong mainstream or tributaries as required by the 1995 Mekong Agreement’s Prior Notification, Prior Consultation, and Agreement (PNPCA) protocol. Yet, our All Dams Map shows more than 600 dams completed or under construction across MRC member countries. The 1995 Mekong Agreement requires notification for ALL tributary and mainstream dams without specification of size, and the Phnom Penh Post article revealed a significant gap in member country adherence to the 1995 Mekong agreement: only about 10% of the existing or under construction dams have been notified. Official notification is important because only those dams which have been notified can fall under the purview of MRC research and studies, meaning there currently is a huge gap in the understanding of how dams are impacting the Mekong Basin.
Our previous annual report profiled a stakeholder-led process which led to the eventual Lao PDR government notification for the Sekong A dam near Laos’s border with Cambodia. After notification occurred, Laos voluntarily agreed to the application of a Transboundary Environmental Impact Assessment of the dam – an improvement on the status quo and the first transboundary EIA facilitated by the MRC. But inconsistent interpretation and application of the PNPCA process by all MRC member countries is leading to suboptimal outcomes for the basin. In August 2023, the Cambodian National Mekong Committee notified the MRC of its plans to construct the Funan Techo Canal but characterized the project in a manner that avoided the full responsibilities of the protocol.
Third party efforts that promote transparency such as the MDM are becoming more commonly used to demonstrate how governments can more closely follow the 1995 Mekong Agreement. Importantly MRC member countries, development partners, and especially vulnerable communities rely on and expect other member governments to follow the agreement, particularly when it comes to the PNPCA process. If member countries do not follow these protocols, a cycle of negative behavior can churn among member countries. Without the 1995 Mekong Agreement, the natural resource base of the Mekong upon which tens of millions directly rely, cannot be conserved. Last year, MRC CEO Anoulak Kittikhoun said that the MRC Secretariat is not the police force of the Mekong Agreement: in other words, only the member governments themselves can enforce the international treaty and hold each other accountable.
Tuoba Dam: 12th Chinese Dam on Mekong fills during the 2024 dry season
Figure 3: China’s Tuoba Dam Fills During the 2024 Dry Season
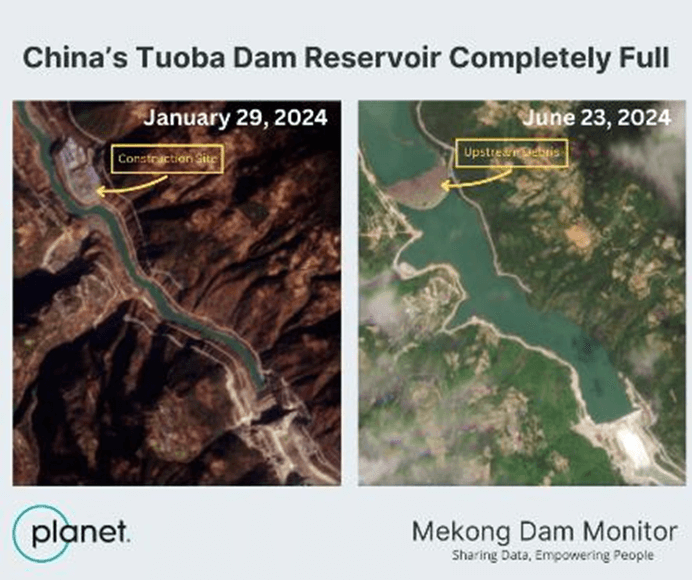
Another discovery made possible by MDM use of satellite imagery to scan the Mekong Basin for dam construction was the completion and filling of the Tuoba Dam in China. In March, we published optical satellite imagery from Planet Labs showing that the dam had finished construction and started to fill its reservoir around February 1, 2024. The 1400 MW dam is located far upstream in Yunnan province between the Lidi and the Huangdeng dams. In less than five months, we estimate its reservoir filled to its maximum capacity with 1.215 billion cubic meters of water.
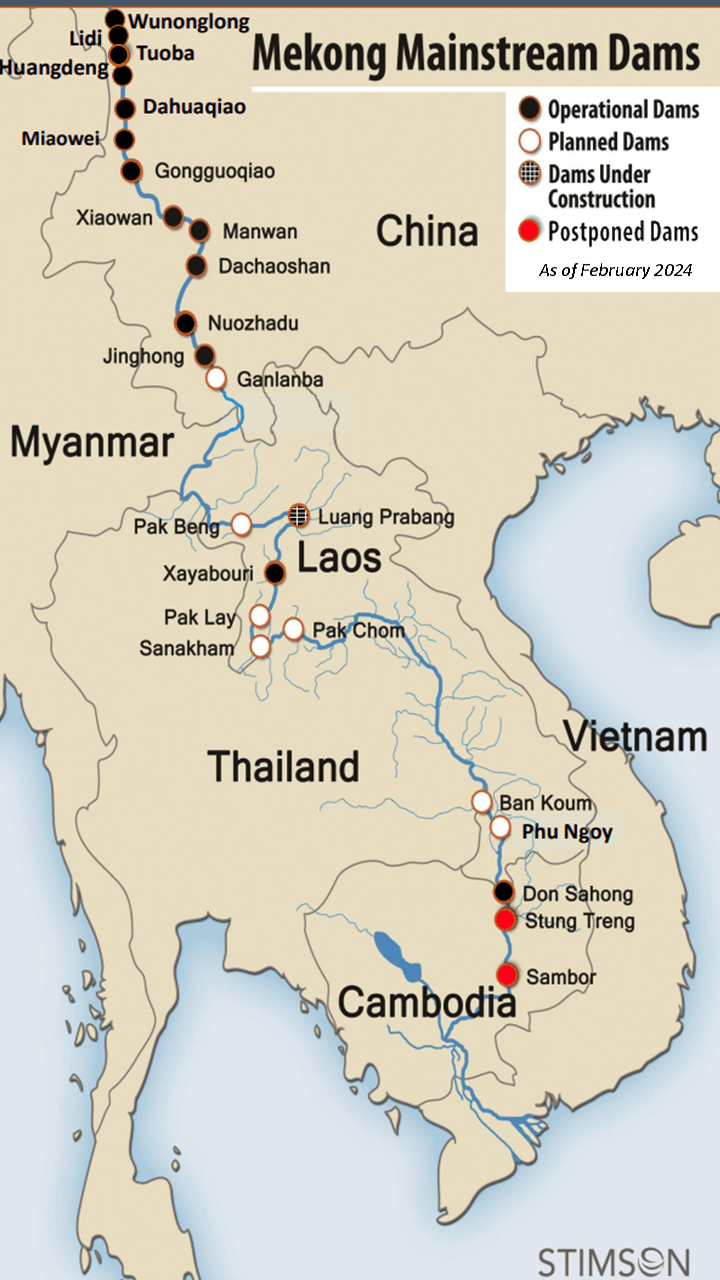
No notification was given to the MRC or downstream stakeholders that the dam would fill its reservoir during the dry season (when water is needed downstream), let alone that the dam’s construction had been completed. The lack of notification once again underscored the need for improved communication from all Mekong countries on the status of dam construction and their operations. The impact of Tuoba’s reservoir filling over the course of the dry season months is explored in the dry season overview section below. In March we updated our Mekong Mainstream Dams map (Figure 4) to reflect Tuoba’s completion.
Figure 4: Mekong Mainstream Dams
2023 Wet Season
The 2023 Mekong Floodpulse’s Missing Middle
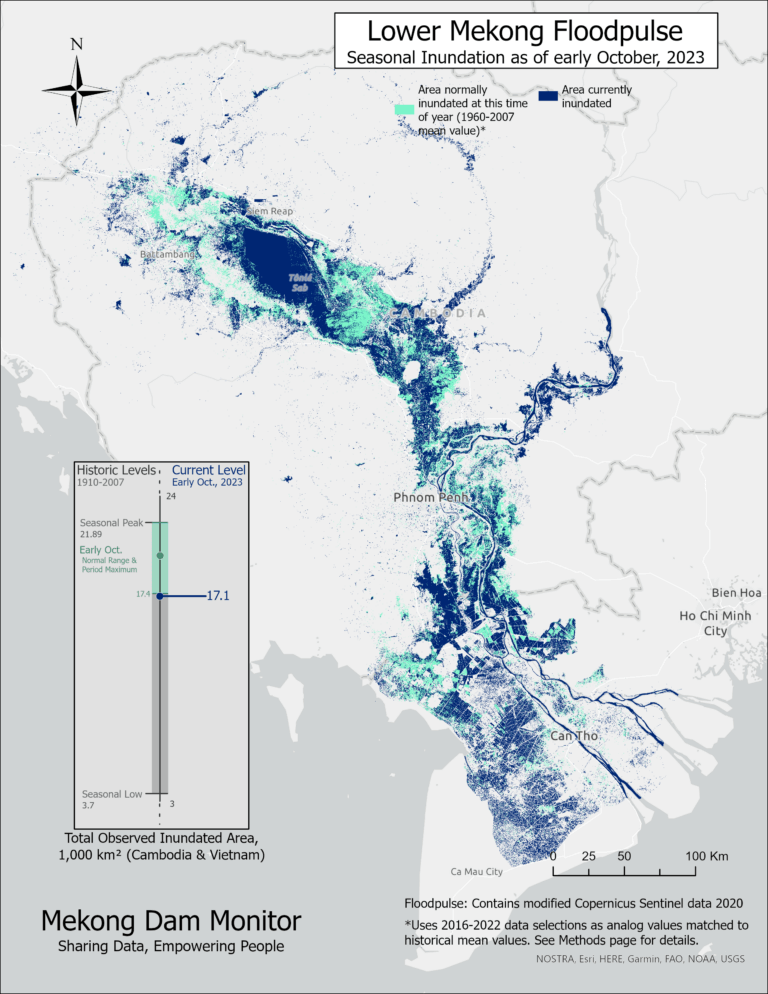
Much has been written about the power of the Mekong Floodpulse to make the Mekong River the most productive river in the world for fisheries and drive industrial agricultural production in Thailand and Vietnam that feeds not only the region but much of the world. The floodpulse also forms the basis of the diverse cultures and identities of people throughout the Mekong. Our previous annual report discusses many of the benefits that the annual floodpulse brings to more than 65 million people living in the Mekong Basin. In February 2024, we published an animation (Figure 5) of what a normal floodpulse in the Mekong looks like using imagery pieced together from 2018 satellite observations.
Figure 5: Mekong Floodpulse
![]()
In this animation, the Tonle Sap Lake expands to five times its normal size during the months of June through September as the Mekong River spills over into the Tonle Sap River and causes the Tonle Sap River’s flow to reverse direction. As this happens, huge volumes of fish eggs and larvae from upstream pour from the Mekong into the lake. Along with the young fish come sediment and organic materials which form a robust food web for the lake’s fishery.
These ingredients come together to make the Tonle Sap Lake the largest inland fishery on the planet. From October to January the lake contracts, sending its water back down the Mekong. Many of the fish that found habitat in the lake leave and migrate through the Mekong back upstream forming the planet’s largest migration of living beings. The contraction of the lake also sends water to Vietnam, prolonging seasonal flooding in the Mekong Delta and making it an ideal landscape for industrial-scale rice farming.
Figure 6 below shows the floodpulse measured at Stung Treng, Cambodia using daily MRC data from 1910-2007, stopping at the year before dams began to significantly alter the flow of the Mekong. The blue line shows the high rise of the river during the wet season and its fall into the dry season, and the blue shaded band shows a range of normal observations – the band is thicker during the core wet season months than it is during the dry season showing how variable wet season flows can be year to year.
Figure 6: The Missing Middle of 2023’s Floodpulse
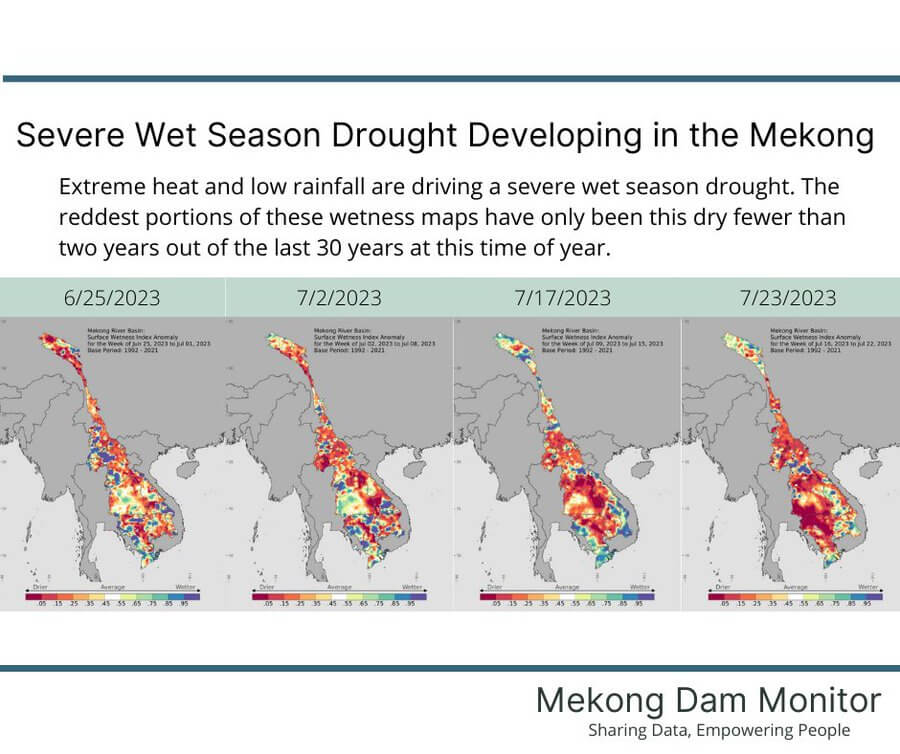
How Wet or Dry was the 2023 Wet Season?
The search for the 2023 Mekong Floodpulse’s missing middle begins with an examination of temperature and surface wetness throughout the wet season months. Figure 8 shows how temperatures throughout most of the Mekong Basin for most of the wet season (June through November) were above average compared to the last 30 years. The upper basin in China had above average temperatures, sometimes between 5-9 degrees Celsius higher than average, for nearly every month of the wet season.
In the Lower Mekong countries of Laos, Thailand, Cambodia, and Vietnam, the wet season started out extremely warm in June, but temperatures were around average or mostly average through September. High temperatures returned to the downstream in October and November. Higher temperatures do not necessarily mean precipitation will be lower during the wet season, but higher temperatures do mean that the surface of the earth will dry more quickly, and as a result less ground and surface water will be available to drain into river systems.
Figure 8: How Hot was the 2023 Wet Season?
Use the arrows to navigate through all the maps
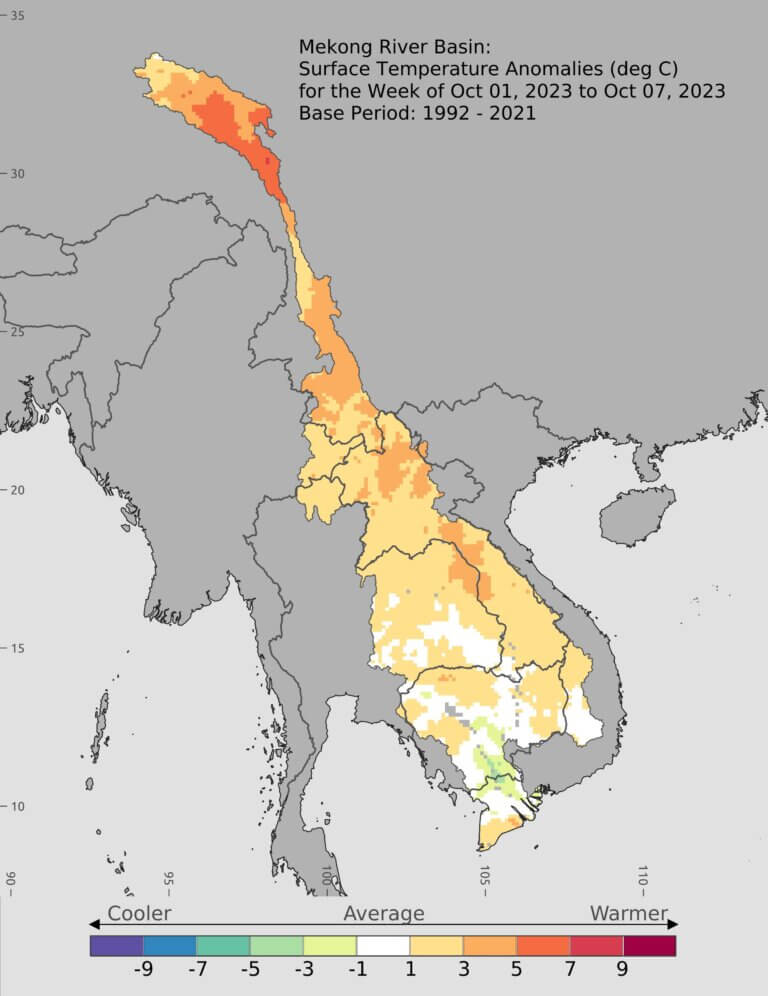
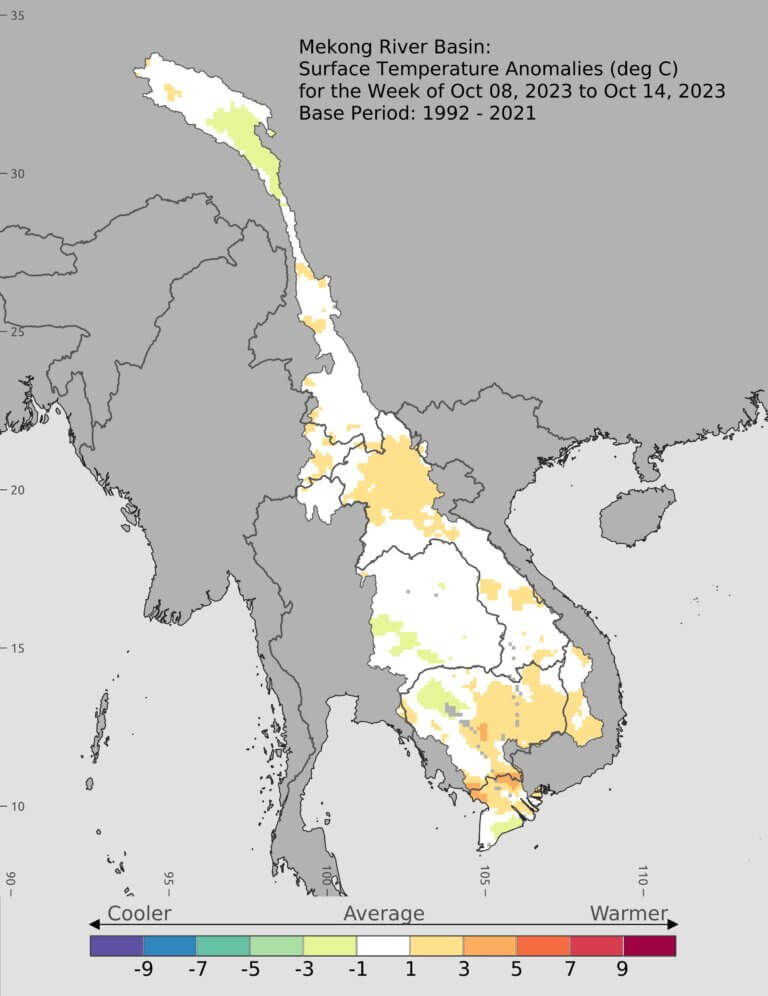
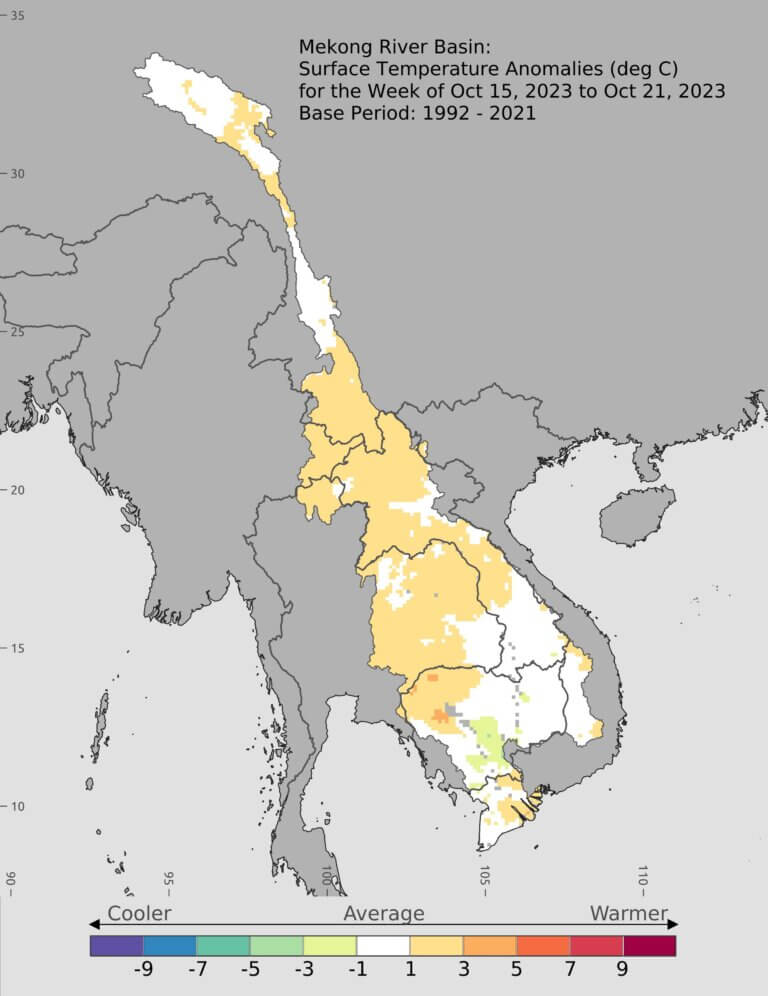
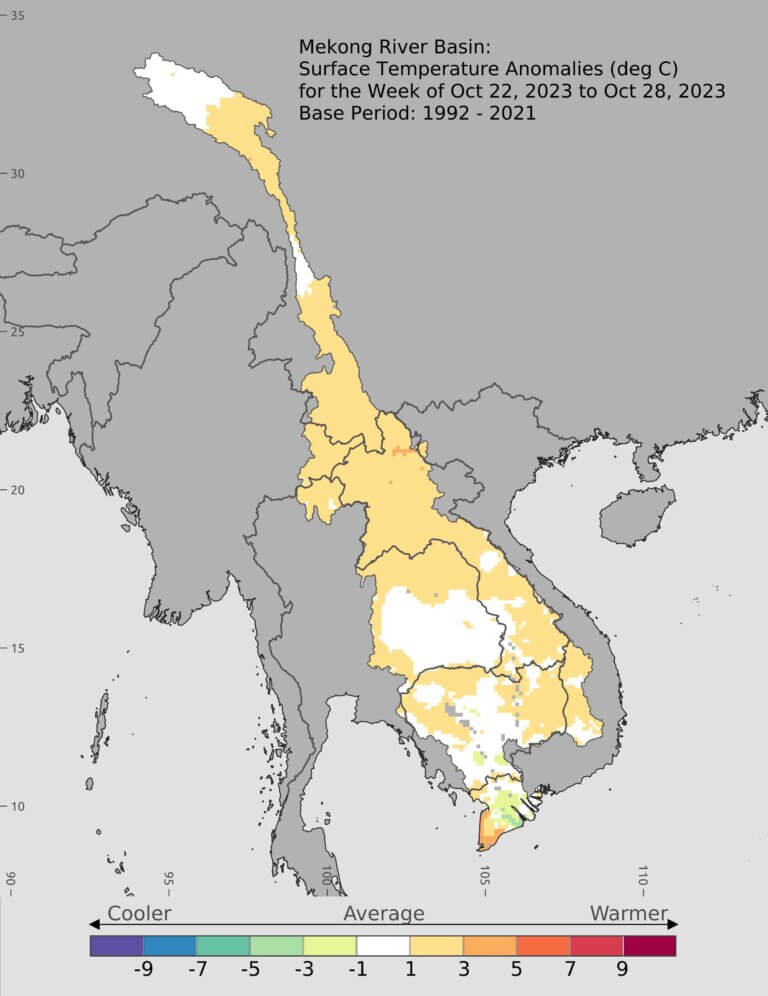
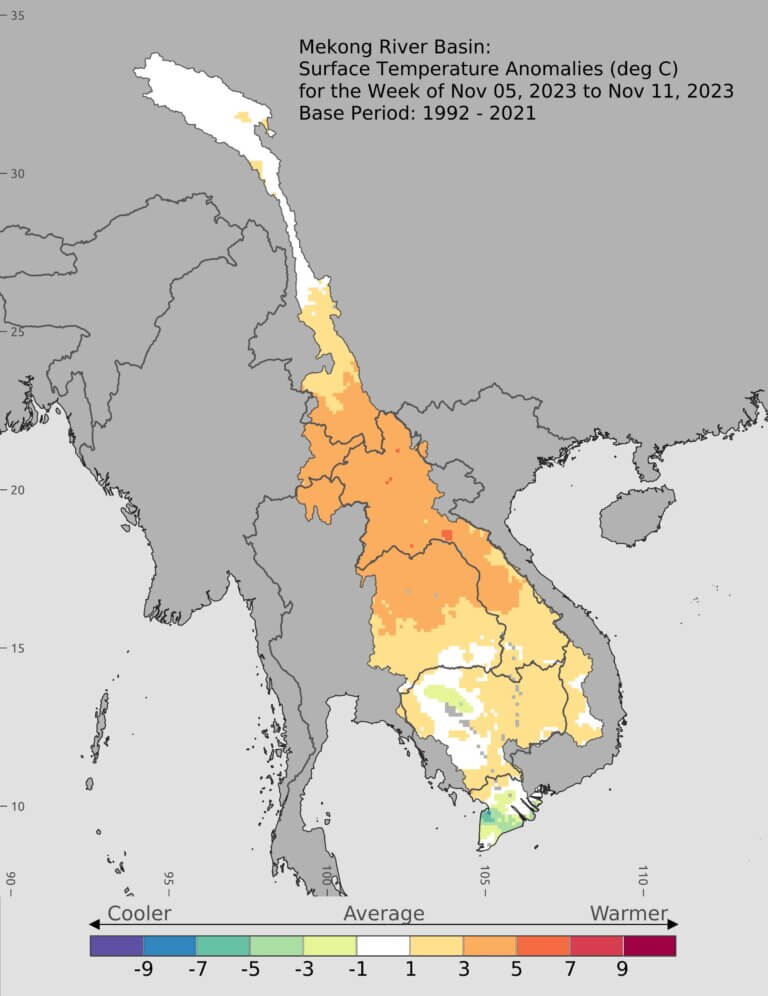
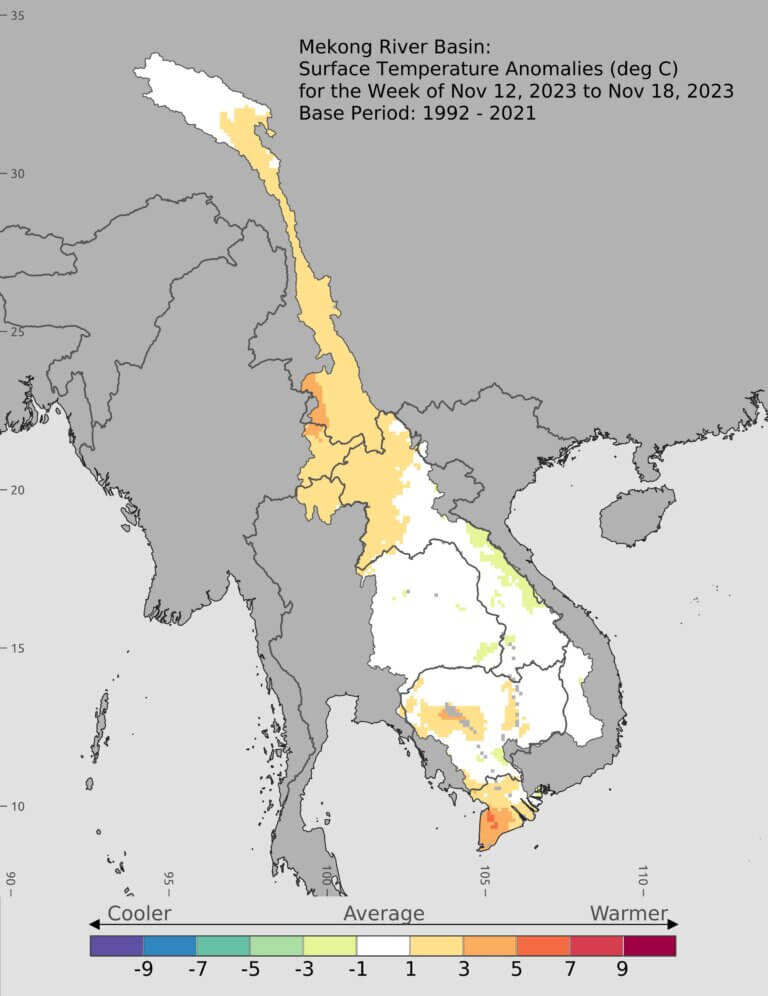
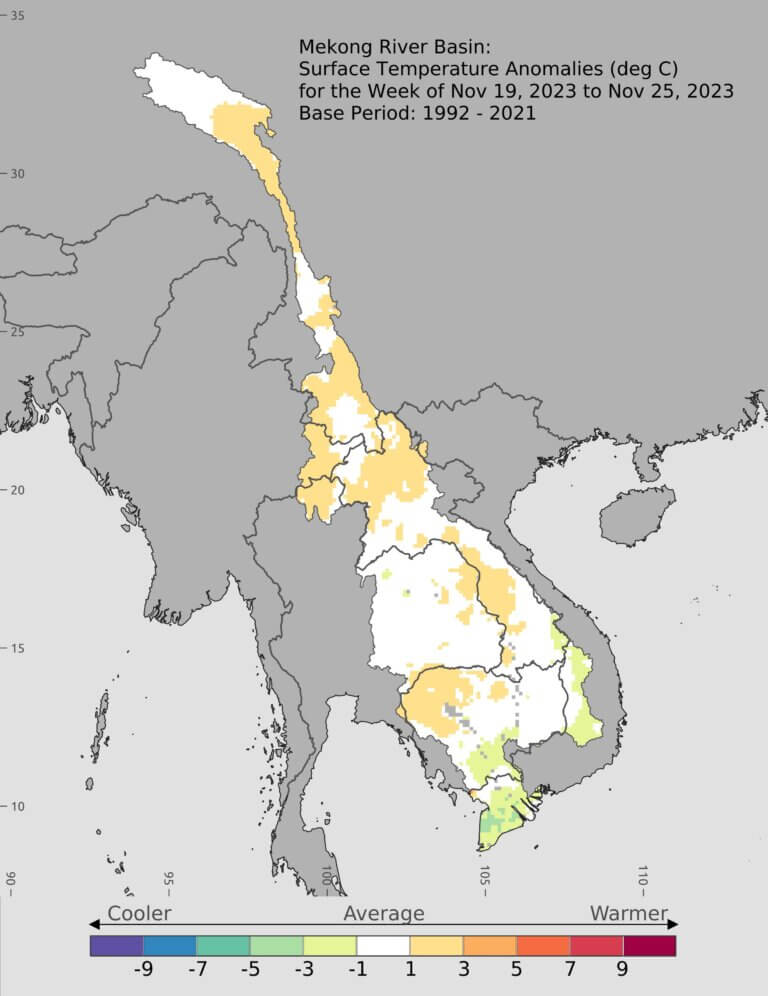
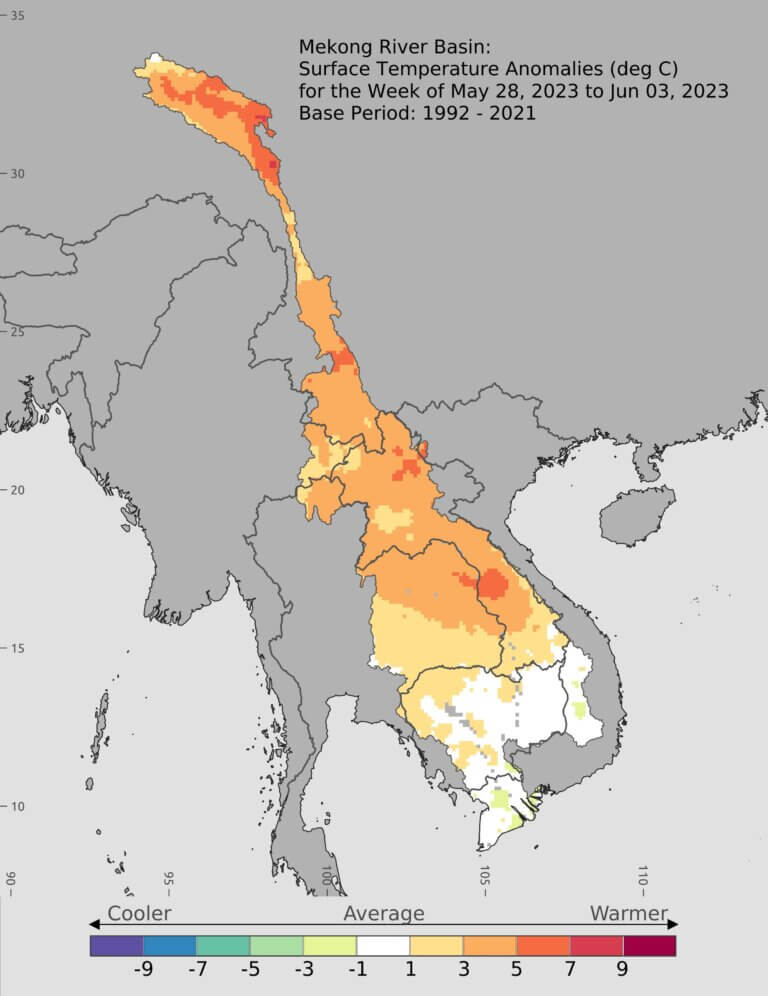
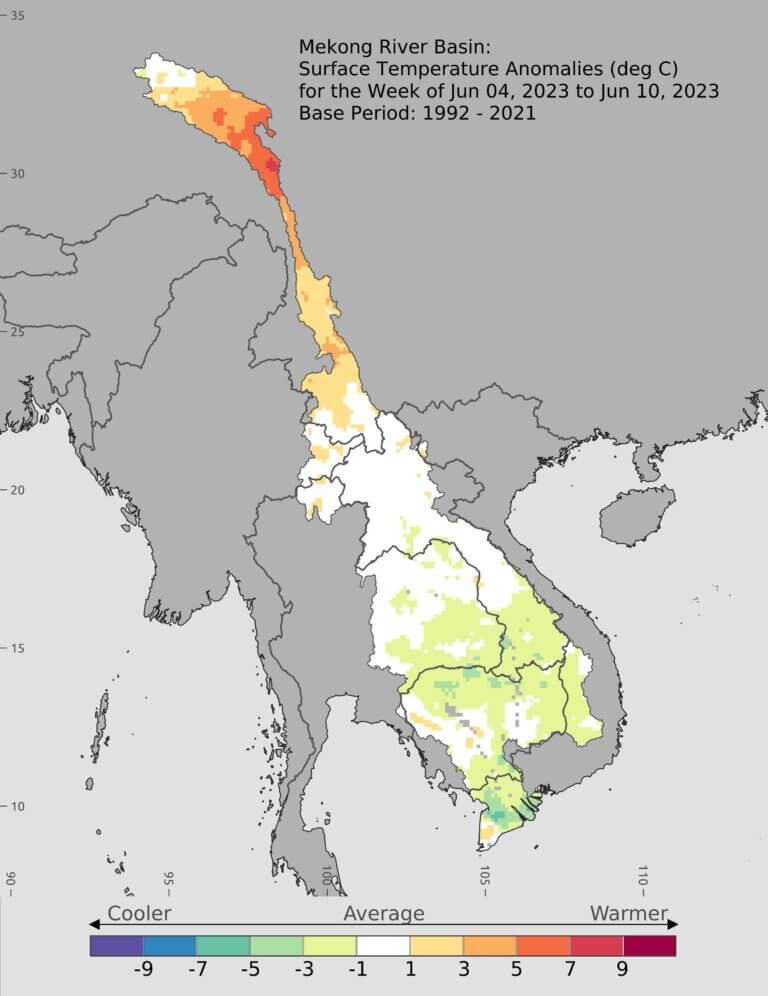
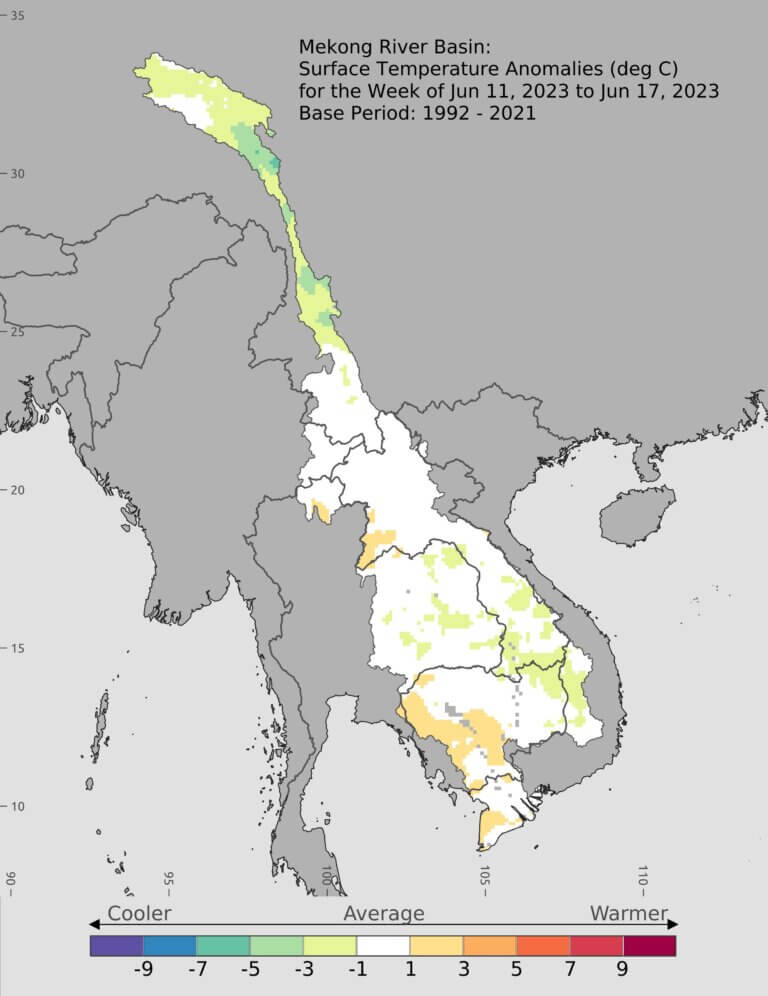
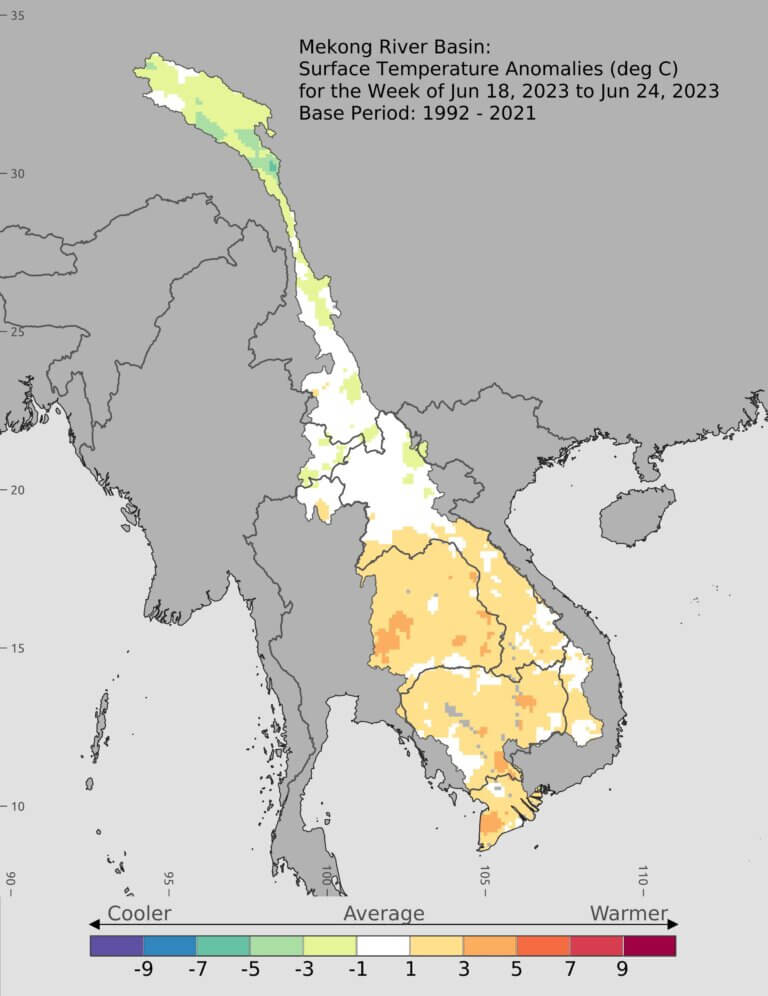
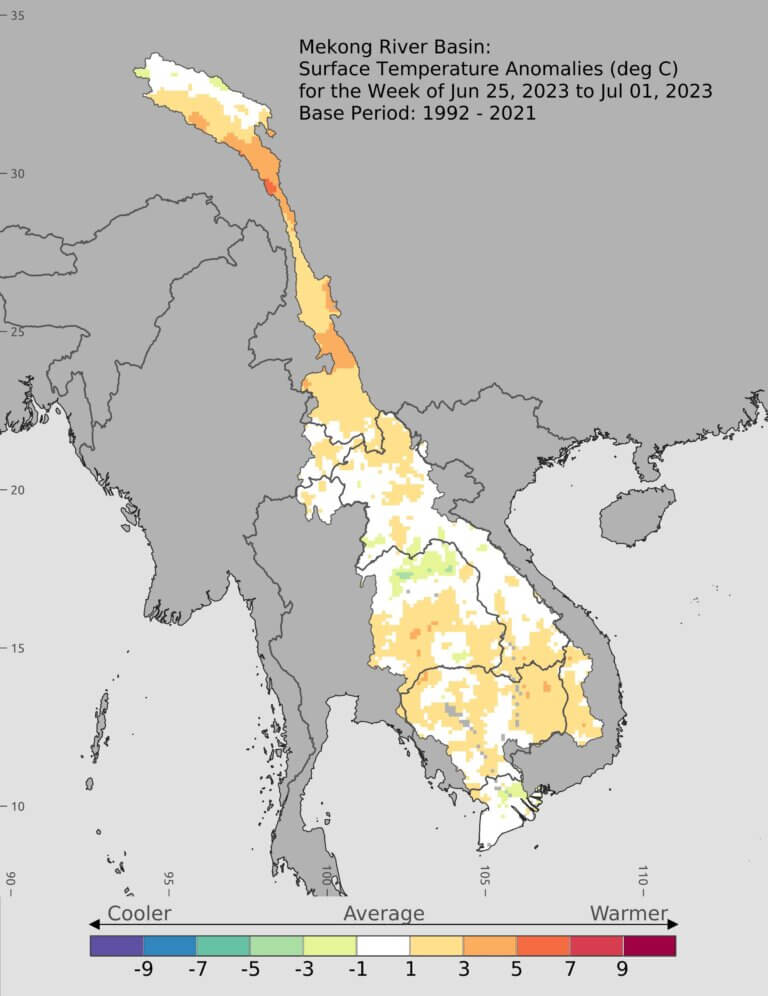
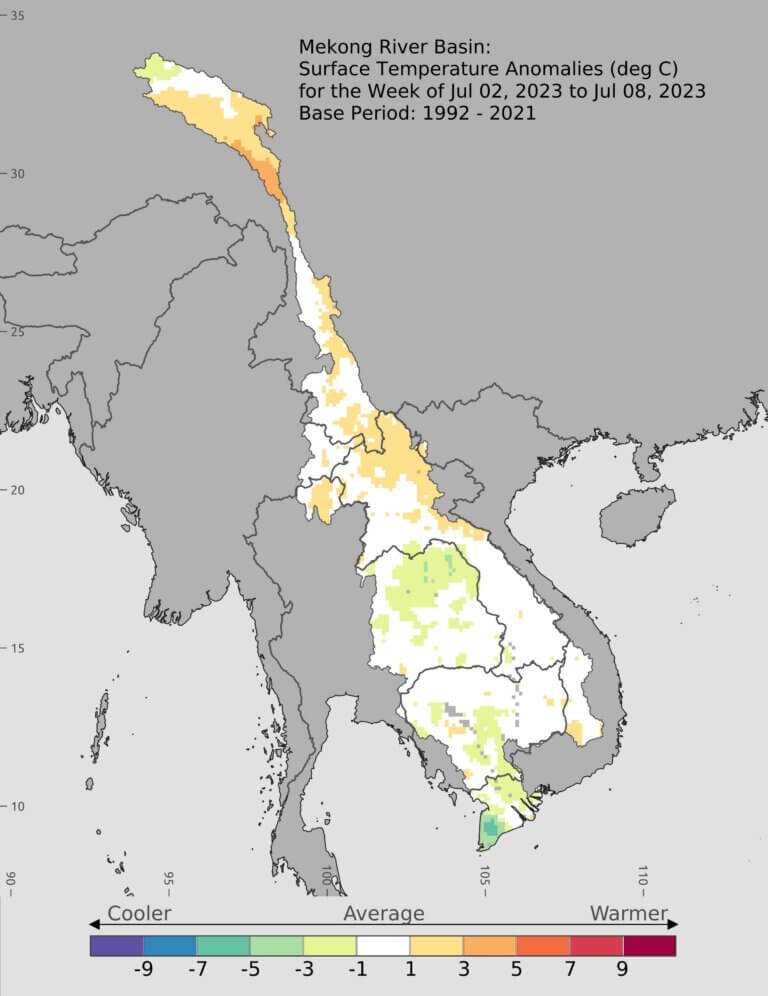
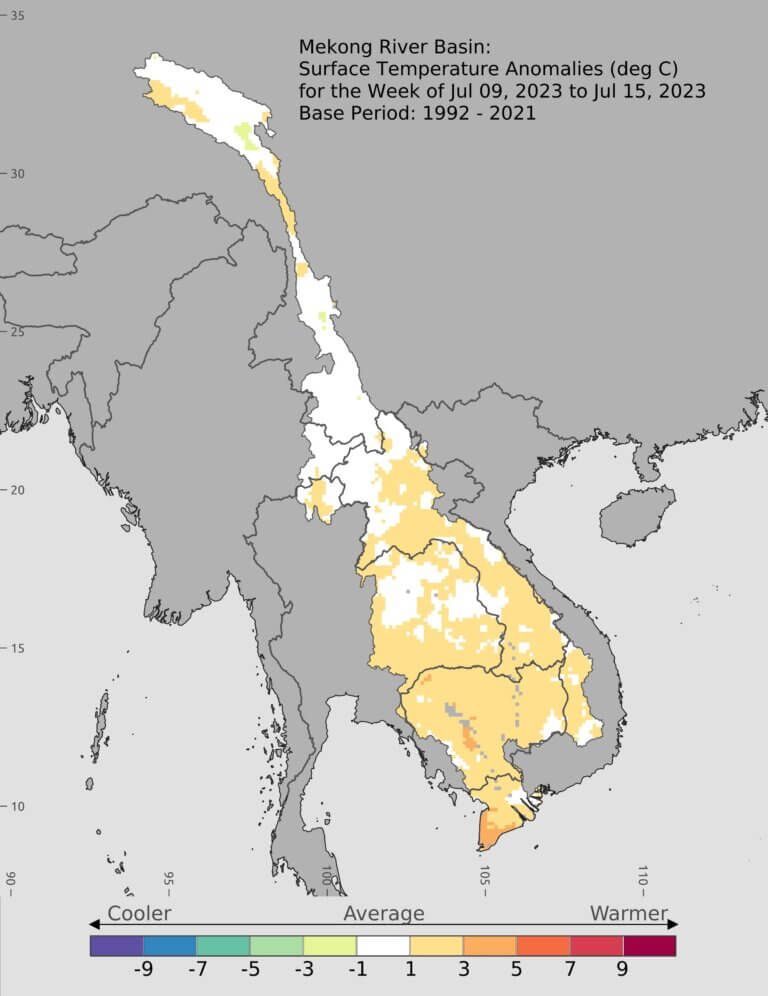
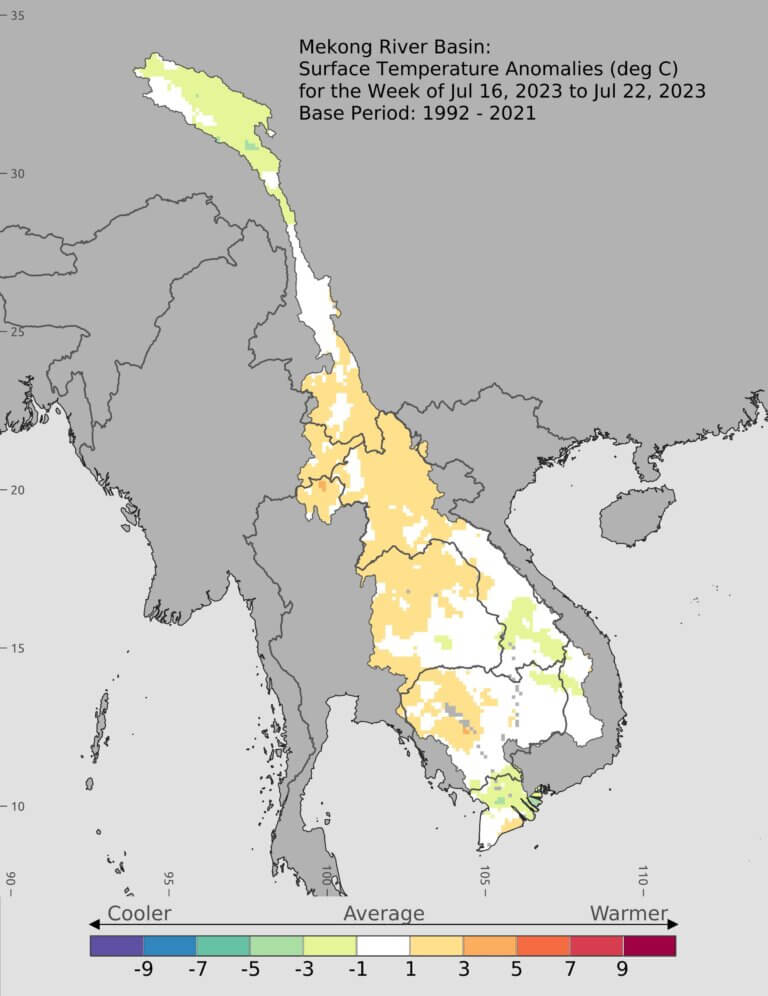
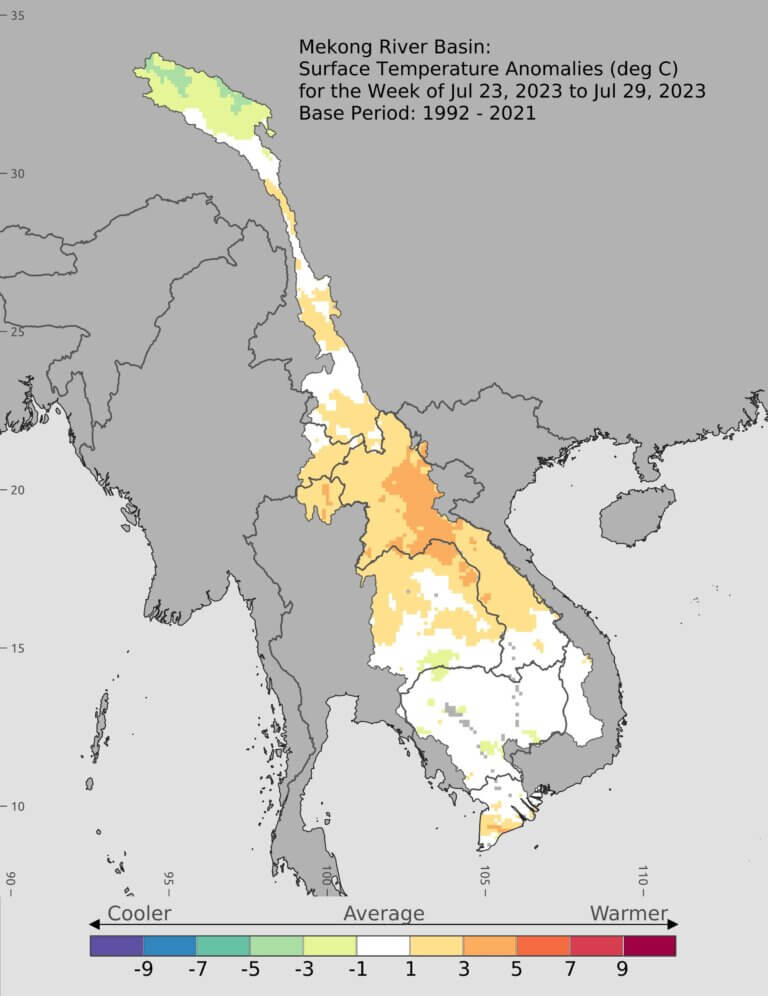
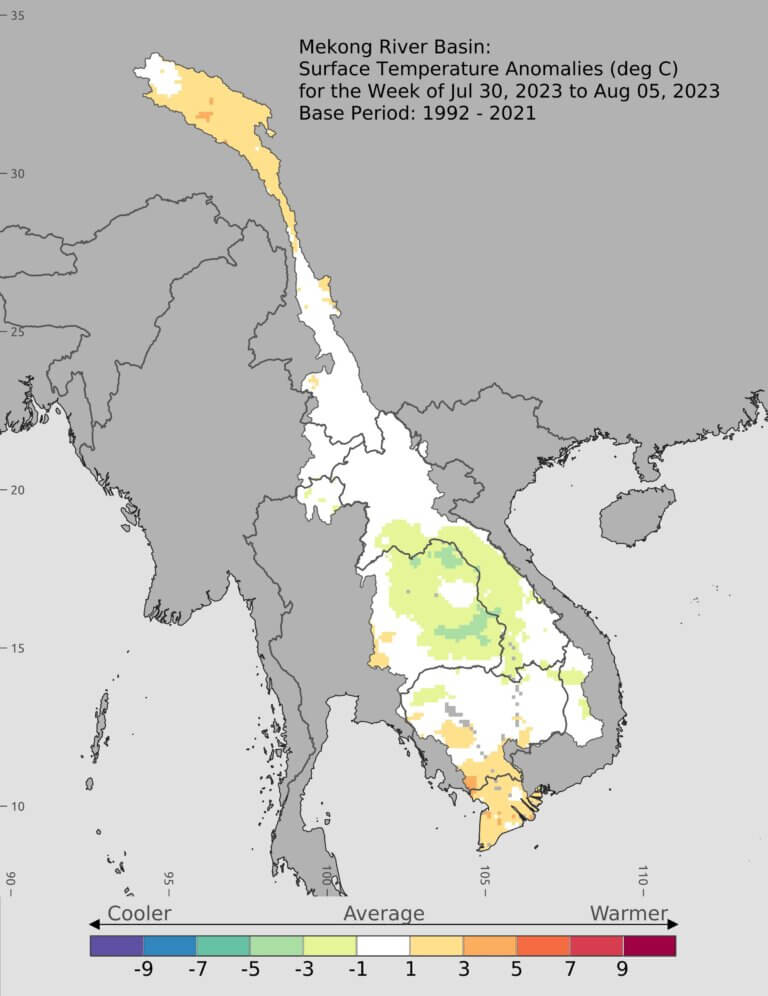
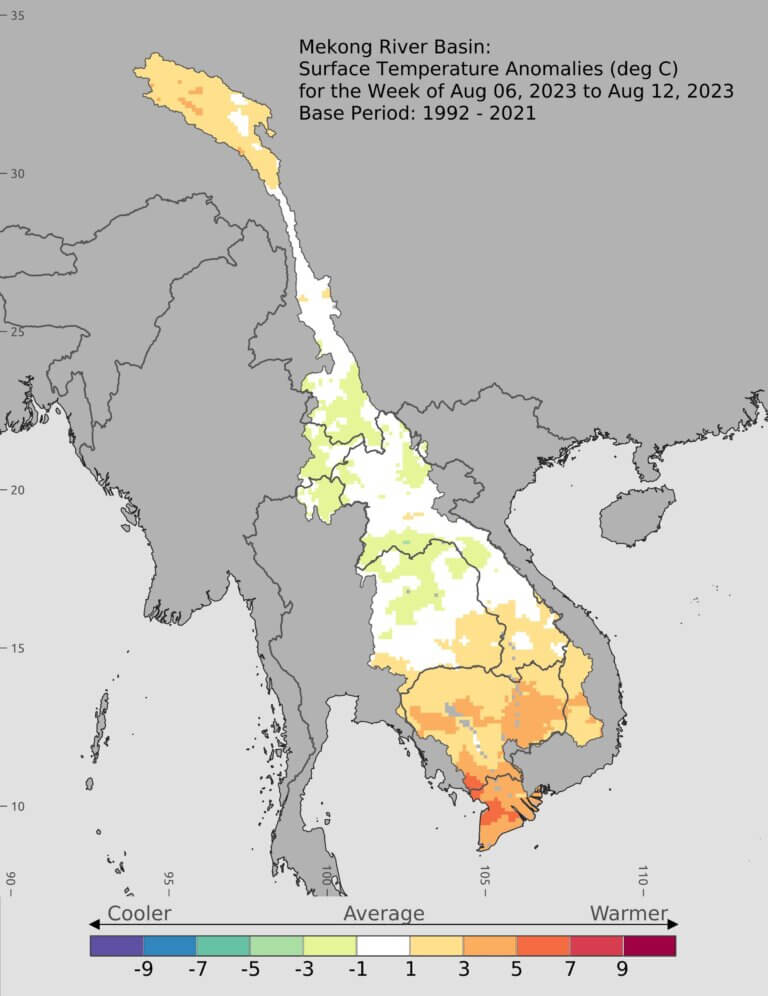
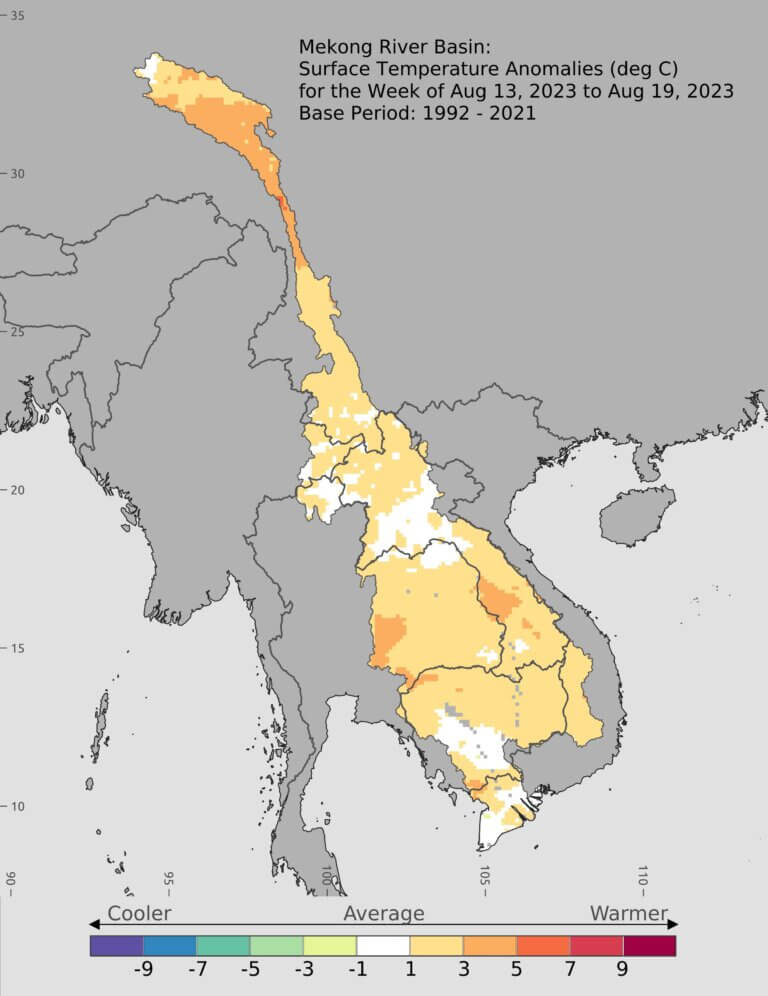
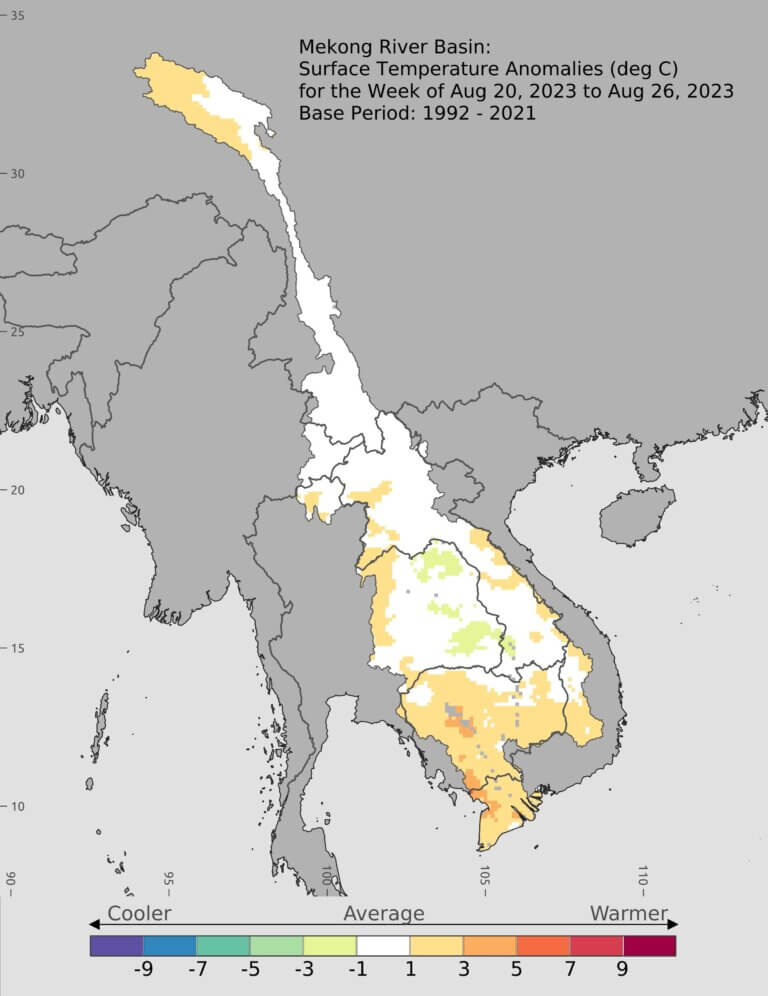
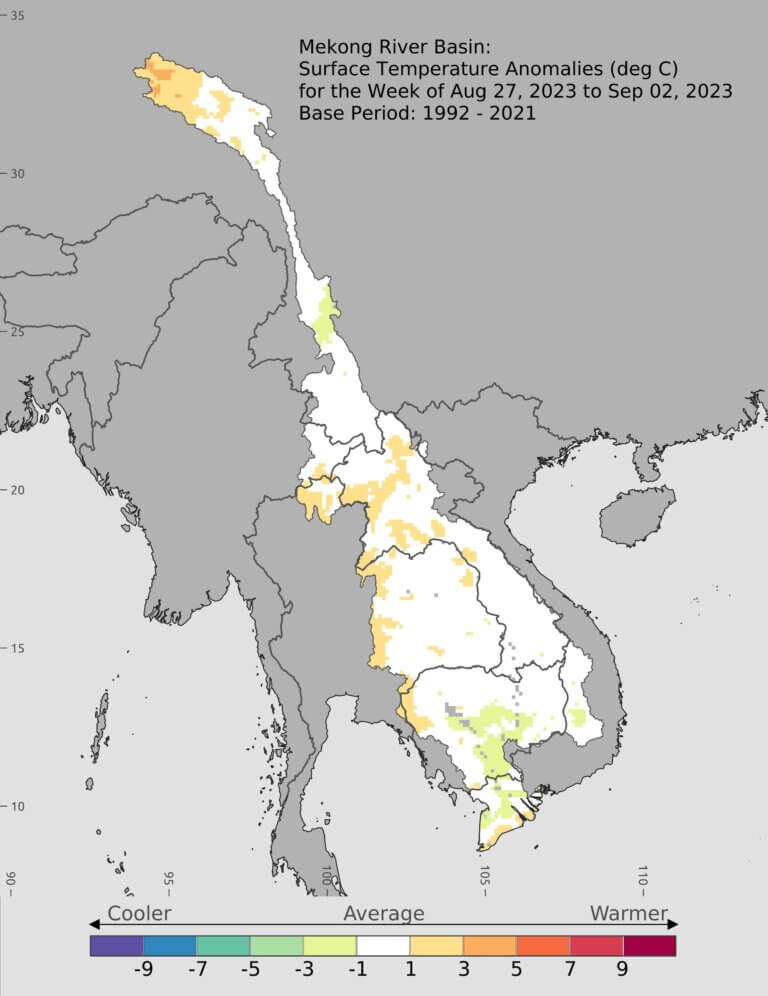
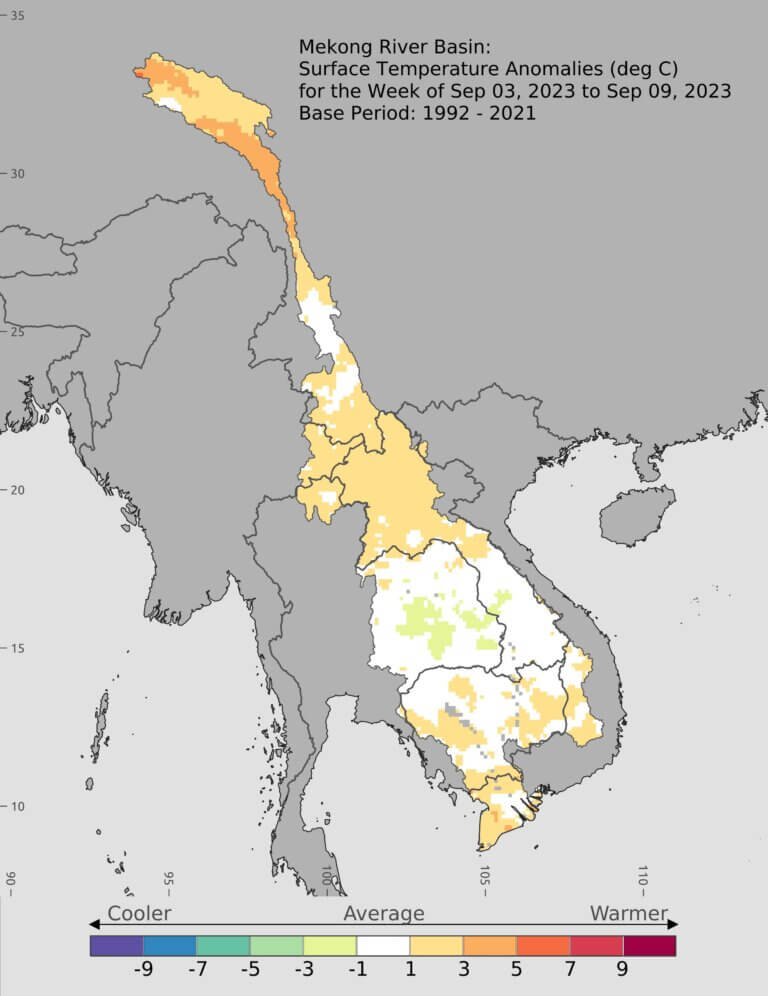
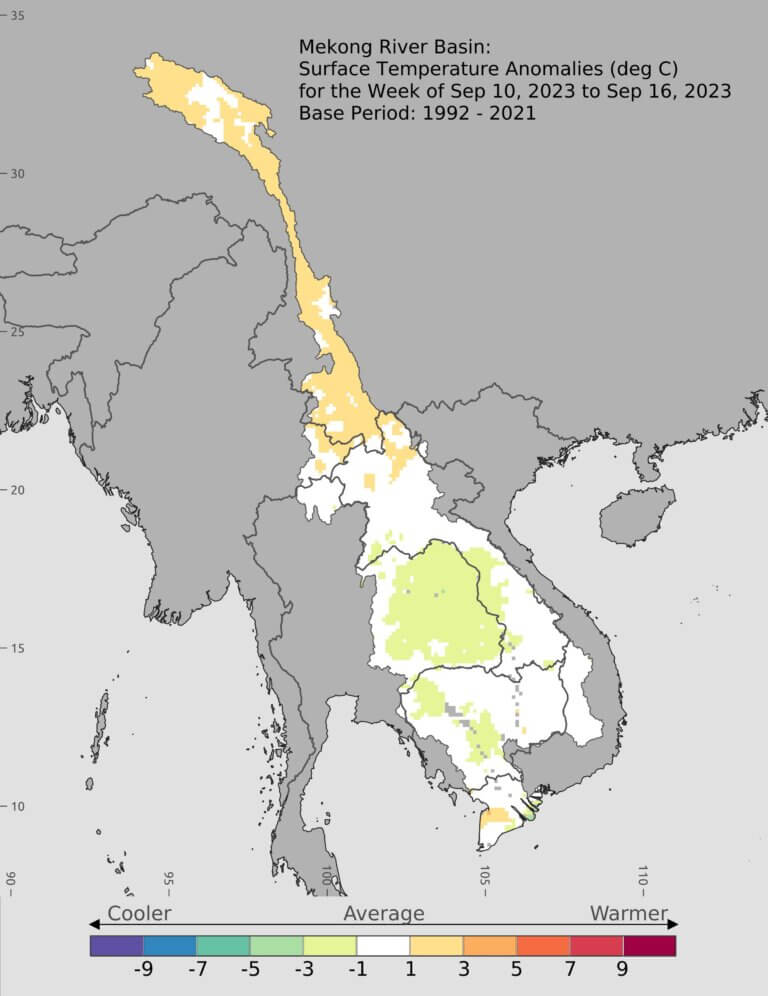
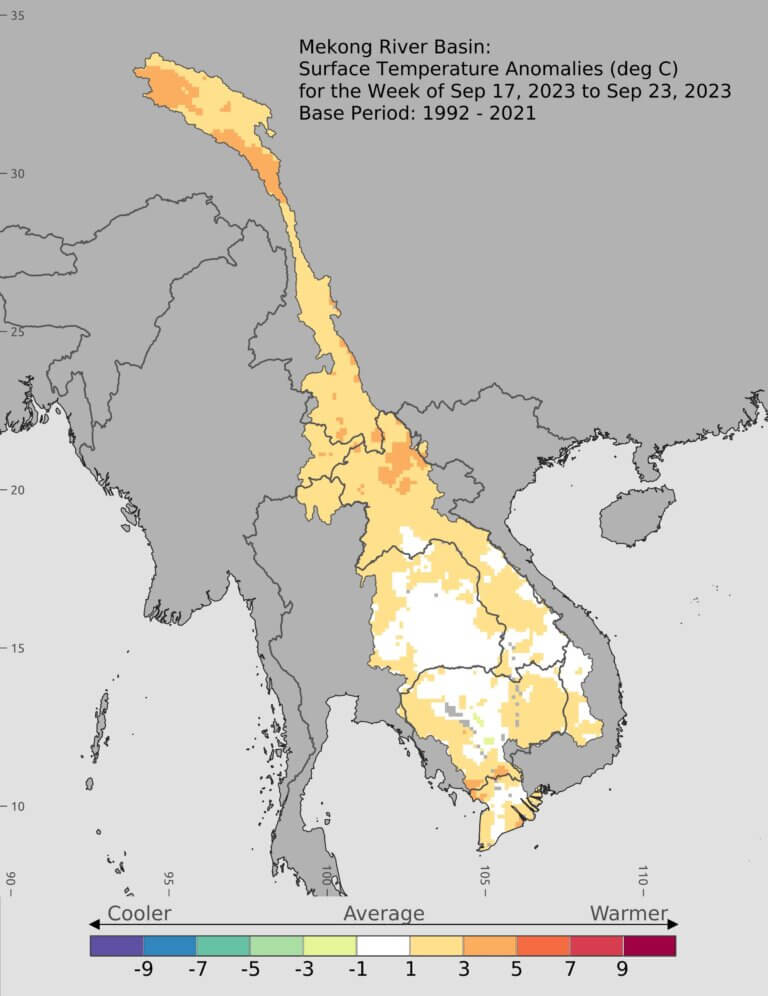
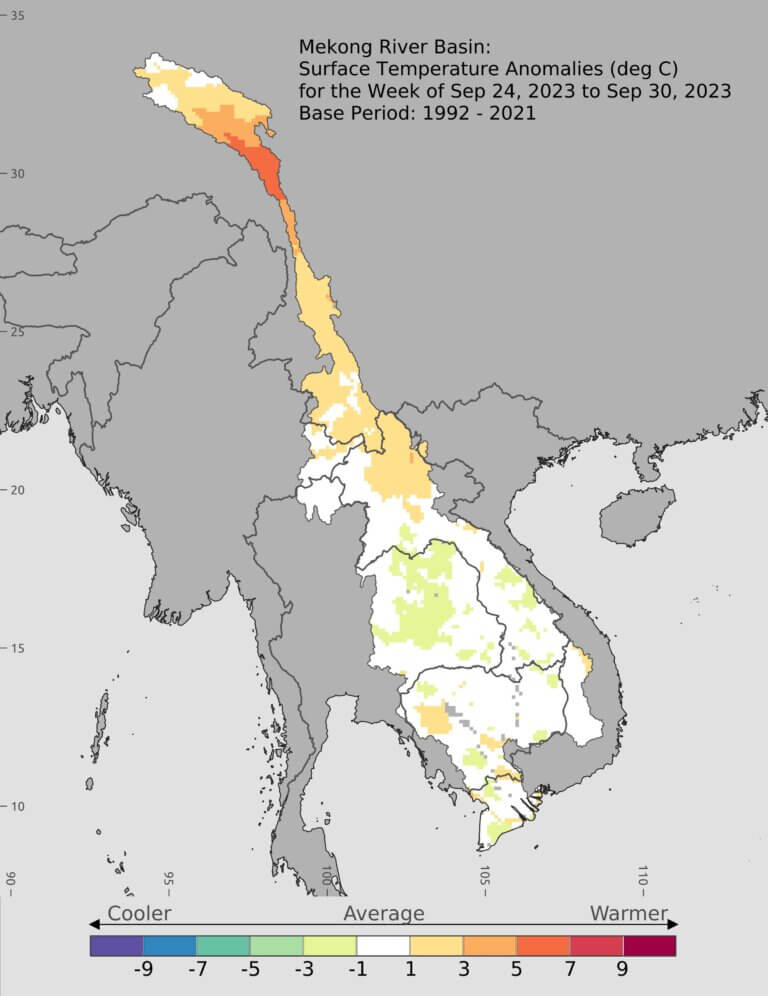
Figure 9 provides more insight into surface wetness conditions throughout the six-month wet season period. The traditional early monsoon is well known to send water throughout the entirety of the Mekong Basin and lasts from June to October. This happens as temperatures rise in the Himalayas and pull moisture from the Indian Ocean up over the combined landmass of South and Southeast Asia. In the Mekong, a second easterly monsoon pattern is also traditionally observed in late August through November as tropical depressions and typhoons originating in the Pacific Ocean send precipitation over mainland Southeast Asia in an east-west direction. 2024’s Typhoon Yagi is an example of this pattern.
Figure 9: How Wet was the 2023 Wet Season?
Use the arrows to navigate through all the maps
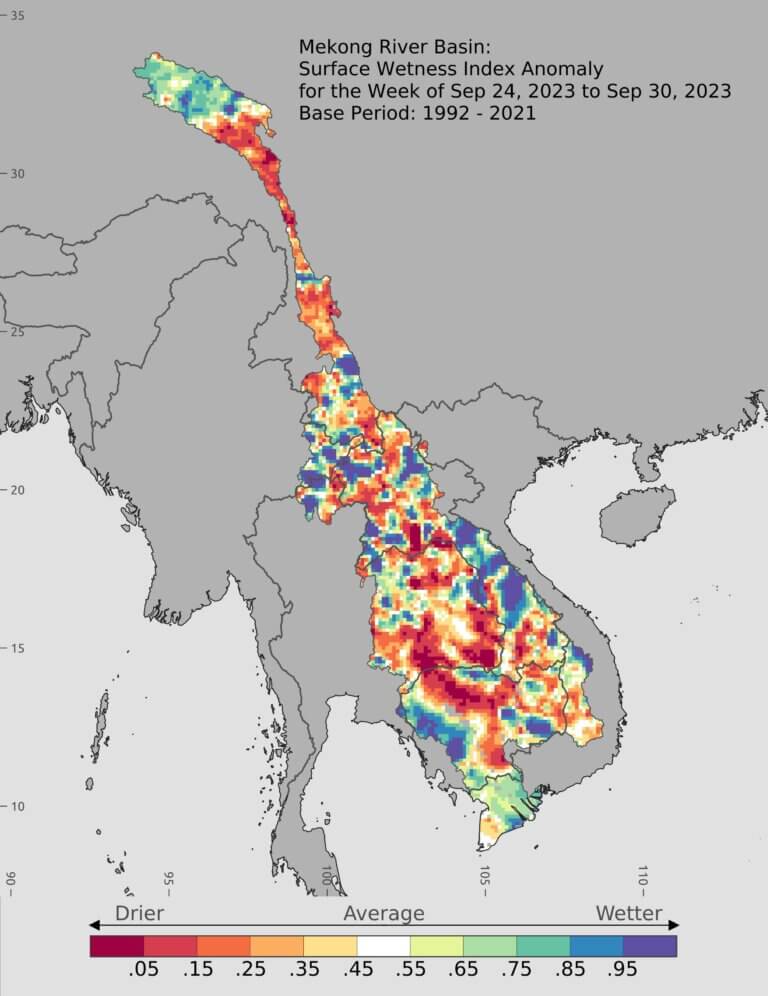
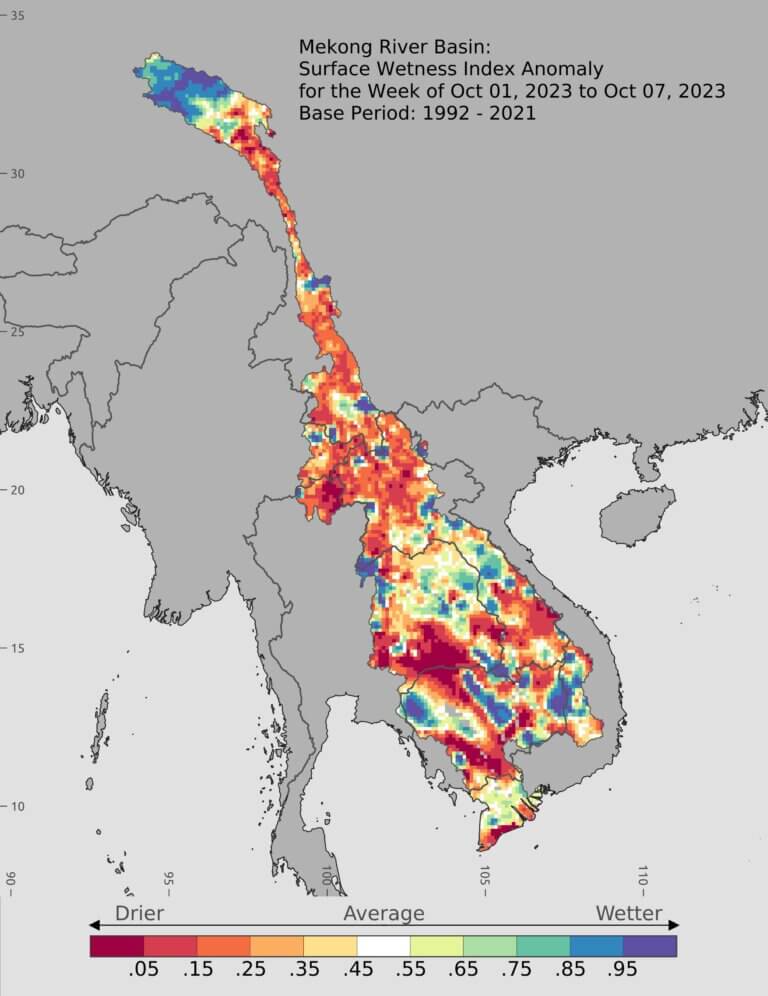
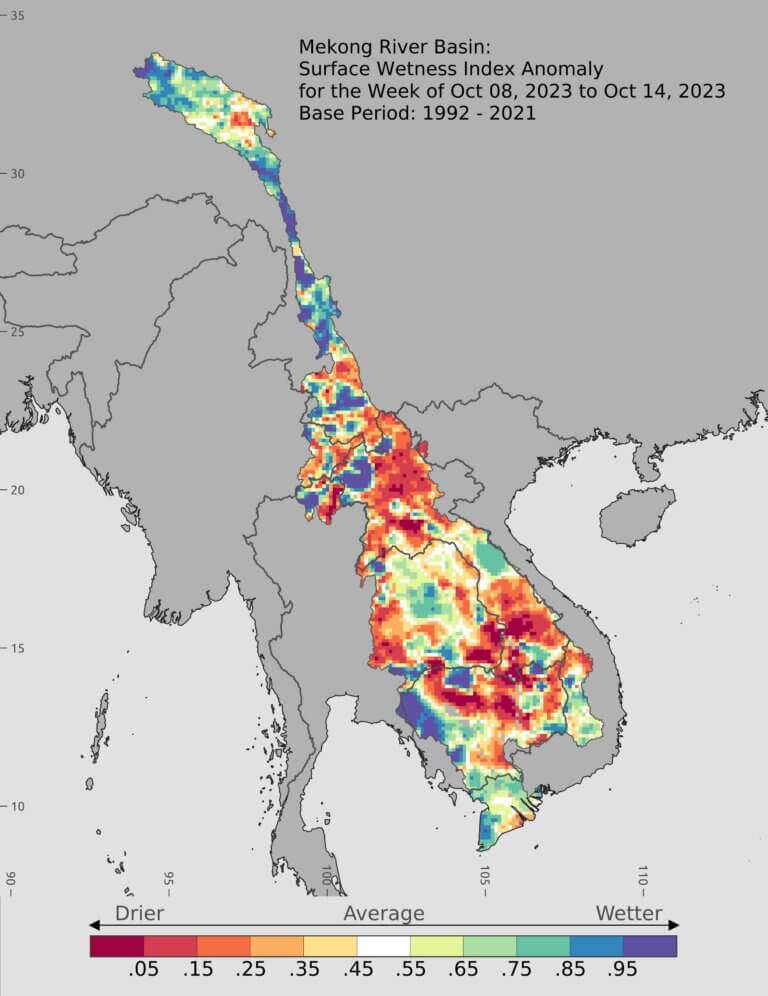
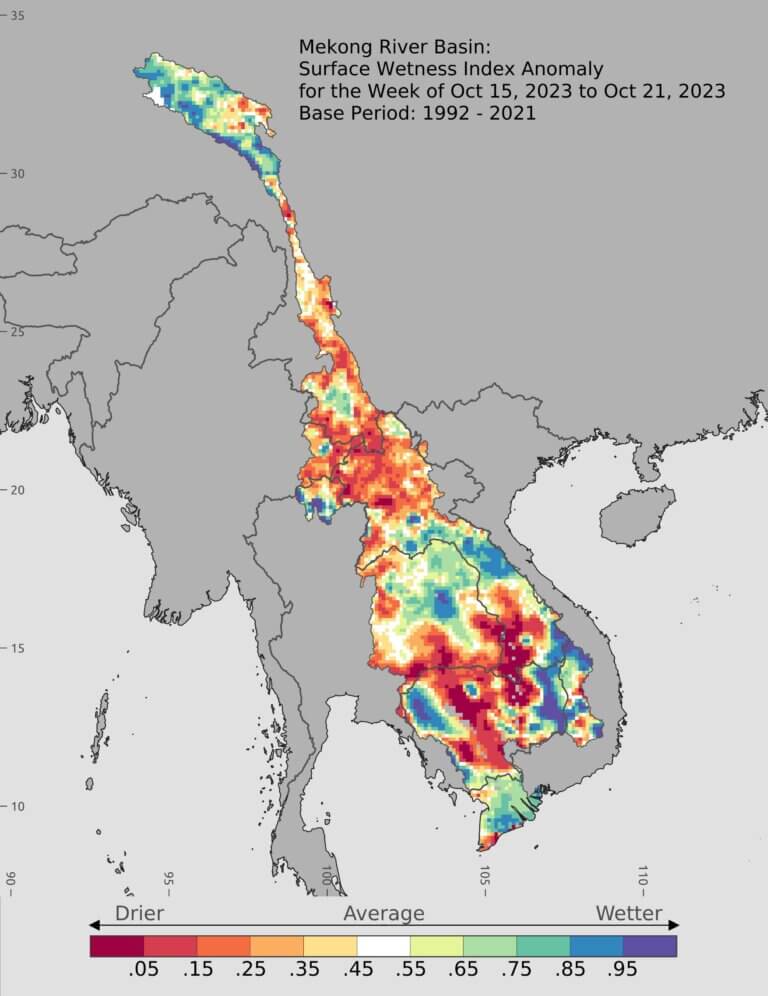
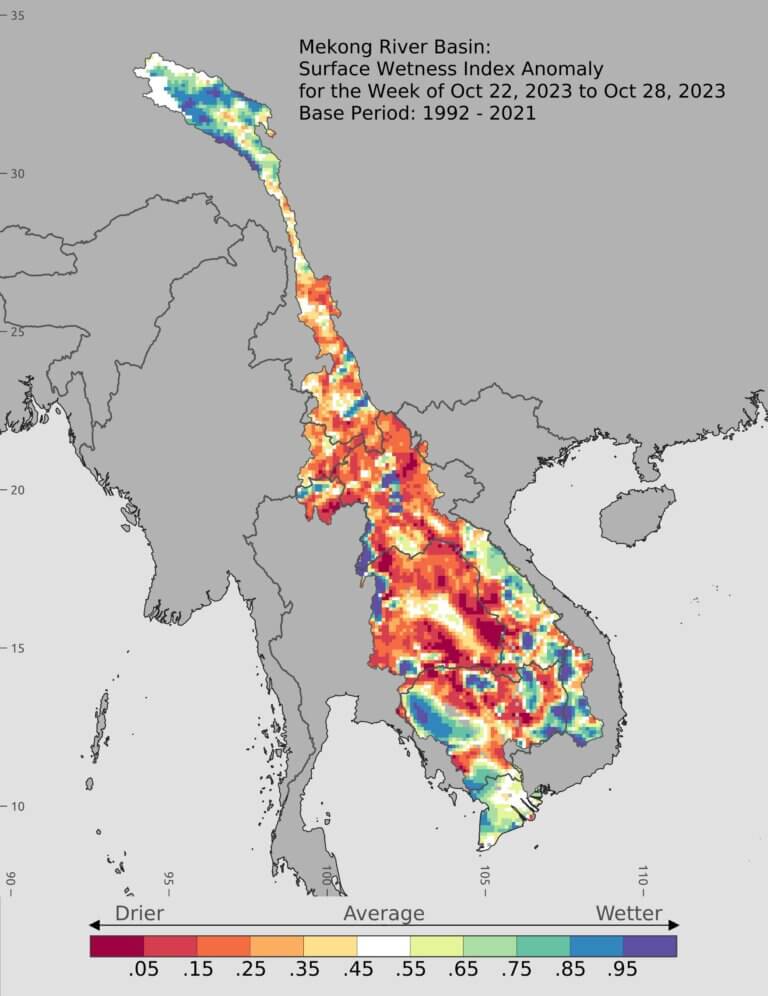
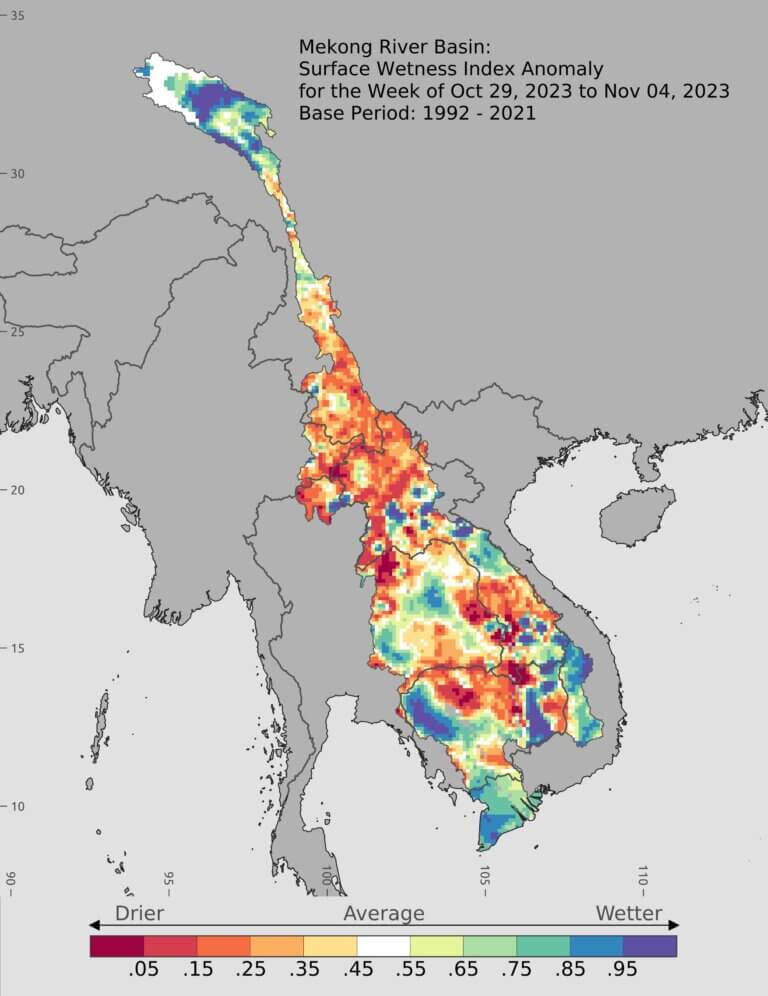
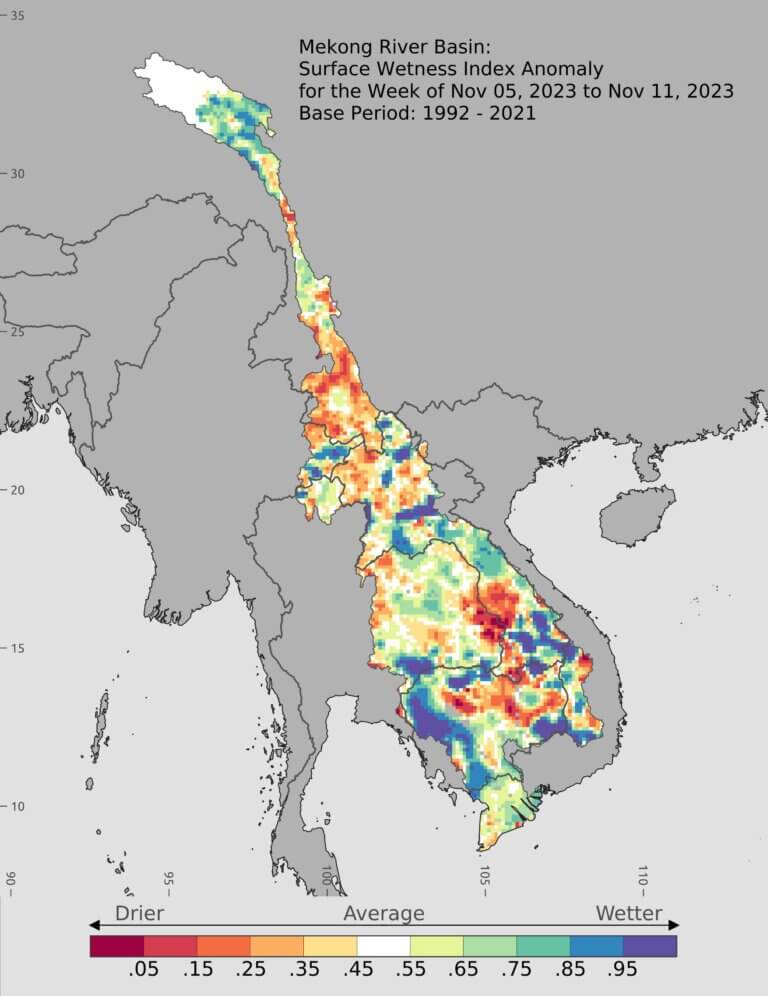
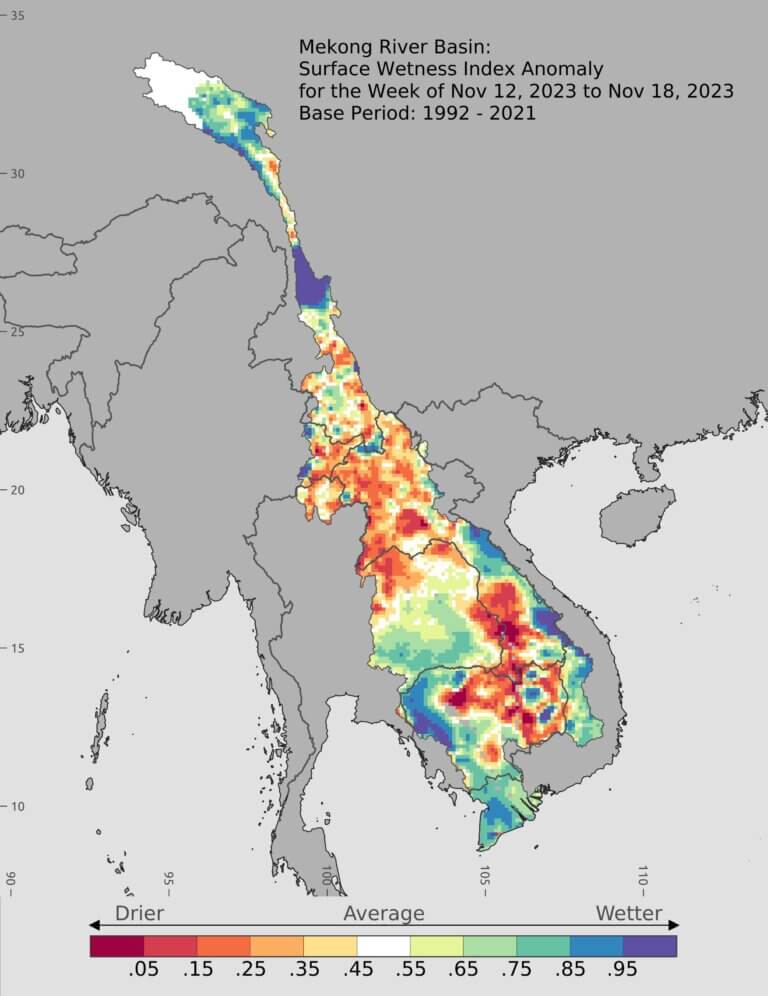

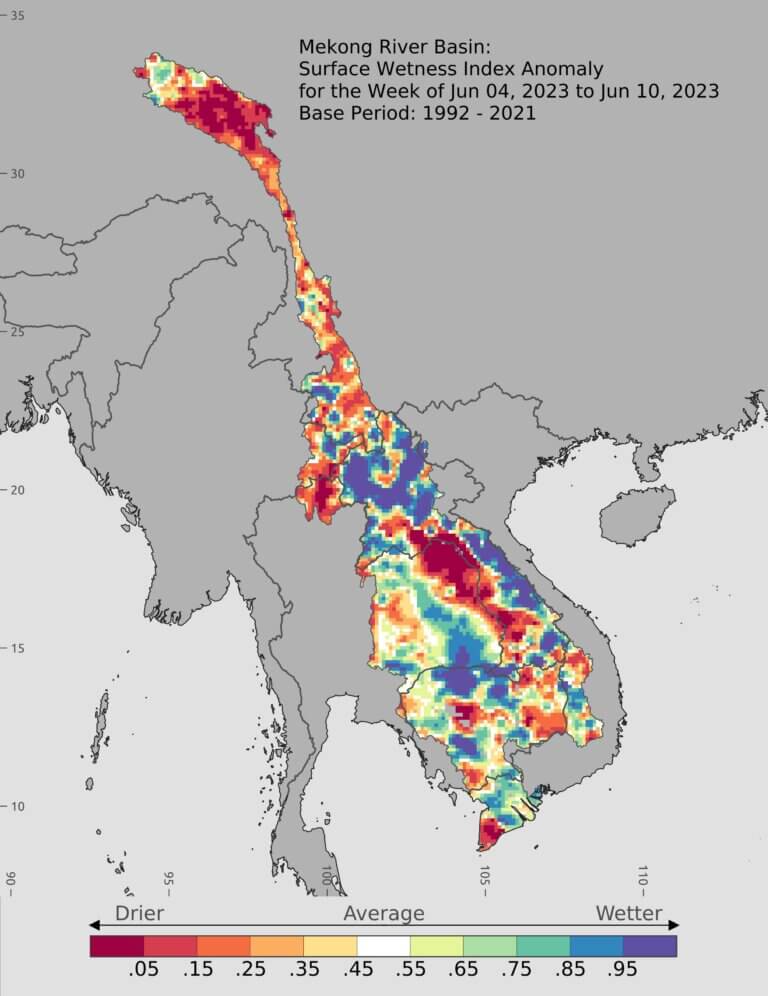
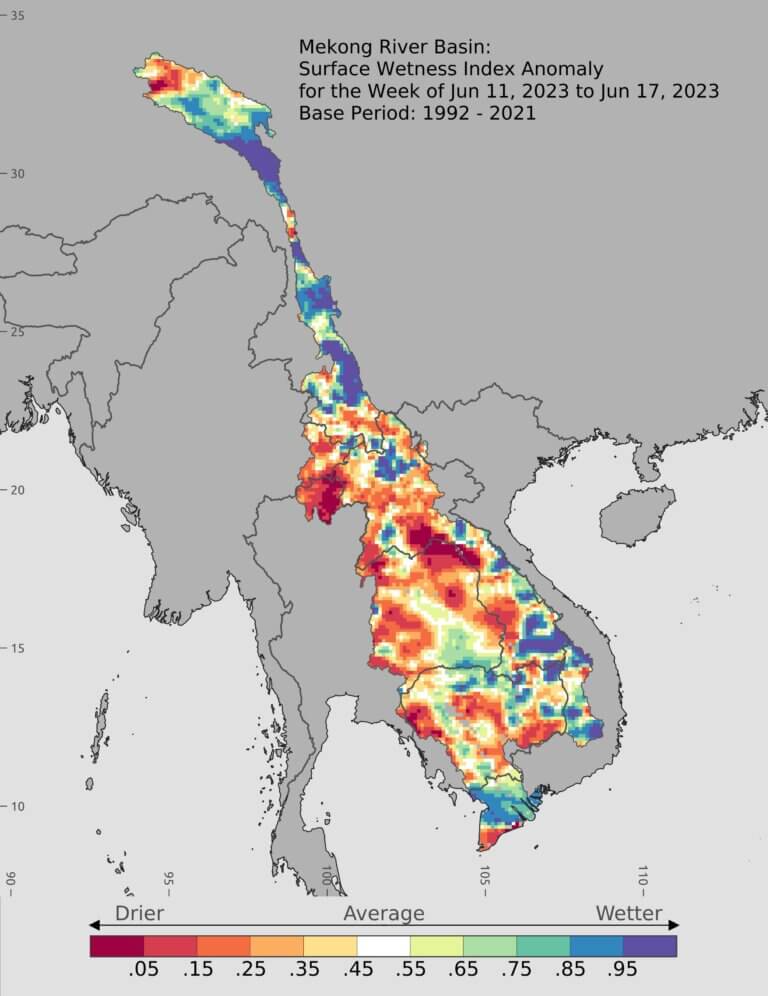
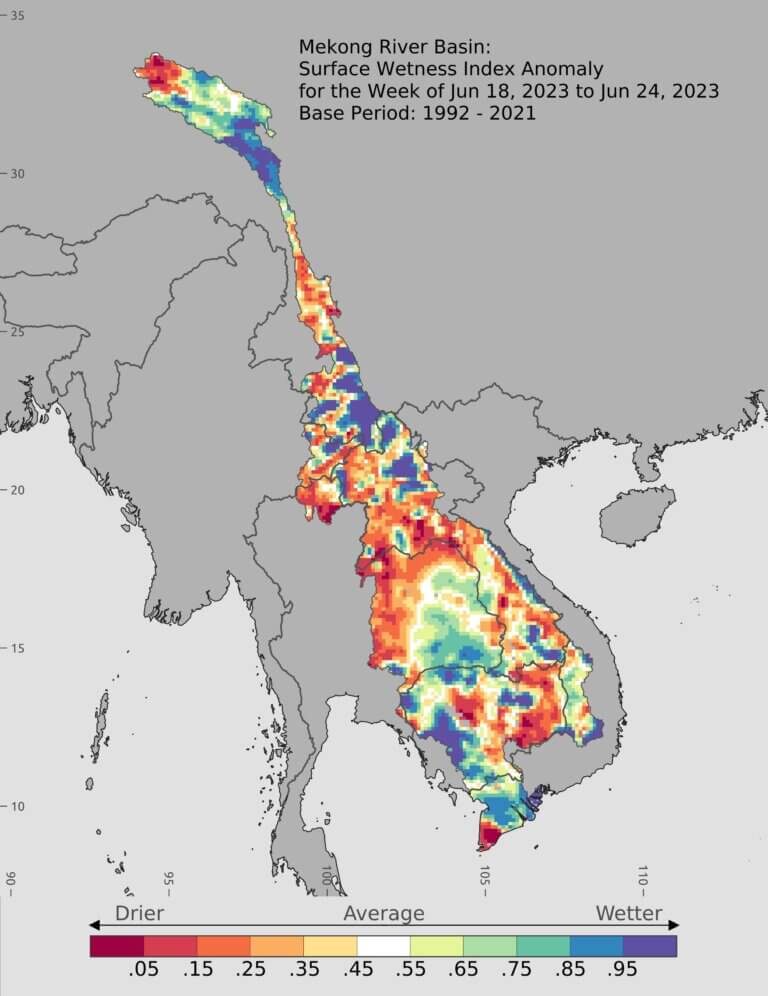
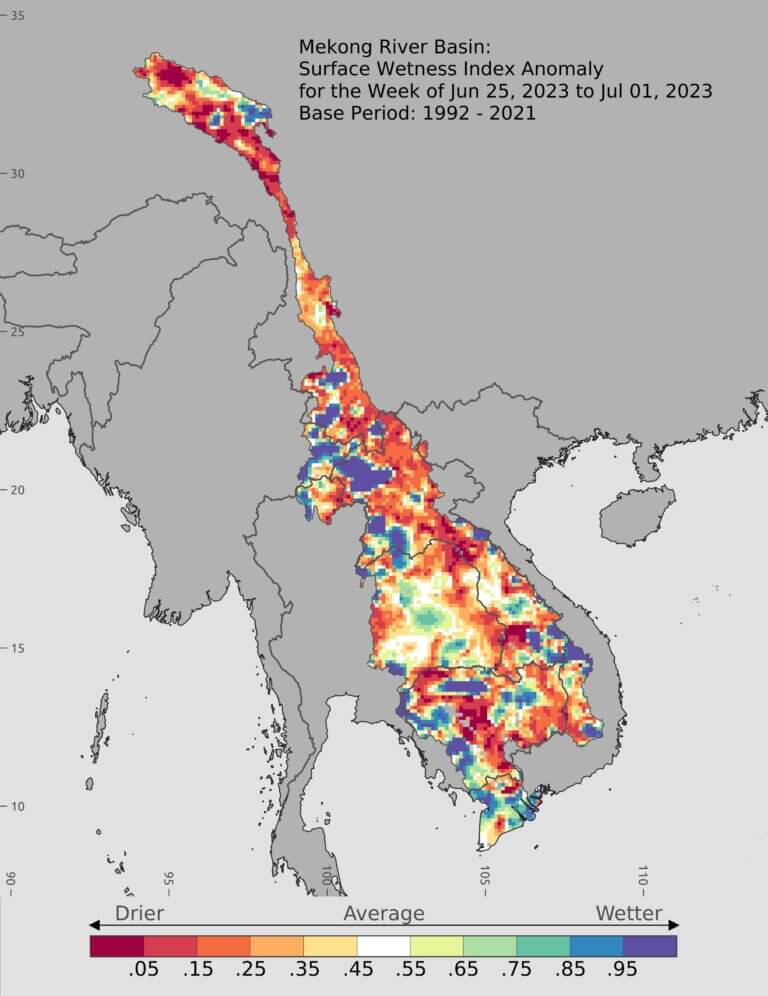
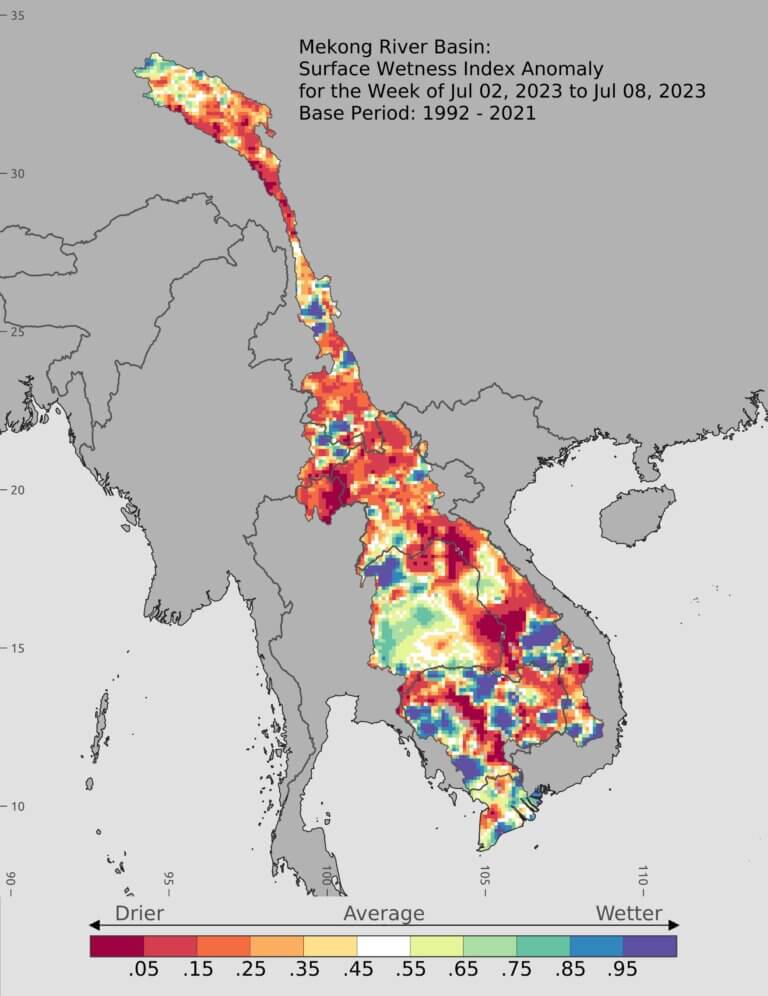
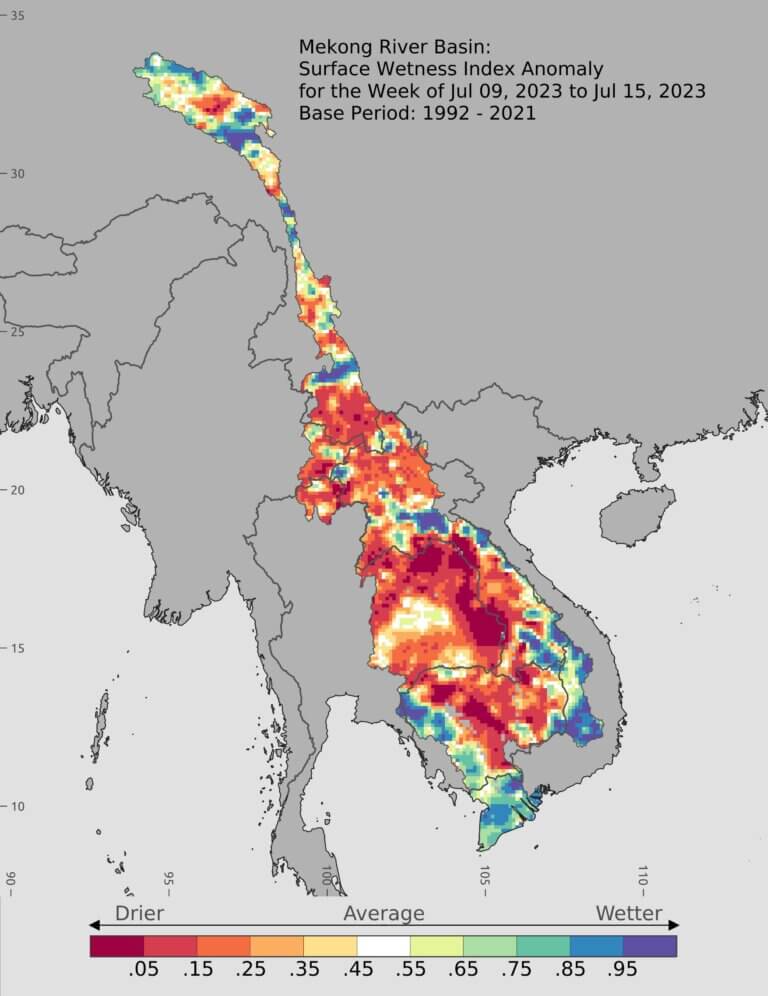
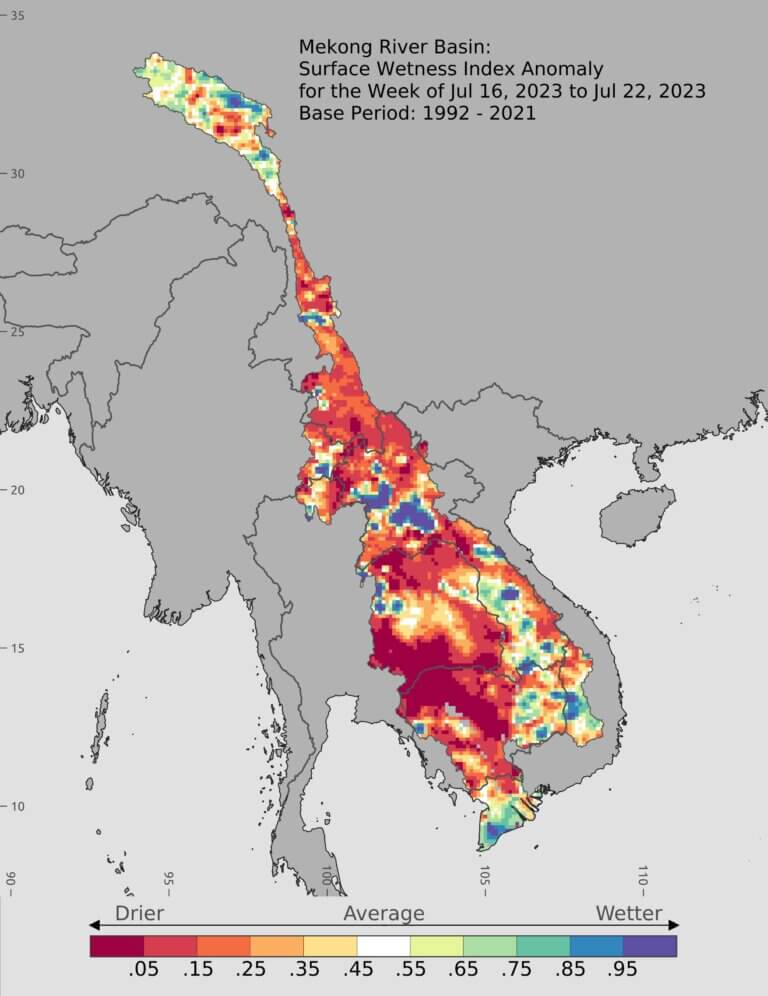
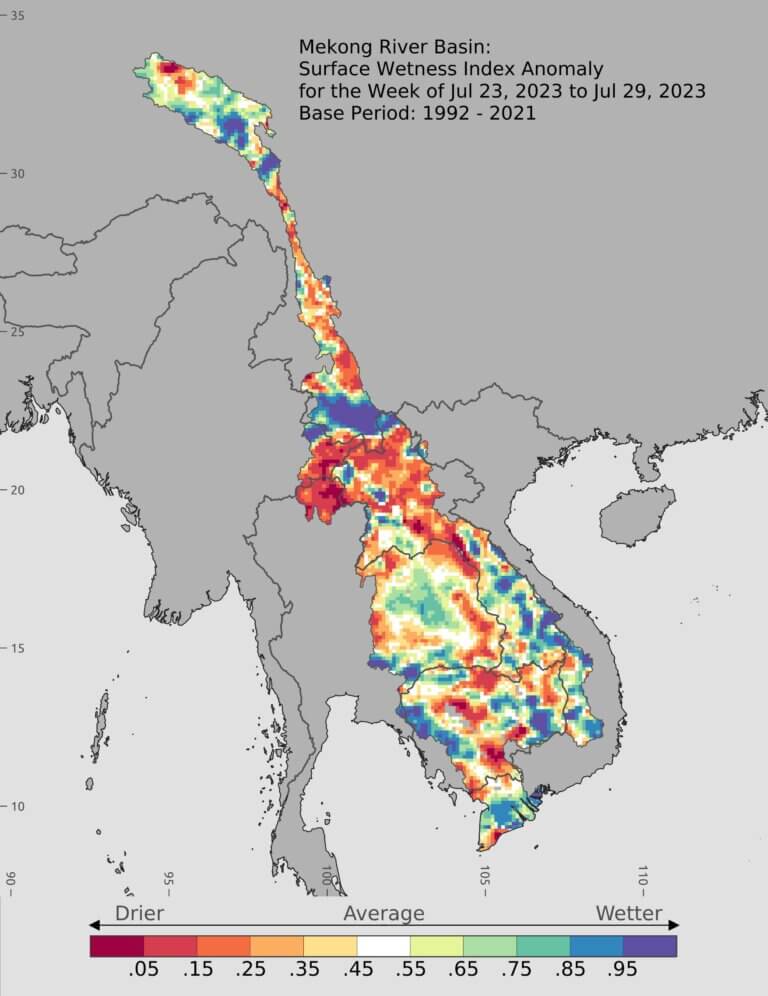
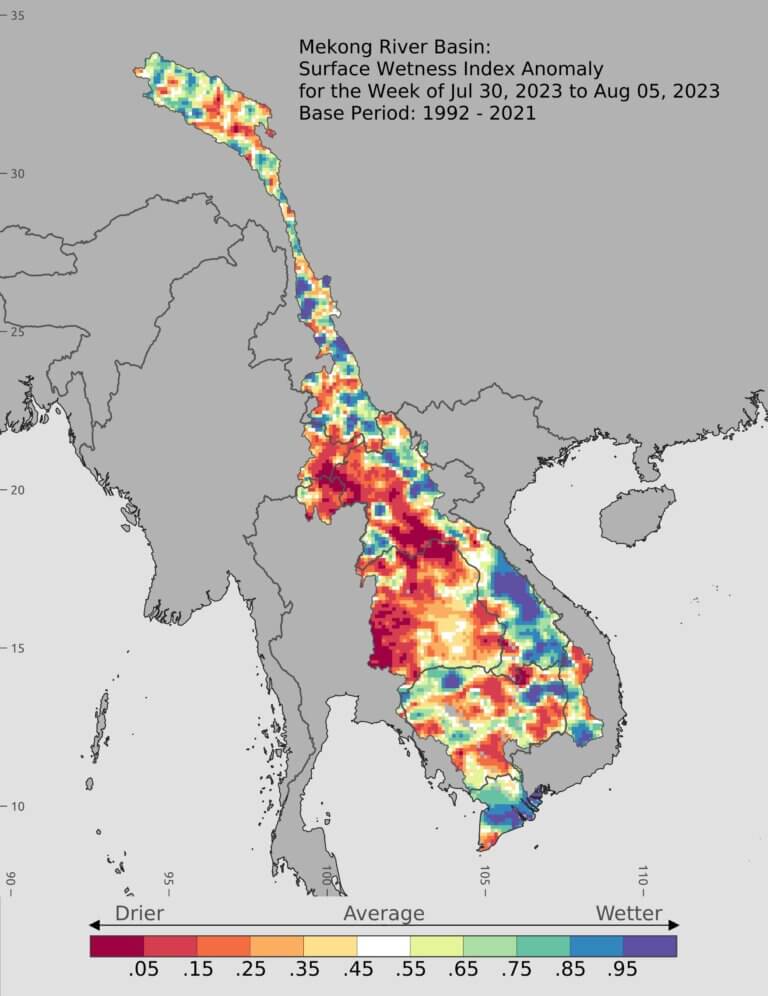
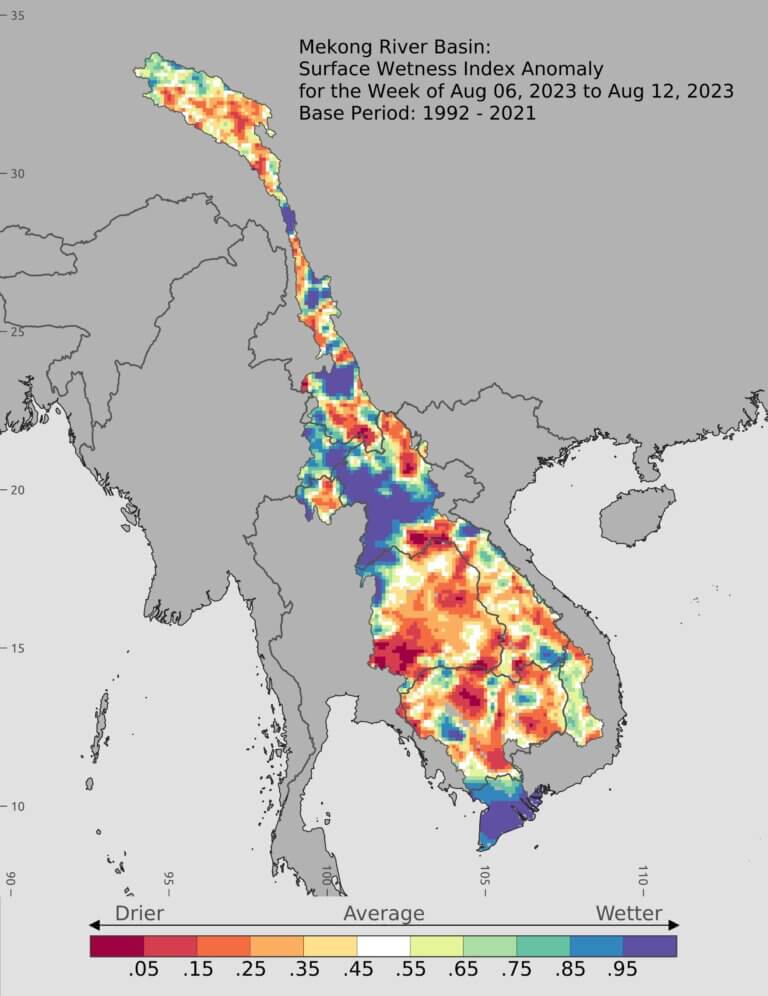
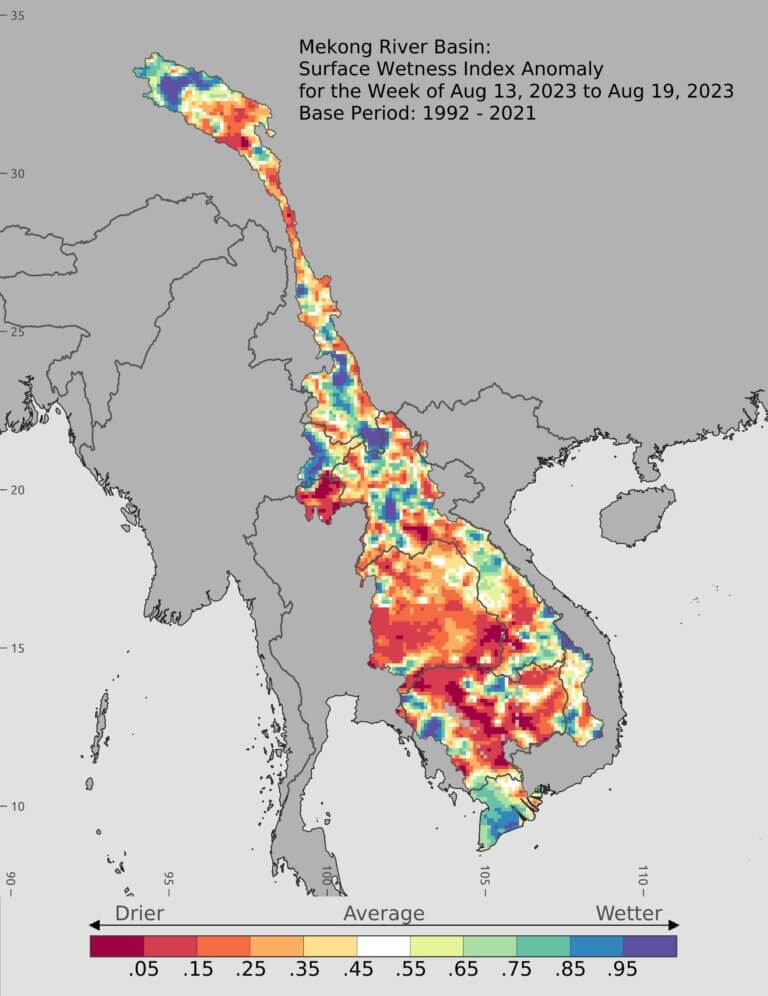
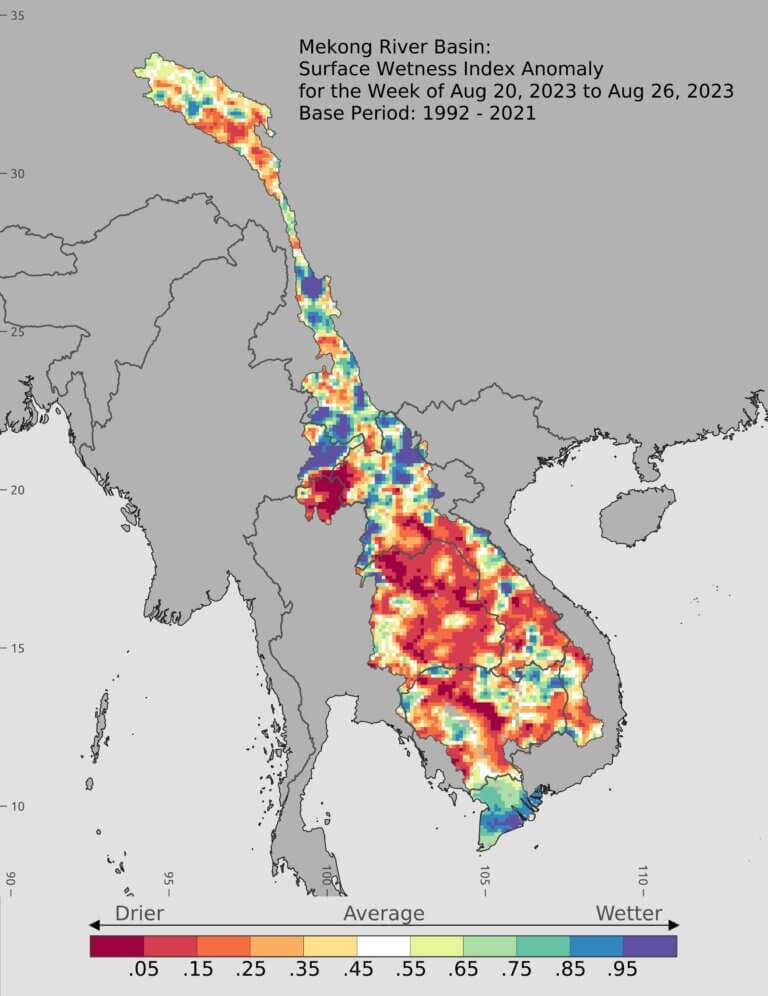
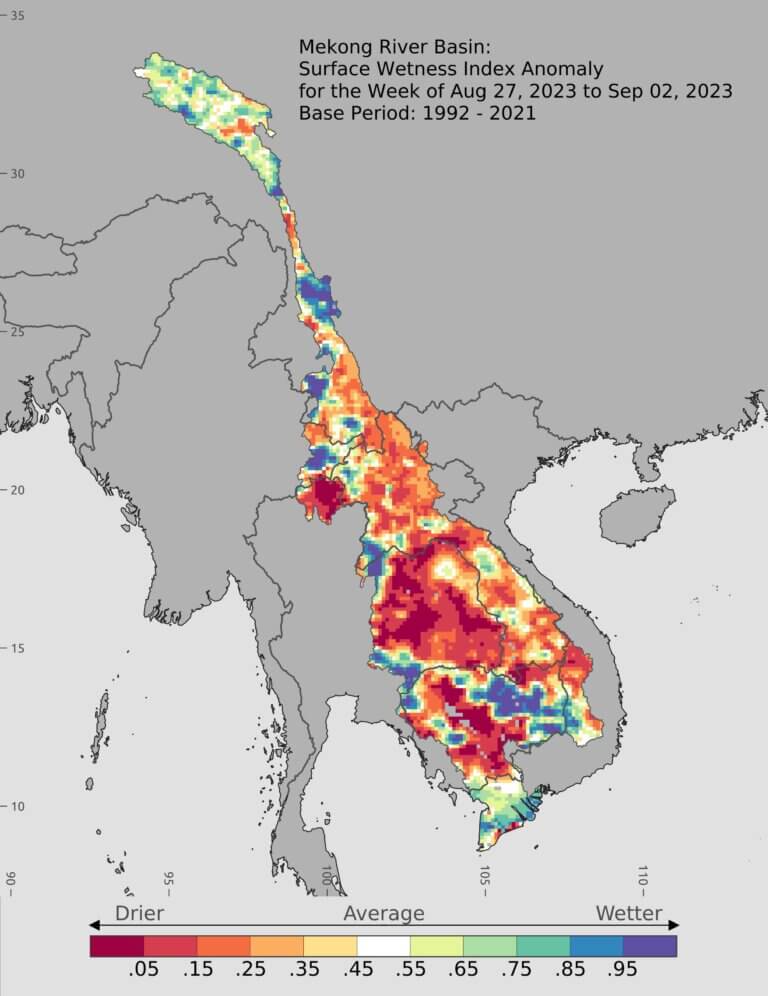
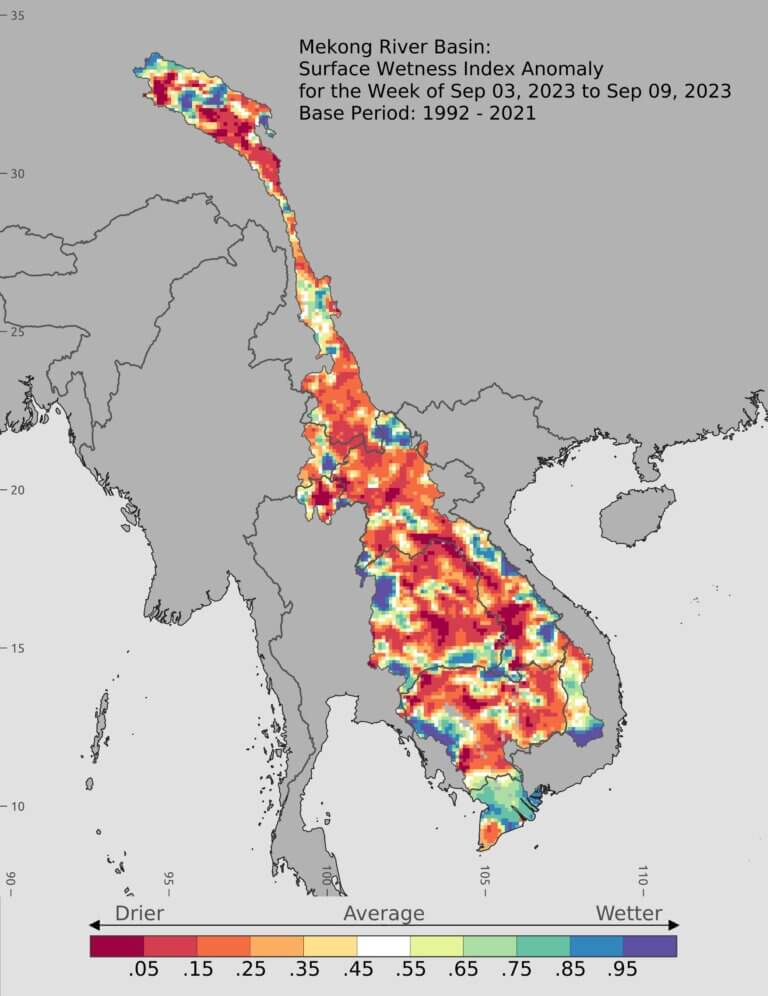
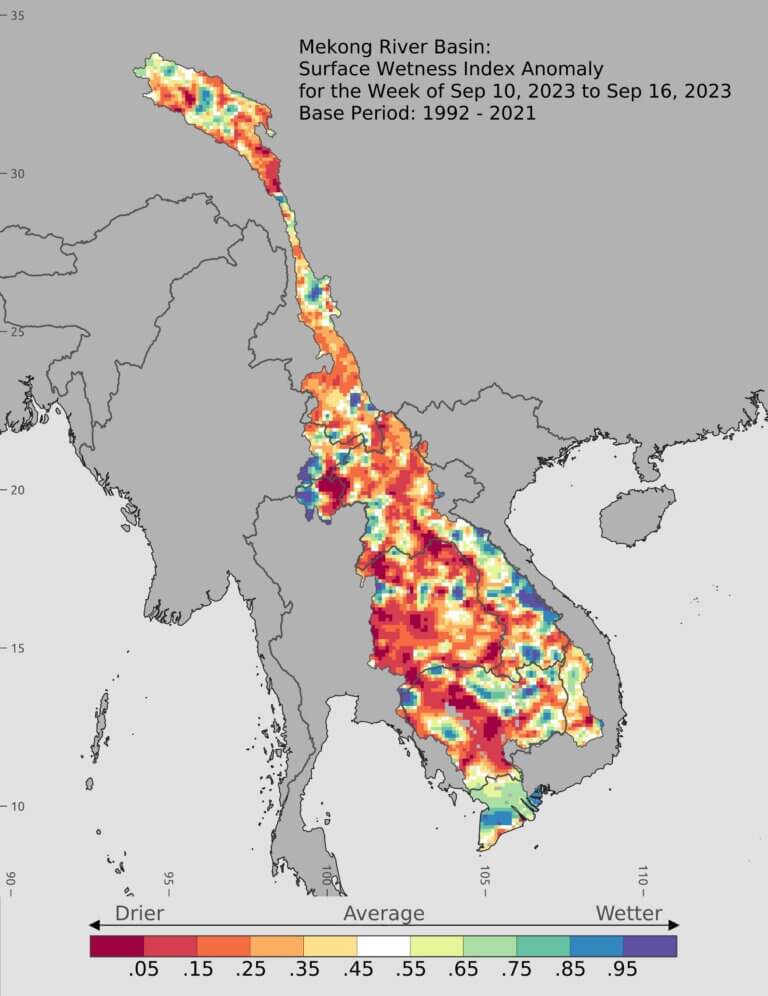
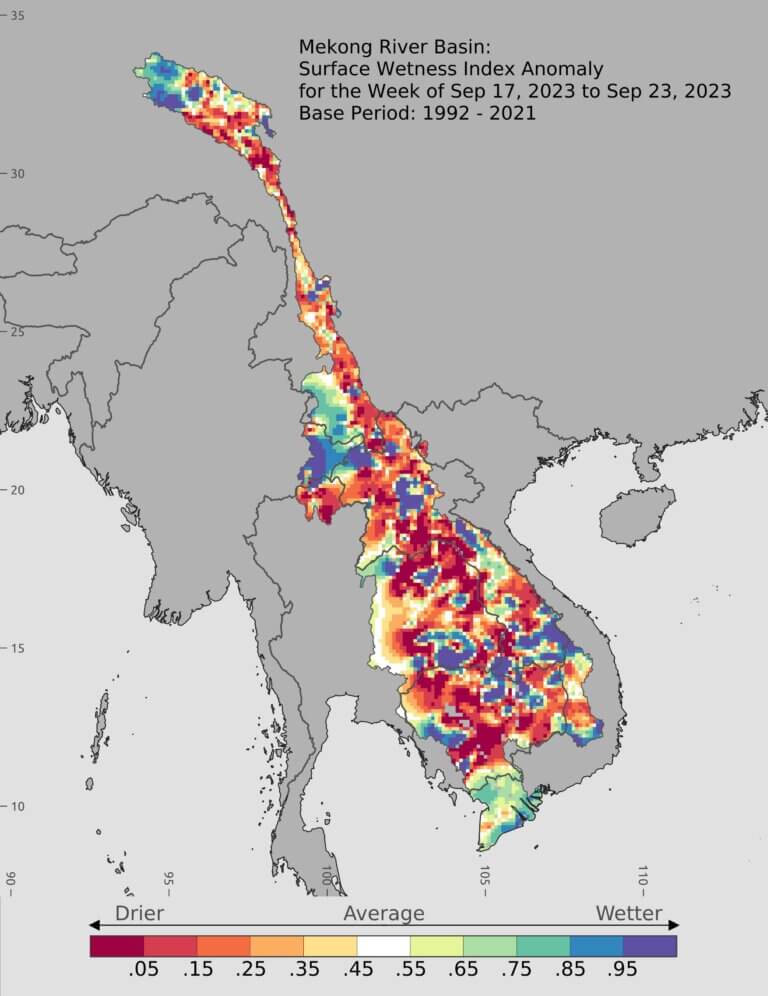
Figure 9 shows a general pattern of extreme dryness (orange and red) throughout most of the basin from June to October. The extreme dryness was alleviated from October into the later months of 2023. For China’s portion of the basin, where the largest dams are located, extreme dryness is observed consistently from June to July, suggesting water availability for filling reservoirs was low during this period. The Lower Mekong provides a mixed picture: extreme wetness in the form of monsoon storms was observed from June to August in some parts of the Lower Mekong. In the downstream, conditions were not very wet during the period of the missing middle (August-September) but were not as dry as what China experienced. Then in the latter months of the year, particularly from October to December, easterly weather patterns alleviated much of the extreme wet season drought conditions observed in previous months.
From these observations, it is possible to infer that natural Mekong flow conditions out of China would likely be lower than normal through the first months of the wet season alongside a mixed bag of flow contributions from tributaries in the downstream with lower-than-normal contributions during the middle months of the wet season.
How did dams operate during the wet season?
Given these conditions, how did dams operate in the basin? Our past work has done much to establish where the largest hydropower dams are and how much active storage (usable water) they can possibly hold. Our analysis has established that the largest dams tend to operate in a manner where they restrict wet season river flow and then release all or most of that restricted flow in the subsequent dry season for hydropower production. Across the 2023 dry season we generally observed that the largest dams – which are located in the upstream of the basin in the areas which experienced the driest and hottest wet season conditions – restricted much less flow and recharged their reservoirs to abnormally low levels compared to previous years.
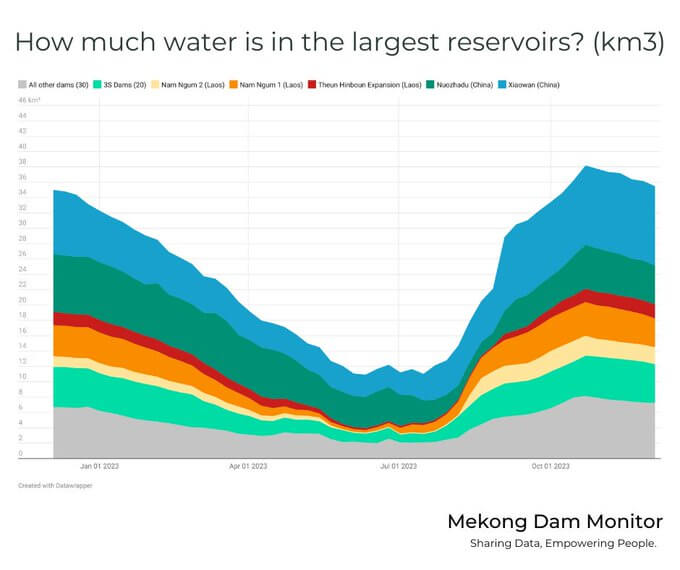
Figure 10: How Much Did Dams Fill During the 2022 and 2023 Wet Seasons?
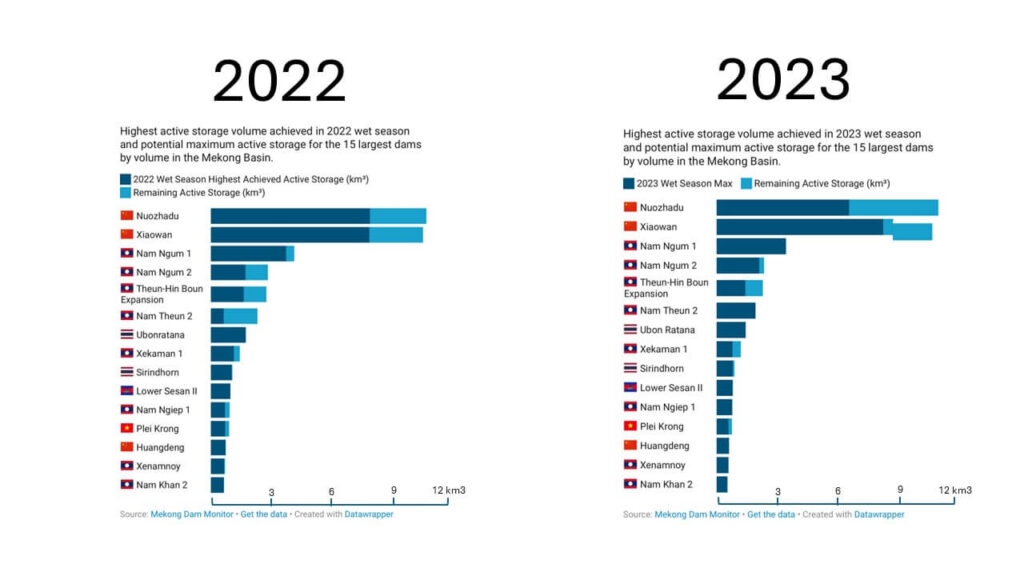
Figure 10 offers a comparison of the highest active storage volumes achieved in 2022 and 2023 respectively. In 2023, Nuozhadu, the largest dam which can hold more than 11 billion cubic meters of active storage, only achieved about 50% of its active storage capacity – even less than the previous year when it only achieved 75% of its active storage capacity. The Xiaowan Dam achieved a similar level as 2022. China’s upstream also experienced a relatively dry wet season. In contrast, the larger dams in Laos (Nam Ngum 1, Nam Ngum 2, Theun Hinboun Expansion, and the Nam Theun 2) did achieve higher storage levels in 2023 than in 2022.
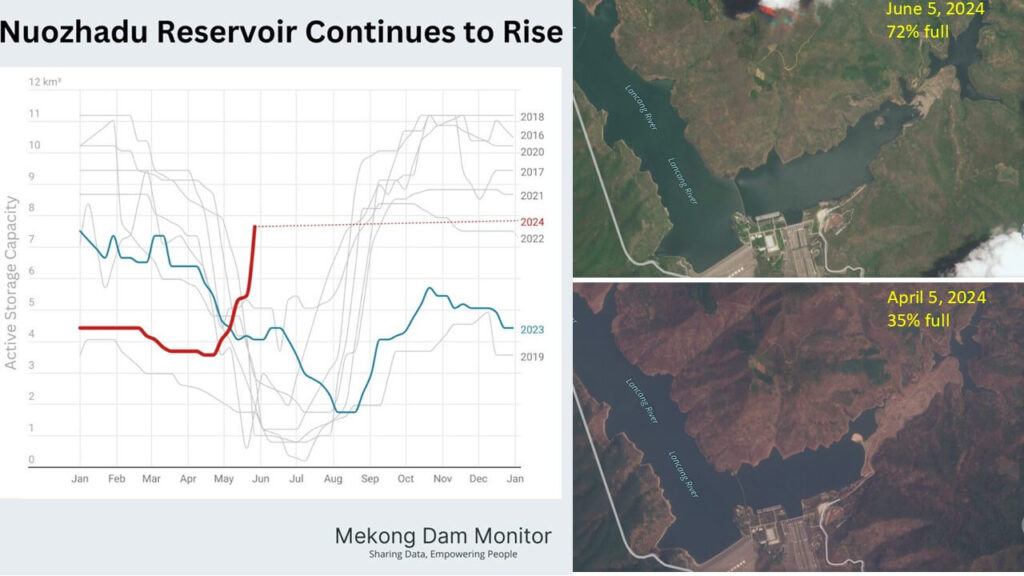
In November of 2023, we ran the spotlight image in Figure 11 showing optical imagery of the peak reservoir levels at Nuozhadu, the Mekong’s largest dam, over the past four years. Only in 2020 did the reservoir come close to filling to its full capacity, suggesting suboptimal weather conditions (a lack of rain) in China in subsequent years were causing the dam to underperform. Nuozhadu is only in its 12th year of operation and has underperformed for several years in a row, which raises the question of whether investments in such a large dam can meet long-term expectations given extreme climate variability.
Figure 11: Nuozhadu is Not Filling to Capacity
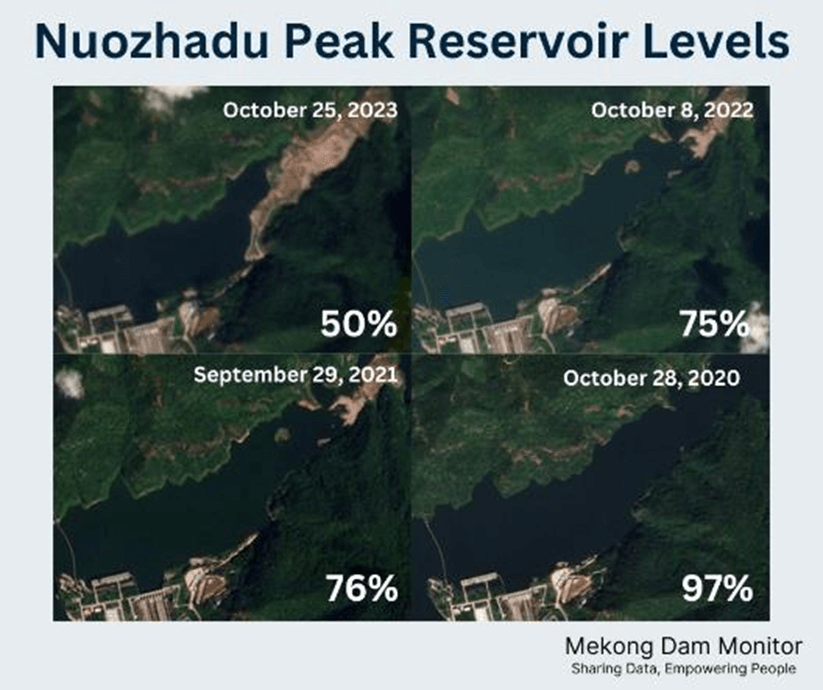
Figure 10 focuses on the total quantity of flow restrictions captured by the largest dams in the Mekong across the six months of the 2023 wet season. The sections below unpack analysis of flow restrictions to shed light on how these dams operated over time and affected key features of the Mekong such as the Mekong Floodpulse and Tonle Sap Expansion. For now, this section continues analysis on the relationship between climate and dam operations during the wet season by comparing some historical data.
For the past three years, in our seasonal Where’s the Water webinars, we have pointed to poor wet season conditions in China’s portion of the Mekong and have posited that the overall monsoon climate pattern may be transitioning toward a weakened monsoon over Yunnan and the eastern Himalaya. Data on China’s dam operations from 2018 to the present suggests an emerging trend that consistently dry wet seasons are leading to lower reservoir levels at the end of recent Mekong dry seasons.
Figure 12: Drought is Causing China’s Dams to Fill to Lower Levels
China’s dams have the capacity to hold about 50% of the active storage of all dams in the Mekong, but in recent years they have not come close to reaching their full capacity. Figure 12 shows how combined end-of-wet-season reservoir levels for the 11-dam cascade in China began to decline starting in 2021, very likely due to poor water availability conditions. Generally, reservoir levels of Xiaowan (red) and the other 9 dams (yellow) hit similar storage levels each year, but Nuozhadu (blue) underperforms overtime. This translates into lower levels of hydropower production in China and suboptimal use of China’s 11 dam cascade.
This relationship is demonstrated on a weekly basis in Figure 13 which shows how the entire cascade operates over time. In recent years not only have the largest dams in the system not filled to their capacity, but they have also not released all of their water for hydropower in the dry season. Notice how the valleys of 2022, 2023, and 2024 are much higher than what was observed in 2019, 2020, and 2021. One other observation from Figure 13 is just how small the storage capacities of China’s other dams are compared to Nuozhadu and Xiaowan. The third largest in the cascade, Huangdeng, is multiple times smaller than Nuozhadu or Xiaowan, and the remaining eight barely show up on the charts. Thus, when talking about China’s dams on the Mekong, most focus really should be placed on how Xiaowan and Nuozhadu are operating since those two dams deliver the largest impacts downstream.
Figure 13: China’s Lancang Cascade (11 dams) active storage from 2019-2024
Relationship Between Precipitation, Dam Restrictions and Releases
These findings establish a relationship between causal climate factors such as wetness and precipitation and resulting outcomes such as the ability of dams to fill their reservoirs. One could hypothesize that if low precipitation is forecasted for a coming wet season, then it is likely that reservoirs will store less water and be able to generate less electricity. In the Mekong, large storage dams like Nuozhadu and Xiaowan produce the most hydropower during the dry season. Logically, dry season hydropower production is dependent on storage levels achieved during the previous wet season, and those storage levels are dependent on wet season climate factors.
From here, we can establish a reciprocal relationship between wet season storage levels and dry season releases, both of which are dependent on wet season climate factors. Do these relationships appear in the data? Figure 14 sheds light on this question.
Figure 14: How Do Climate Conditions Determine Dam Operations?
Figure 14 compares net dam restrictions observed during each wet season from 2017 to 2023 for all of China’s dams to their observed releases in the following dry season. In most cases restrictions roughly equal subsequent releases, with the exception of 2021 and 2023. It appears that some of the releases in the 2022 column were taken from leftover 2021 wet season. Restrictions in some years are higher than other years, and this roughly corresponds to the varying height of a natural flow estimate for total wet season discharge at the Chiang Saen gauge. This natural flow estimate is calculated by adding the wet season restrictions onto observed flow values provided by the MRC and provides insight into how the river would run under natural conditions.
More rainfall drives higher natural flow values, and the converse is true for low natural flow values. So when natural flow values are high, restrictions tend to be high as in the case of 2017 and 2018. Flow since 2019 has been relatively low, and in turn dam restrictions in 2019, 2022, and 2023 were relatively low. 2020 and 2021 offer cases for consideration of significant impact: both were relatively dry wet seasons yet dam restrictions in 2020 mirrored those of 2017 and 2018, which were higher flow years. 2021 restrictions were lower, but still in the same ballpark.
Figure 15 (yellow row) shows the portion of natural flow that was restricted behind China’s reservoirs during each year’s respective dry season. 2022 and 2023 had the lowest nominal restrictions and also resulted in the lowest reductions of natural flow of 18.67% and 23.47% respectively. Thus in recent years natural flow has been low, but at least the proportion of negative impact to flow at Chiang Saen was not as high as 2019 (37.21%), 2020 (39.78%), or 2021 (34.46%) – each of which was a relatively low natural flow year.
Figure 15: Climate Conditions and Dam Operations By the Numbers
This finding establishes that dam operations have the potential to be proportionally more impactful in reducing flow in years when wet seasons are particularly dry. To be sure, an 18.67% reduction in flow to the Chiang Saen gauge in 2022 is still significant and not desirable when it comes to downstream water availability needs, but it is a more desirable outcome than the much larger proportional flow reductions observed in 2019, 2020, and 2021.
This data also suggests that China’s dams are becoming relatively less impactful. Whether this is a developing trend in response to increased calls for smarter dam management from downstream stakeholders or simply an observation for 2022 and 2023 is currently unknown. Yet with this kind of analysis in hand, actors across the Mekong could work toward more desirable dam operations and flow management targets that could avoid the worst outcomes in future years.
This kind of time series analysis cannot yet be performed on dam impacts across the entire basin at a downstream gauge like Stung Treng, because we have yet to develop complete data sets for dam operations throughout the entirety of Mekong for earlier years. The best we can do is a similar analysis starting in 2022 and 2023 in Figure 16 which shows the reciprocal relationship between wet season restrictions and dry season releases. However, the climate relationship is inconclusive. In 2022 and 2023, we estimate that dam restrictions reduced wet season natural flow to Stung Treng by 5.72% and by 8.17% respectively.
Figure 16: Data is Still Insufficient to Extend This Analysis Downstream
Sections below explore how during certain months of these wet seasons, flow restrictions were proportionally much higher. The maximum observed monthly natural flow reduction from upstream dams to Stung Treng, Cambodia was in September 2021 with a 17.4% flow reduction. No small number!
Back to the Missing Middle
Figure 17: Adding A Natural Flow Estimate to the Missing Middle
By applying the findings and logic above, Figure 17 shows that the 2023 wet season’s missing middle resulted from a combination of low precipitation and dam restrictions. Figure 17 shows weekly values for observed flow (red) and historical means. When a lagged estimation of all upstream dam restrictions is added to the observed values, we can get a sense of how the river would have flowed under natural conditions (orange). Clearly, there is an observable climate effect and a lack of precipitation: in nearly all of July and some of August, natural flow was below the normal band. From mid-August to early September, the natural flow line (orange) diverges from the rising mean line and trends downward. So a lack of precipitation was partially responsible for the missing middle.
However, most of the downward trend for August and September under natural conditions (except the second and third week of September) falls within the normal band. Thus, from early August to the end of the wet season, the river would have flowed mostly within its normal historical bounds. The impacts of dams changed this more favorable outcome by dropping natural flow to below historical levels for the end of August through the end of September. Under natural conditions, the peak observed in August (22.3 km3 on August 13) would have been slightly above the pre-dam mean, yet dams reduced that peak by 18% to 18.8 km3. Observed flow (red) which includes the negative impacts of dams did not exceed the mean historical levels until the first week of October.
So, to conclude, 2023’s missing middle was caused in part by a lack of rainfall, but dam restrictions upstream reduce flow to levels outside of the normal range for longer than natural flow conditions would have created and did much to dampen the floodpulse. Further, one could posit that if the above-normal conditions from mid-October to early November (orange line) were forecasted by an entity like the MRC, then dam operators could have waited until October-November to restrict flow. Instead, dam operators restricted flow in August and September and gutted the energy of the floodpulse. In conclusion, a more coordinated approach could have resulted in a more optimal set of ecological outcomes downstream.
To see how various groupings of dams impacted flow at five gauges from Chiang Saen, Thailand to Stung Treng, Cambodia at a monthly view scroll through this interactive feature below.
Wet Season Five Gauges
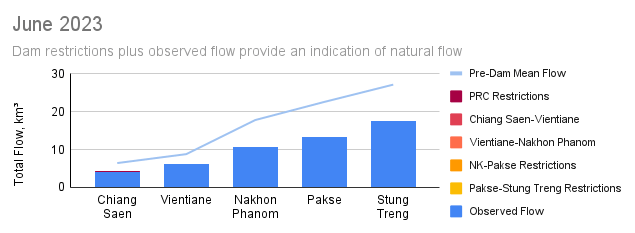
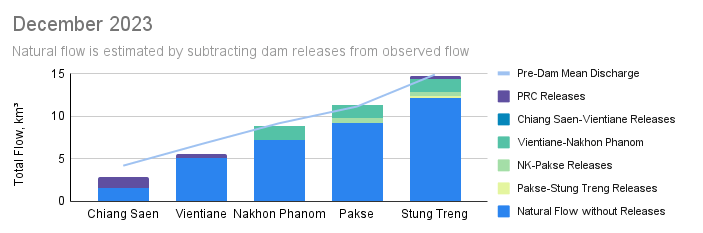
Across most of the 2023 wet season in Chiang Saen, observed flow was far below the historical average. Even if dams were not restricting flow, the river would have run at levels far below average for most of the wet season, suggesting that precipitation conditions upstream from Chiang Saen in China were much drier than normal across most of the wet season. The early wet season months of June, July, and August were particularly dry. Observed flow was around 50% of the average for most months of the wet season and peaked in August. However, under natural conditions, flow would have peaked in September at around 90% of average September flow. In September, 6 billion cubic meters of dam restrictions in China dropped natural flow by 48%! In October, 2.38 billion cubic meters of dam restrictions in China dropped natural flow by 27%.
Compare this to the previous wet season where similar effects were observed. Natural flow conditions were quite low and dam restrictions reduced flow around 20-30% each month. However, in 2022, dam restrictions were more evenly distributed across the months of July-October, and did not have such severe impact over natural flow.
At Vientiane, Laos, similar conditions to Chiang Saen, Thailand were observed. Flow was very low during the early wet season months. Natural flow levels would have been much closer to normal in August and September, but dam restrictions reduced flow during these months. China’s dam restrictions took a particularly large toll in September, dropping natural flow by 26%. Observed flow in September was 65% below normal. October flow would have been 10% higher than normal, but dam restrictions in China dropped flow to normal levels. Here again, the river would have run at normal levels in the later months of the wet season. Dams on the rivers between Chiang Saen and Vientiane (those on the Nam Ou and Nam Khan Rivers) had little noticeable effect on flow.
Comparing to 2022’s wet season, the 2023 wet season flows were lower overall, and China’s dam restrictions were much more evenly distributed across the wet season months and reduced flow ranging from around 5-10% per month.
At Nakhon Phanom the cumulative effects of China’s dams and the Core Lao Dams combine to reduce flow conditions. Flow in June and July was around 50% below normal due to a lack of precipitation, and dam operations had a minimal effect on natural flow. Rainfall was robust from August through November. If the river had flowed naturally, river flow would have been 10% higher than normal in August, at normal levels in September, and 30% higher in October. The combined effects of China’s dams and the Core Lao Dams dropped river flow by 13% in August, 20% in September, and 10% in October. The Core Lao dams had the greatest impact in August and China’s dams had the greatest impact in October.
Comparing to 2022’s wet season, 2023 wet season flows to Nakhon Phanom were more varied (dry during the early months and wet during the later months) but higher overall. During zero months of the 2022 wet season did observed flow hit the normal level (natural flow conditions would have reached normal in October without the impacts of dam restrictions).
Pakse’s flow conditions and dam impacts during the 2023 wet season were similar to Nakhon Phanom’s: low precipitation created significantly low levels under natural conditions, and then increased precipitation levels during the months of August through November buoyed the river to much higher flow levels. August natural flow would have been close to average, but dam restrictions, mostly those from the Core Lao Dams, dropped flow by more than 13%. September flow would have been normal but dam restrictions reduce flow to 17% below normal flow levels. China’s dams reduced flow by 10% in October, and the Core Lao Dams reduced flow by 5%. October flow would have been 28% higher than normal, but dam restrictions brought flow down to 10% above normal. A more even distribution of dam restrictions across September and October could have helped both months achieve normal flow levels and promoted better conditions downstream. November flow conditions were normal and dam impacts were minimal.
Comparing to 2022’s wet season, 2023 observed flow conditions (height of blue bars) were somewhat similar (although the early 2022 wet season months were wetter). But natural flow conditions in 2023 would have been much more favorable compared to 2022.
Stung Treng’s wet season conditions are similar to Nakhon Phanom and Pakse’s. The early months of June and July saw extremely low natural flow conditions and minimal impacts of dams. Natural flow levels for August and September would have been around 90% of normal flow, but dam restrictions dropped flow to 20% below normal in August and September. That missing 10% across these months would have done much to promote the Mekong floodpulse downstream. In August, the Core Lao Dams had the greatest impact, dropping flow by 8%, and in September, China’s dams had the greatest impact, dropping flow by 8%. October natural flow would have been 13% higher than normal, but dams dropped flow to 5% higher than normal.
Comparing to 2022’s wet season, 2023 observed flow conditions (height of blue bars) were somewhat similar (although the early 2022 wet season months were wetter). But natural flow conditions in 2023 would have been much more favorable.
Tonle Sap and Floodpulse
Spatial analysis of the Tonle Sap Expansion and Lower Mekong Floodpulse shows how dam impacts and the missing middle led to a near-normal, yet suboptimal wet season outcome. This outcome translated to a lower fish catch for the Mekong Basin and less water availability in the Mekong floodplain for irrigation and agricultural production than what would have been possible under natural conditions.
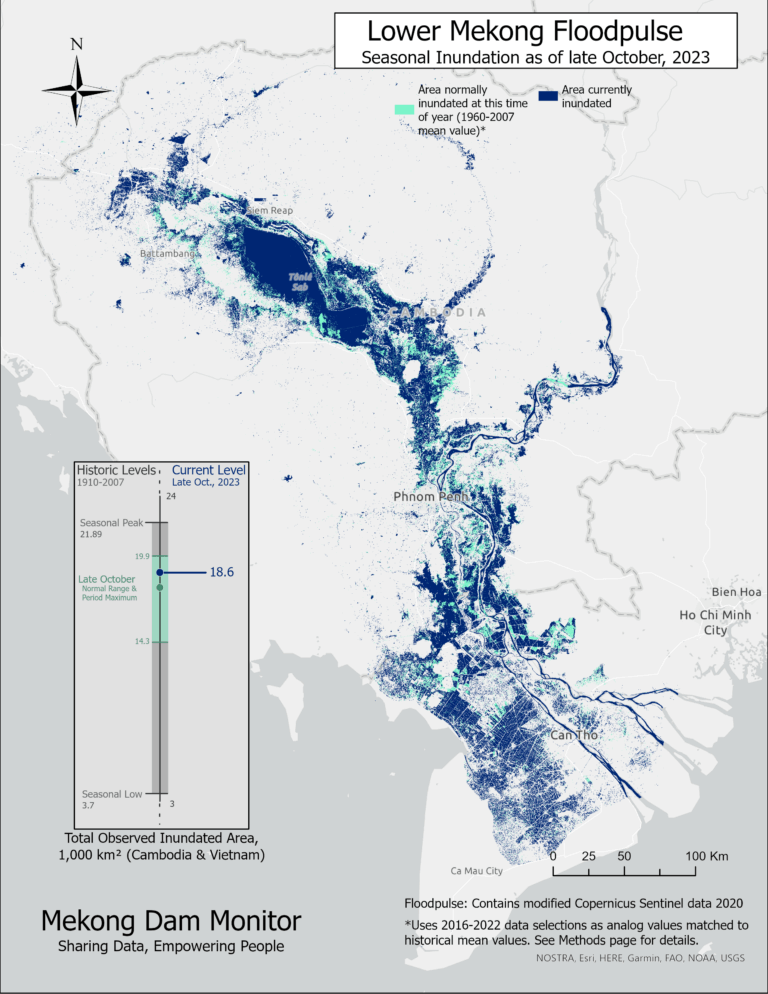
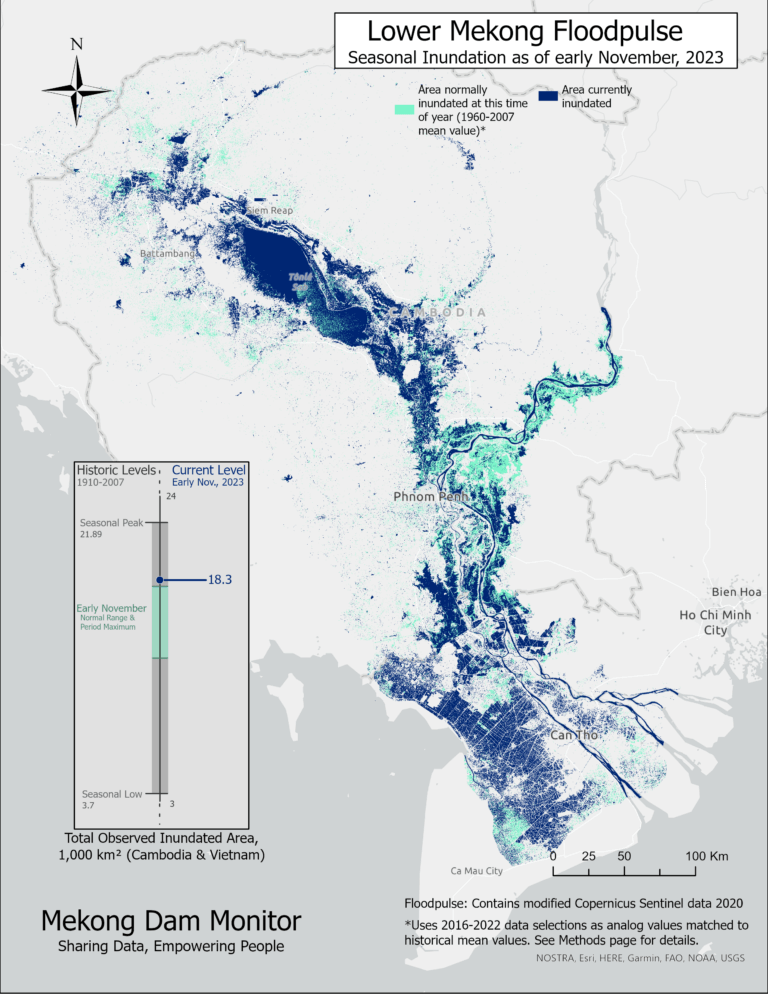
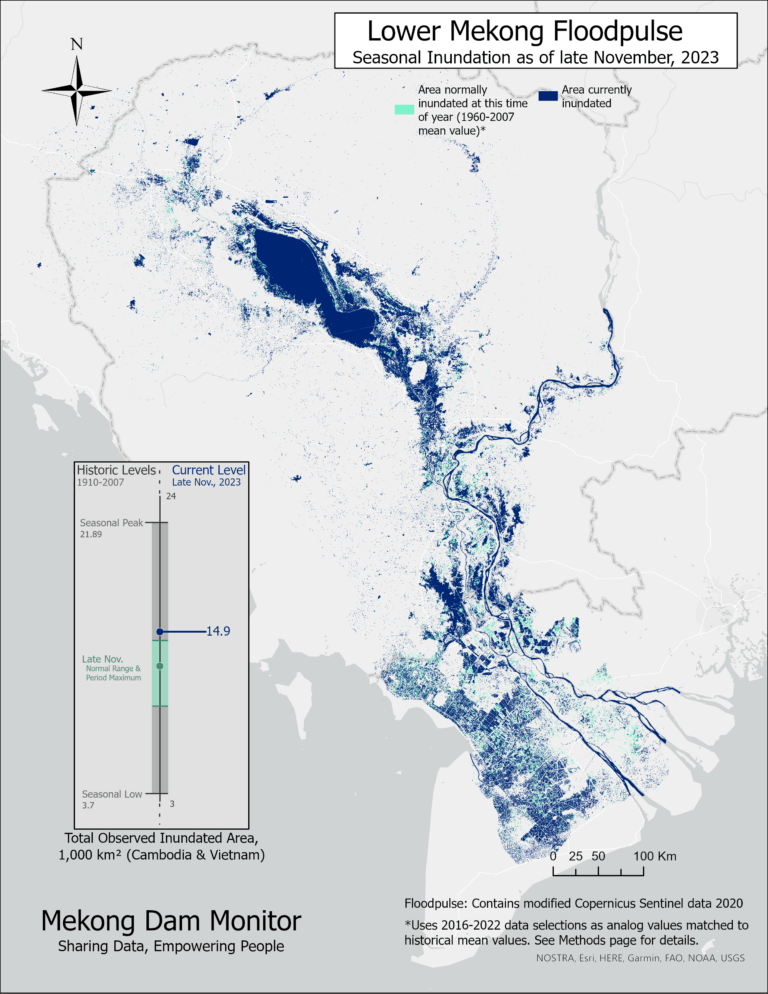
Scrolling through our Mekong Floodpulse maps (Figure 18) reveals that the pattern of observed seasonal inundation in Cambodia and Vietnam tracked well with the observed flow line (red) in Figure 17. In June, the floodpulse fell within its normal bounds and then dropped lower than normal bounds until late October when it peaked. The floodpulse then gradually decreased through November and December at levels above its normal bounds. Peak seasonal inundation in late October was later than the normal historical peak in late September, and peak seasonal inundation saw 15% less area flooded (18,600 square kilometers) than the historical normal peak of 21,890 square kilometers.
By examining the Stung Treng natural flow line in Figure 17, it is possible to conclude that August seasonal flooding would have been much higher than what was observed without dam operations. This in turn would have pushed a larger floodpulse through the system, likely increasing each of the seasonal inundation values observed from September onward. Further modelling can confirm whether the floodpulse would have peaked in September within its normal bounds, but 2023 appears to be an instance where upstream dams converted the floodpulse from a normal outcome under natural conditions to below normal levels.
Figure 18: 2023 Mekong Floodpulse
Use the arrows to navigate through all the maps
Our natural flow model for the Prek Kdam gauge helps explain how the Tonle Sap Lake expands and also sheds insight into the drivers of the lake’s expansion. In Figure 19, the light grey shaded area which appears from July through the end of October is an observation of Mekong mainstream flow passing by the Prek Kdam gauge on the Tonle Sap River. When the grey area is trending upward, then Mekong flow is passing the gauge from downstream to upstream, generating reverse flow from the Mekong into the Tonle Sap. When the grey area is trending downward, less and less reverse flow is entering the lake. The black shaded area below the gauge line represents water passing the Prek Kdam gauge that originated from rainfall within the Tonle Sap watershed and is flowing out from the lake.
Figure 19: How Did the Tonle Sap Expand? (meters)
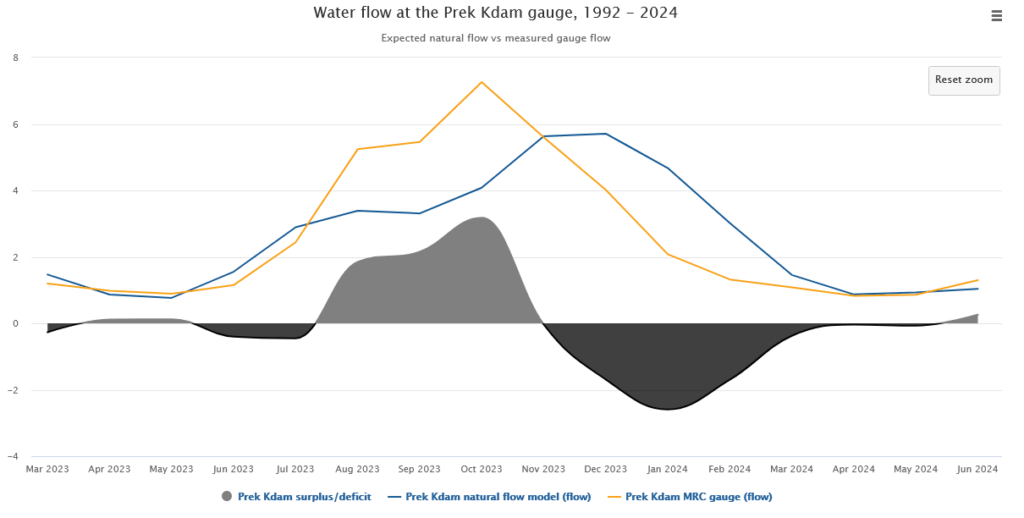
The model shows that both reverse flow from the Mekong (grey) and rainfall over the Tonle Sap watershed (black) contributed almost equally to the Tonle Sap Expansion in 2023. The yellow line suggests the lake was expanding from June through the peak in October (conforming well with the observed floodpulse in Figure 16). Applying the logic of what was concluded for natural flow at Stung Treng, without dam impacts, the Mekong mainstream would have been higher earlier, and the higher levels would have lasted longer into the wet season. This would have lifted the orange line and caused a much larger area of grey (reverse flow) to appear in the model.
To what degree reverse flow would have been larger should be confirmed by further studies and modelling, but it is logical to conclude that without the impacts of dams, the contribution of reverse flow to the Tonle Sap expansion would have been somewhat more than the contribution of rainfall over the Tonle Sap watershed. Regardless, the performance of the Tonle Sap Expansion during 2023 was much more normal process driven by reverse flow than in 2022, when the Tonle Sap Expansion hit its historical peak only with the help of massive seasonal rainfall over the Tonle Sap Watershed. Please refer to our previous annual report to understand just how peculiar the 2022 Tonle Sap Expansion process was.
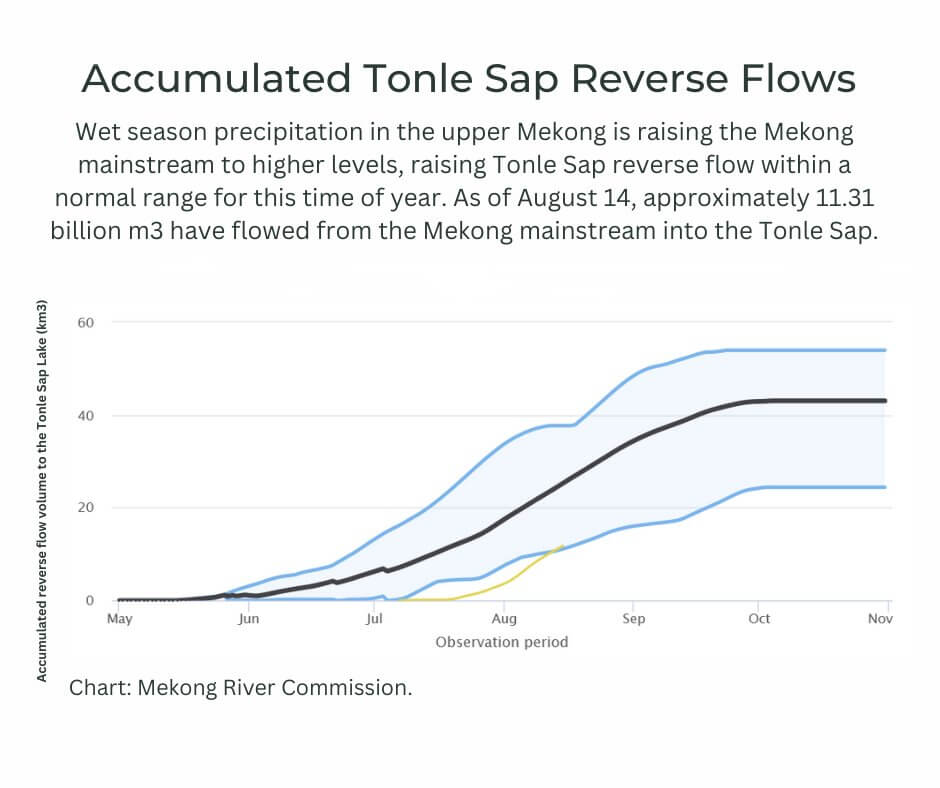
Figure 20: MRC Estimated 2023 Reverse Flow Was Just Below Normal
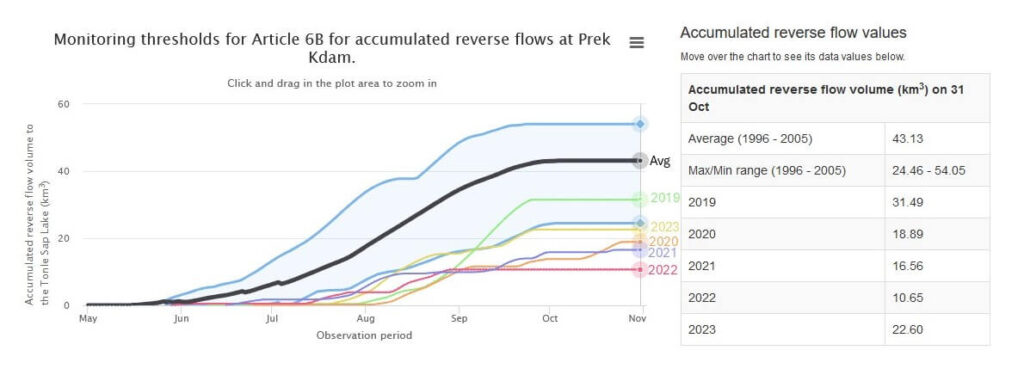
The MRC’s reverse flow monitoring method (Figure 20) corroborates much of the above. The yellow line represents accumulated reverse flow moving into the Tonle Sap Lake in 2023. From June through August, reverse flow was much lower than the minimum observed bound (determined by 1996-2005 values). It skirted along the minimum observed line until October when accumulated reverse flow totaled 22.60 km3 for the 2023 wet season, just outside the minimum observed line. Again, by applying conclusions about natural flow from Figure 15, the 2023 yellow line would have been higher without dam operations and would have fallen within the blue bounds for most of the wet season, an outcome which has not been observed since 2019.
In summary, the 2023 wet season serves as a case where climate conditions drove the Mekong’s hydrological conditions towards the low end of historical norms, yet dam impacts reduced flow such that hydrological conditions and the outcomes produced by those conditions were outside of normal bounds for longer than what natural flow would have produced. A stronger weather pattern in the later months of the wet season drove the Mekong’s hydrological cycle to higher-than-average results, but by then the damage of dam restrictions had already taken its toll.
Wet Season 2023 Monthly Snapshots
This section takes a month by month look at what happened during the 2023 wet season and highlights key points of MDM coverage across the six-month period of June through November.
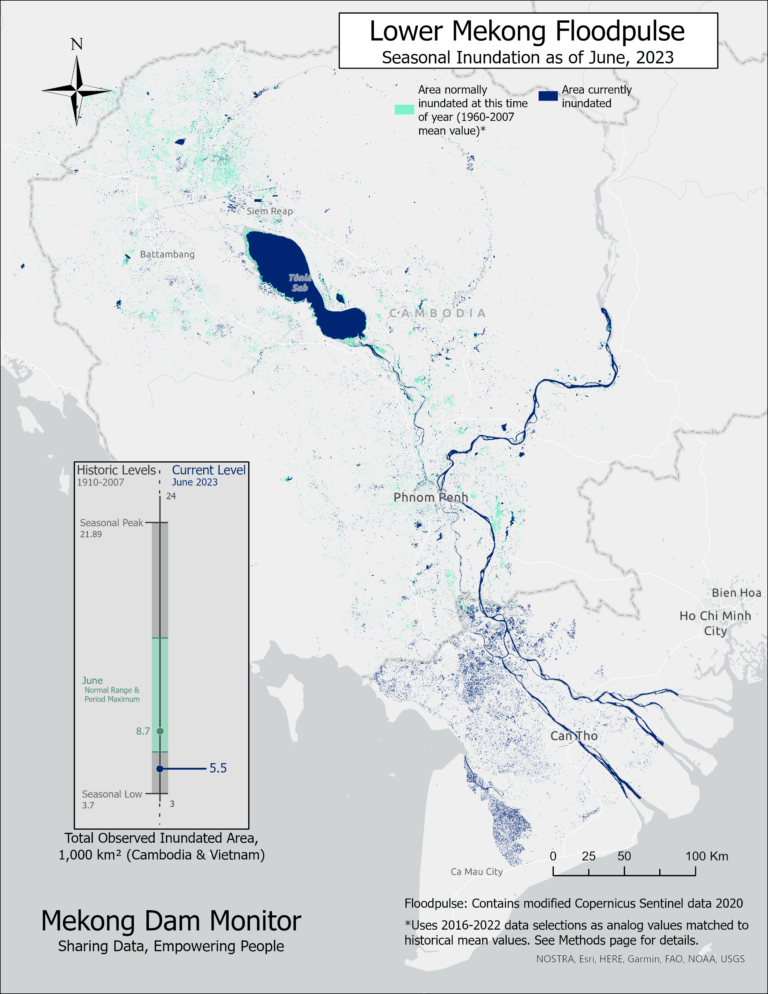
June
![]()
![]()
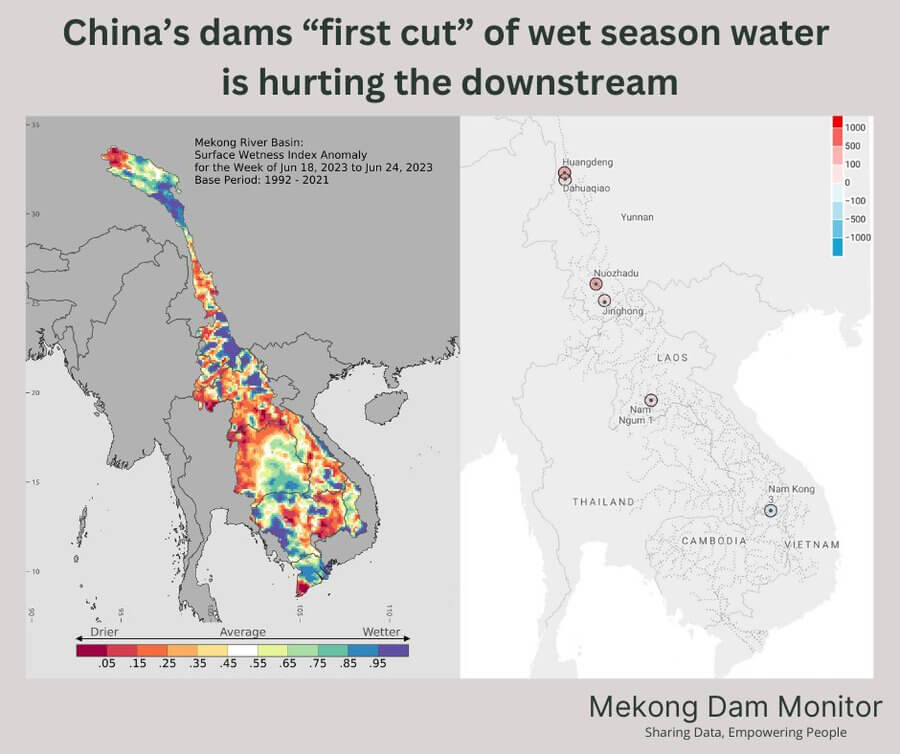
June 2023 saw a suboptimal start to the wet season with most of the basin experiencing drier than normal conditions, except the headwaters in China and portions of northeast Thailand and Cambodia’s Cardamom Mountains. The bar graph demonstrates how river levels throughout the basin were lower than normal, nearly entirely caused by a lack of rainfall since no net dam restrictions were observed during June which could artificially push down river levels. River levels were closer to normal in the upstream at Chiang Saen and Vientiane and then began to diverge significantly below Nakhon Phanom.
Dams in China restricted about 1 billion cubic meters of water during the last two weeks of June, leading to lower levels during those weeks. However, those restrictions do not show on the monthly bar chart because they were offset by releases from China’s dams over the first two weeks of June. The floodpulse at the end of June was well below the normal band with only 5,500 square kilometers of seasonal inundation.
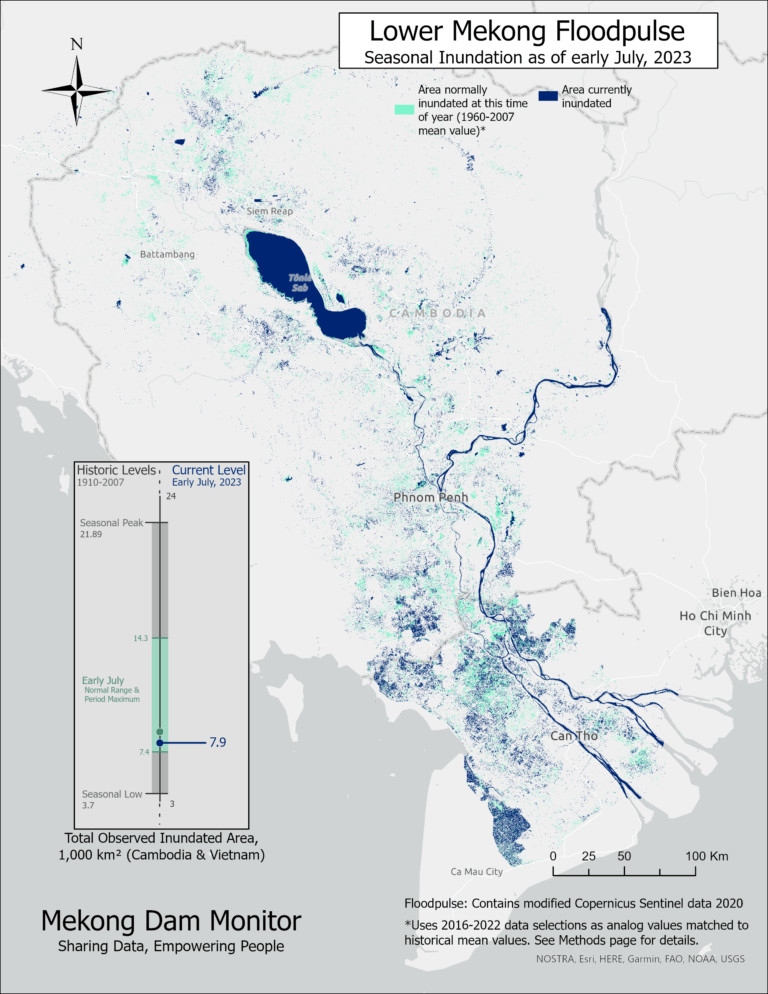
July
![]()
![]()
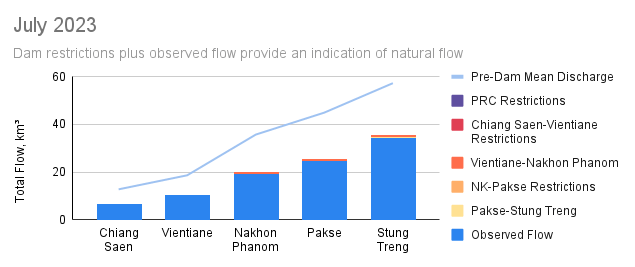
Drought conditions continued to develop into July with severe dryness observed throughout the basin. This led to low river levels and a larger gap between normal historical flow and natural flow throughout the basin. Dam restrictions were not observed in China nor in northern Laos, likely due to extreme droughts developing there. 920 million cubic meters of dam restrictions were estimated from the Core Laos Dams and about 420 million cubic meters of restrictions from the 3S Basin, but their overall effect on natural flow was minimal. These two sub-basins also contributed the largest flow proportions with 23% and 31% of flow respectively. Climate conditions in July were the main driver of lower-than-normal flow, and while seasonal inundation in the Lower Mekong did increase from June (to 9,100 square kilometers) it was far behind normal inundation levels for this month of around 15,000 square kilometers.
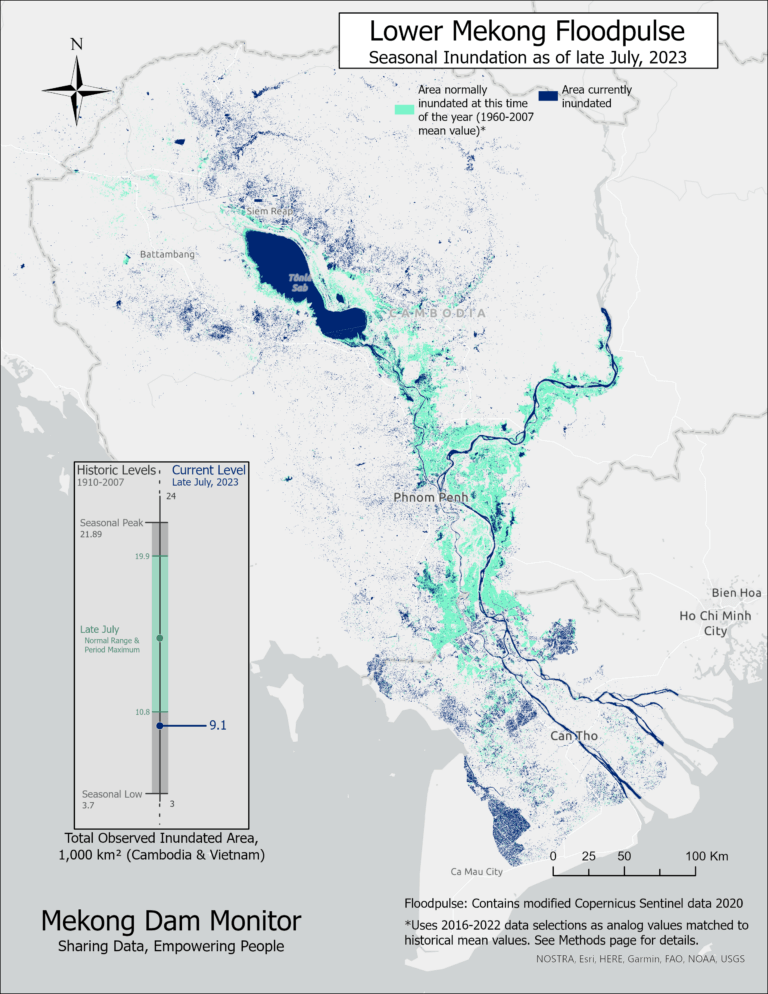
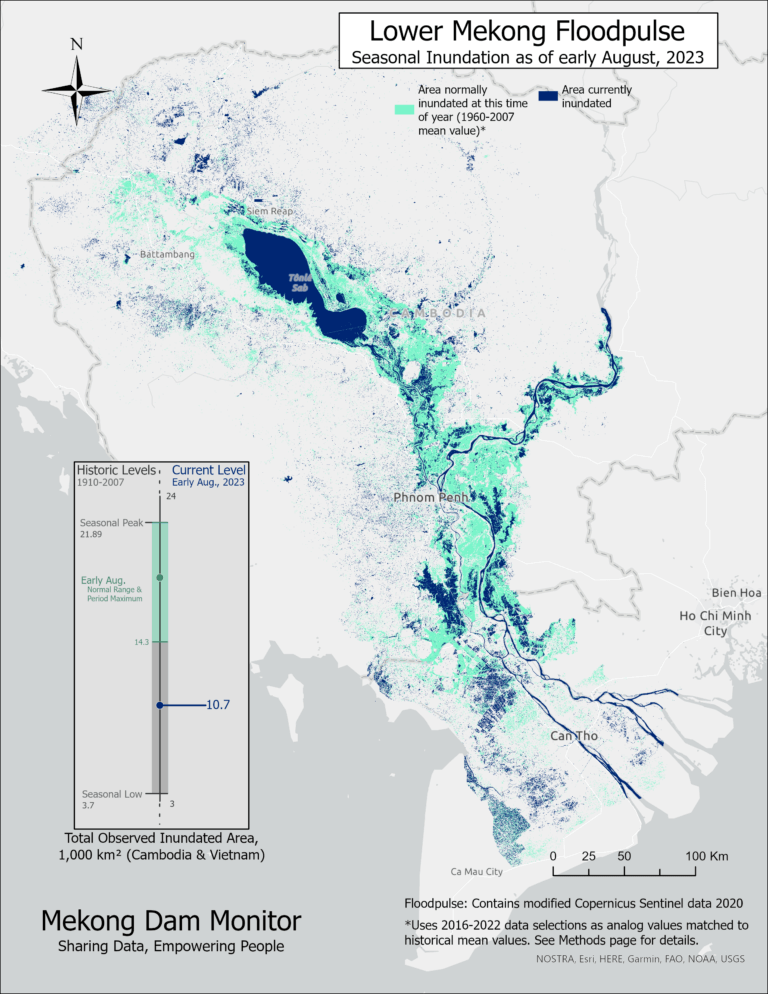
August
![]()
![]()
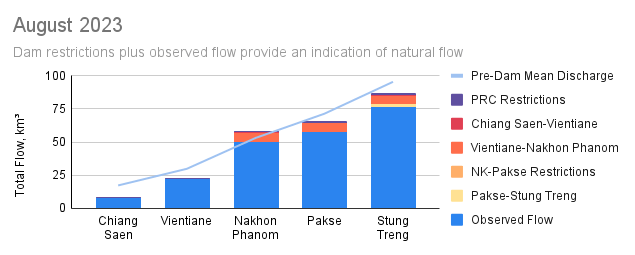
During August, a few storms in the center of the basin drove river levels closer to normal but also created conditions for dam restrictions in Laos to noticeably impact river levels below Nakhon Phanom, driving them about 10% lower than they would have been under normal conditions. Those storms did energize the Tonle Sap’s reverse flow to a degree, which fell within the MRC’s normal band of reverse flow for the first time in four years. However, that reverse flow would have been even more robust without 8.2 billion cubic meters of upstream dam restrictions, the majority (6.5 billion cubic meters) of which came from the Core Lao Dams. As a result, the Tonle Sap expansion and lower Mekong floodpulse only increased seasonal inundation by around 2,000 square kilometers compared to the previous month. Overall seasonal inundation remained far below the normal range.
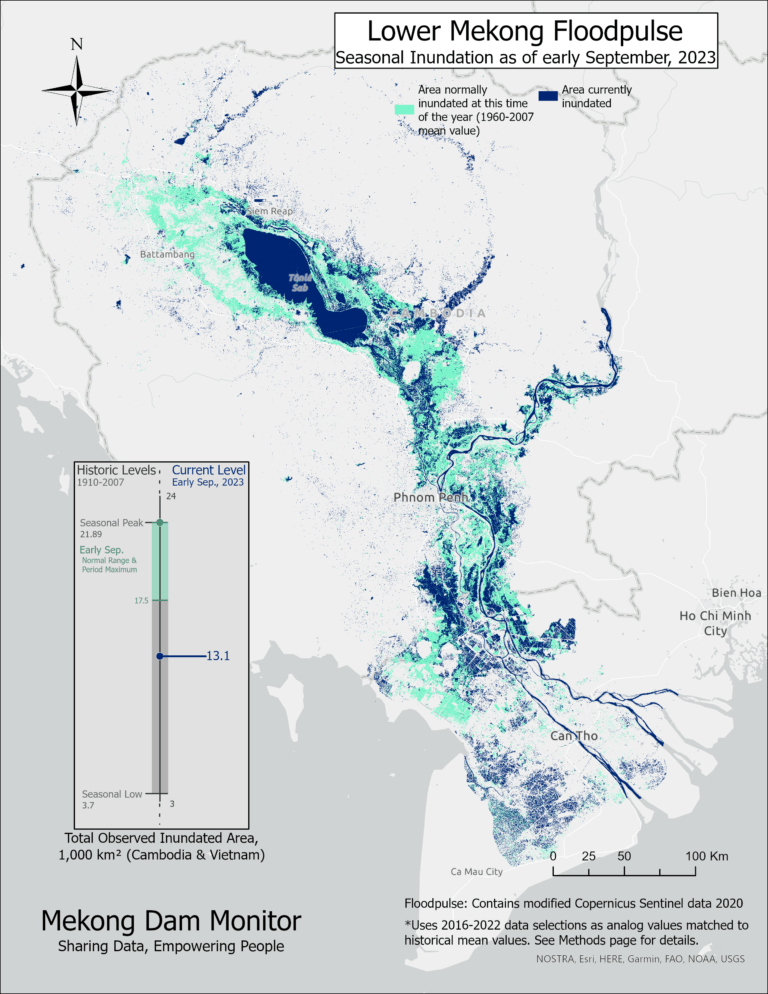
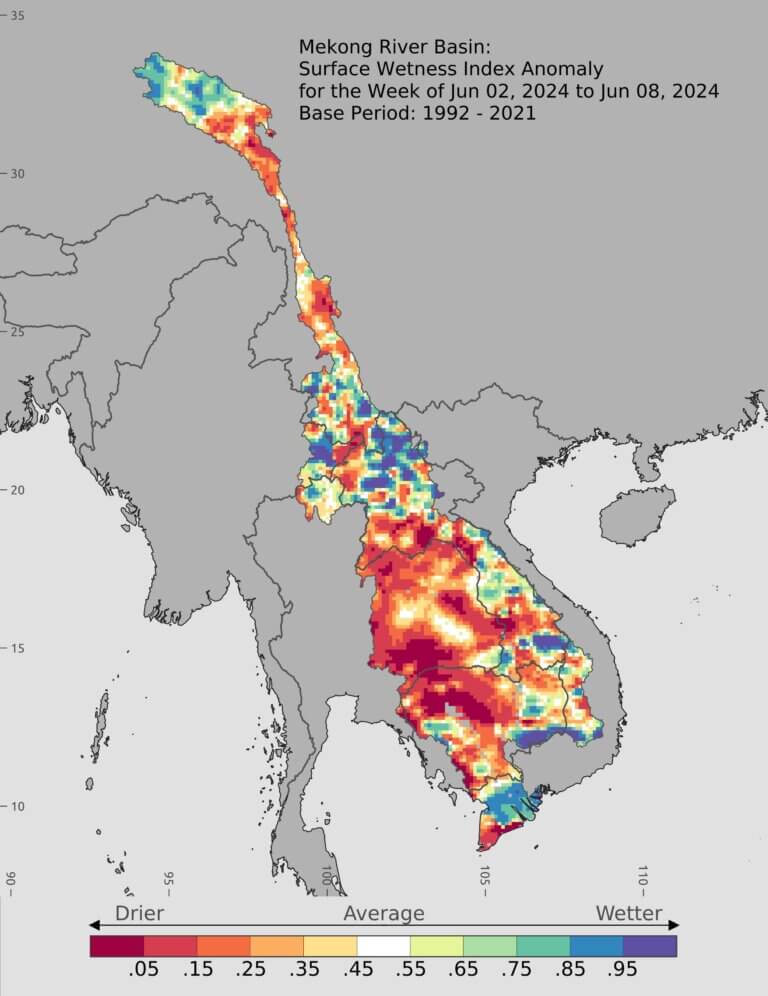
September
![]()
![]()
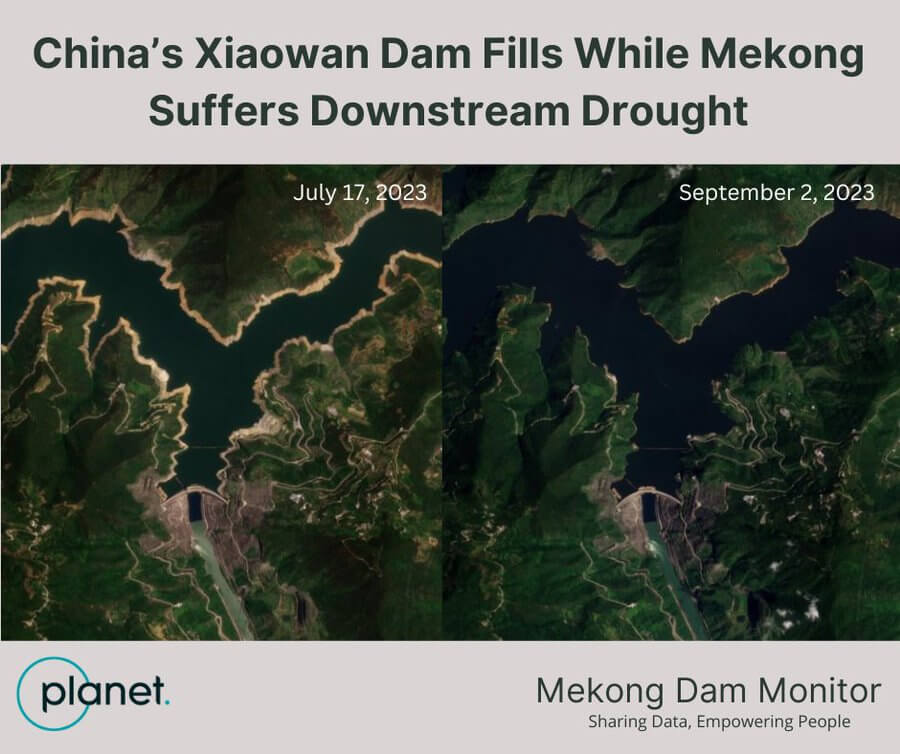
In September, China’s dam operations kicked in with an estimated 6 billion cubic meters of flow restrictions that halved flow in Chiang Saen and dropped natural flow at Stung Treng by more than 7%. Major restrictions were seen at China’s Xiaowan Dam, which increased its reservoir level by 22 meters during the ten-day period from August 23 to September 3 (and by almost 40 meters from July 17-September 2 (see image)). River levels throughout the basin would have been around 10% below normal under natural conditions, but dam restrictions drove levels to 50% below normal at Chiang Saen and between 17-34% below normal at other gauges downstream. The Lower Mekong Floodpulse and Tonle Sap expansion normally peak in September, but seasonal inundation in this part of the basin remained well below normal conditions, largely due to the impact of dam restrictions. To reduce negative basin-wide impacts, dam operators should have avoided r minimized dam restrictions in September.
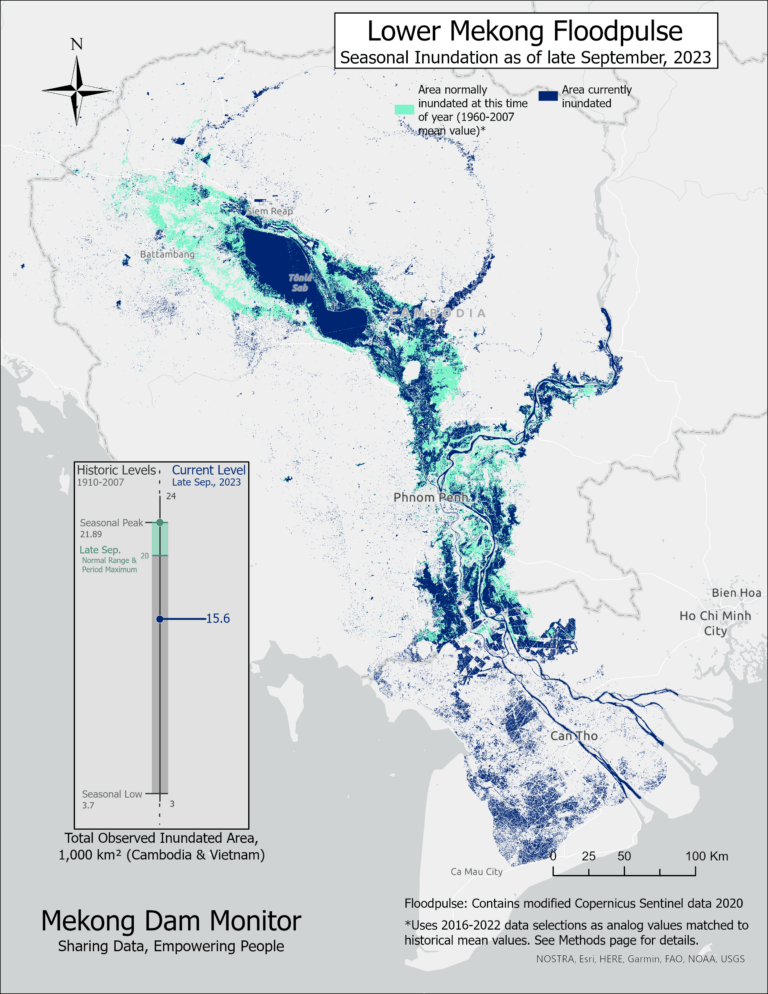
October
![]()
![]()
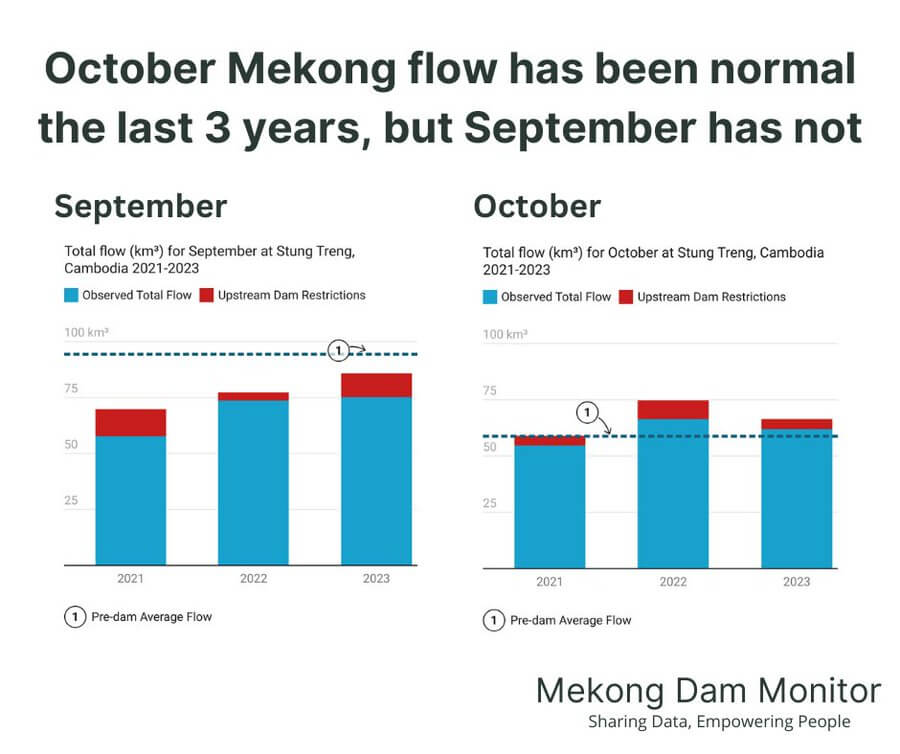
Rainfall was robust throughout the Lower Mekong in October and led to higher-than-normal river levels from Vientiane to Stung Treng even with the cumulative effects of dam restrictions. China’s dams restricted an estimated 2.38 billion cubic meters, and this led to flow levels 40% below normal at Chiang Saen. Without restrictions, the river would have been about 16% below normal at Chiang Saen. While river levels were above normal at Stung Treng, dam restrictions reduced flow to Stung Treng by 11%.
The Lower Mekong Floodpulse hit its peak at the end of October with an observed 18,600 square kilometers of seasonal inundation but was still shy of normal peak seasonal inundation (21,890 square kilometers). Peak floodpulse would have been higher and much closer to normal without the 14% reduction of flow observed at Stung Treng, Cambodia due to dam restrictions. Under natural conditions, October flow from 2021-2023 would have been at or above normal flow levels while natural conditions for September were below normal over the same period. This suggests an annual pattern of low September precipitation could be forming. Given these conditions, dam operators could consider delaying flow restrictions until after September to promote ecological benefits downstream.
November
![]()
![]()
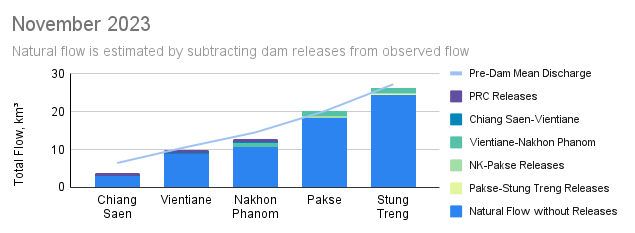
November 2023 was interesting because dams throughout the basin began to release water and artificially raise the level of the river. Net releases lifted river levels higher than what natural flow would have delivered: levels at Chiang Saen would have been about 55% below normal under natural conditions, but dam releases in China led to observed levels only 42% below normal. Dam releases brought the river to closer to normal levels downstream, and the largest releases came from the Core Lao Dams. The Mekong Floodpulse began to wane in November, shrinking by an estimated 3,700 square kilometers, and the quantity of seasonal inundation was on the high end of normal for late November. The GIF shows how the floodpulse transferred this month from the Tonle Sap Basin to the Mekong Delta as a contraction is observed around the Tonle Sap but an expansion is observed in Vietnam.
![]()
![]()
June 2023 saw a suboptimal start to the wet season with most of the basin experiencing drier than normal conditions, except the headwaters in China and portions of northeast Thailand and Cambodia’s Cardamom Mountains. The bar graph demonstrates how river levels throughout the basin were lower than normal, nearly entirely caused by a lack of rainfall since no net dam restrictions were observed during June which could artificially push down river levels. River levels were closer to normal in the upstream at Chiang Saen and Vientiane and then began to diverge significantly below Nakhon Phanom.
Dams in China restricted about 1 billion cubic meters of water during the last two weeks of June, leading to lower levels during those weeks. However, those restrictions do not show on the monthly bar chart because they were offset by releases from China’s dams over the first two weeks of June. The floodpulse at the end of June was well below the normal band with only 5,500 square kilometers of seasonal inundation.
![]()
![]()
Drought conditions continued to develop into July with severe dryness observed throughout the basin. This led to low river levels and a larger gap between normal historical flow and natural flow throughout the basin. Dam restrictions were not observed in China nor in northern Laos, likely due to extreme droughts developing there. 920 million cubic meters of dam restrictions were estimated from the Core Laos Dams and about 420 million cubic meters of restrictions from the 3S Basin, but their overall effect on natural flow was minimal. These two sub-basins also contributed the largest flow proportions with 23% and 31% of flow respectively. Climate conditions in July were the main driver of lower-than-normal flow, and while seasonal inundation in the Lower Mekong did increase from June (to 9,100 square kilometers) it was far behind normal inundation levels for this month of around 15,000 square kilometers.
![]()
![]()
During August, a few storms in the center of the basin drove river levels closer to normal but also created conditions for dam restrictions in Laos to noticeably impact river levels below Nakhon Phanom, driving them about 10% lower than they would have been under normal conditions. Those storms did energize the Tonle Sap’s reverse flow to a degree, which fell within the MRC’s normal band of reverse flow for the first time in four years. However, that reverse flow would have been even more robust without 8.2 billion cubic meters of upstream dam restrictions, the majority (6.5 billion cubic meters) of which came from the Core Lao Dams. As a result, the Tonle Sap expansion and lower Mekong floodpulse only increased seasonal inundation by around 2,000 square kilometers compared to the previous month. Overall seasonal inundation remained far below the normal range.
![]()
![]()
In September, China’s dam operations kicked in with an estimated 6 billion cubic meters of flow restrictions that halved flow in Chiang Saen and dropped natural flow at Stung Treng by more than 7%. Major restrictions were seen at China’s Xiaowan Dam, which increased its reservoir level by 22 meters during the ten-day period from August 23 to September 3 (and by almost 40 meters from July 17-September 2 (see image)). River levels throughout the basin would have been around 10% below normal under natural conditions, but dam restrictions drove levels to 50% below normal at Chiang Saen and between 17-34% below normal at other gauges downstream. The Lower Mekong Floodpulse and Tonle Sap expansion normally peak in September, but seasonal inundation in this part of the basin remained well below normal conditions, largely due to the impact of dam restrictions. To reduce negative basin-wide impacts, dam operators should have avoided r minimized dam restrictions in September.
![]()
![]()
Rainfall was robust throughout the Lower Mekong in October and led to higher-than-normal river levels from Vientiane to Stung Treng even with the cumulative effects of dam restrictions. China’s dams restricted an estimated 2.38 billion cubic meters, and this led to flow levels 40% below normal at Chiang Saen. Without restrictions, the river would have been about 16% below normal at Chiang Saen. While river levels were above normal at Stung Treng, dam restrictions reduced flow to Stung Treng by 11%.
The Lower Mekong Floodpulse hit its peak at the end of October with an observed 18,600 square kilometers of seasonal inundation but was still shy of normal peak seasonal inundation (21,890 square kilometers). Peak floodpulse would have been higher and much closer to normal without the 14% reduction of flow observed at Stung Treng, Cambodia due to dam restrictions. Under natural conditions, October flow from 2021-2023 would have been at or above normal flow levels while natural conditions for September were below normal over the same period. This suggests an annual pattern of low September precipitation could be forming. Given these conditions, dam operators could consider delaying flow restrictions until after September to promote ecological benefits downstream.
![]()
![]()
November 2023 was interesting because dams throughout the basin began to release water and artificially raise the level of the river. Net releases lifted river levels higher than what natural flow would have delivered: levels at Chiang Saen would have been about 55% below normal under natural conditions, but dam releases in China led to observed levels only 42% below normal. Dam releases brought the river to closer to normal levels downstream, and the largest releases came from the Core Lao Dams. The Mekong Floodpulse began to wane in November, shrinking by an estimated 3,700 square kilometers, and the quantity of seasonal inundation was on the high end of normal for late November. The GIF shows how the floodpulse transferred this month from the Tonle Sap Basin to the Mekong Delta as a contraction is observed around the Tonle Sap but an expansion is observed in Vietnam.
2024 Dry Season
Climate
Figure 21: How Hot was the 2024 Dry Season?
Use the arrows to navigate through all the maps
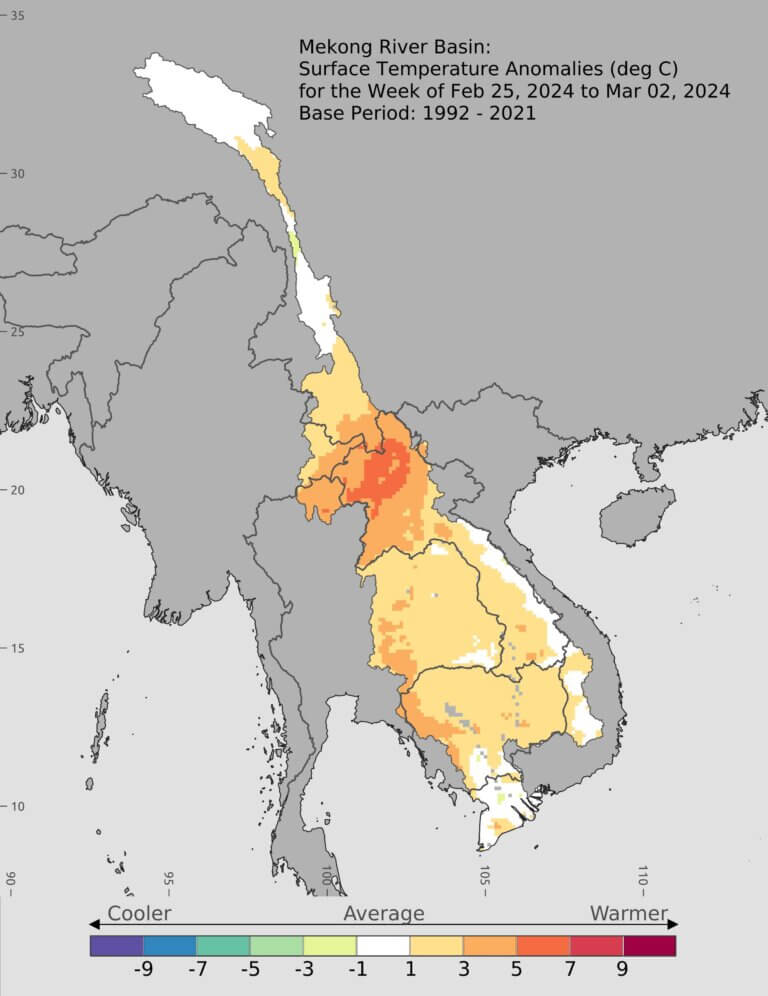

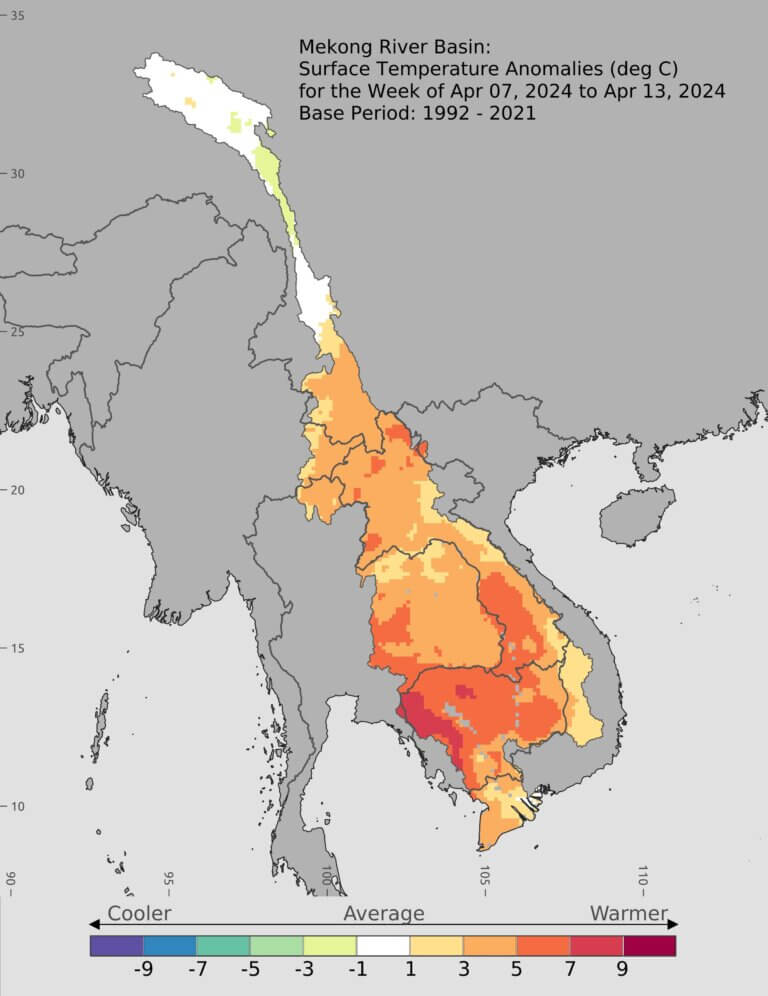
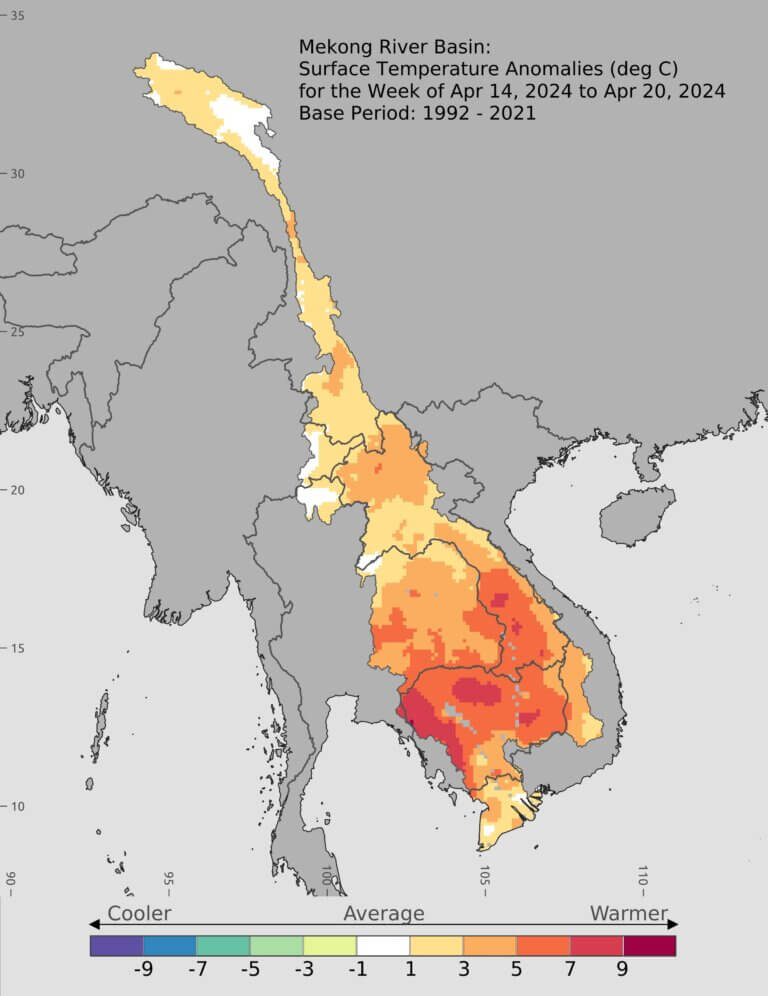
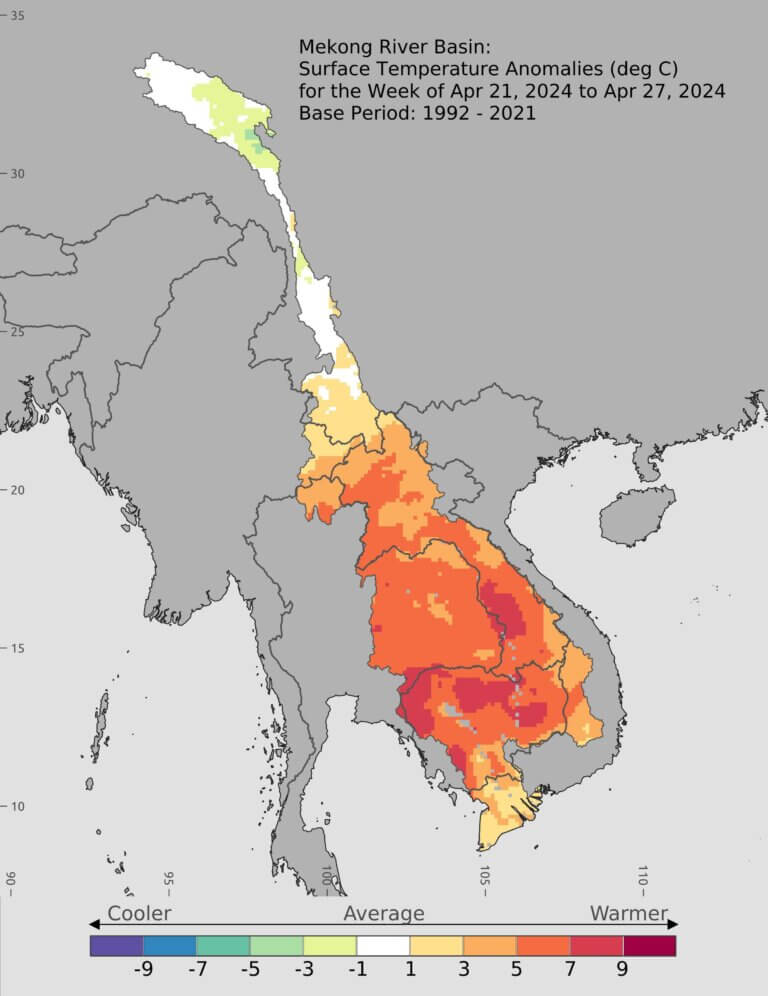
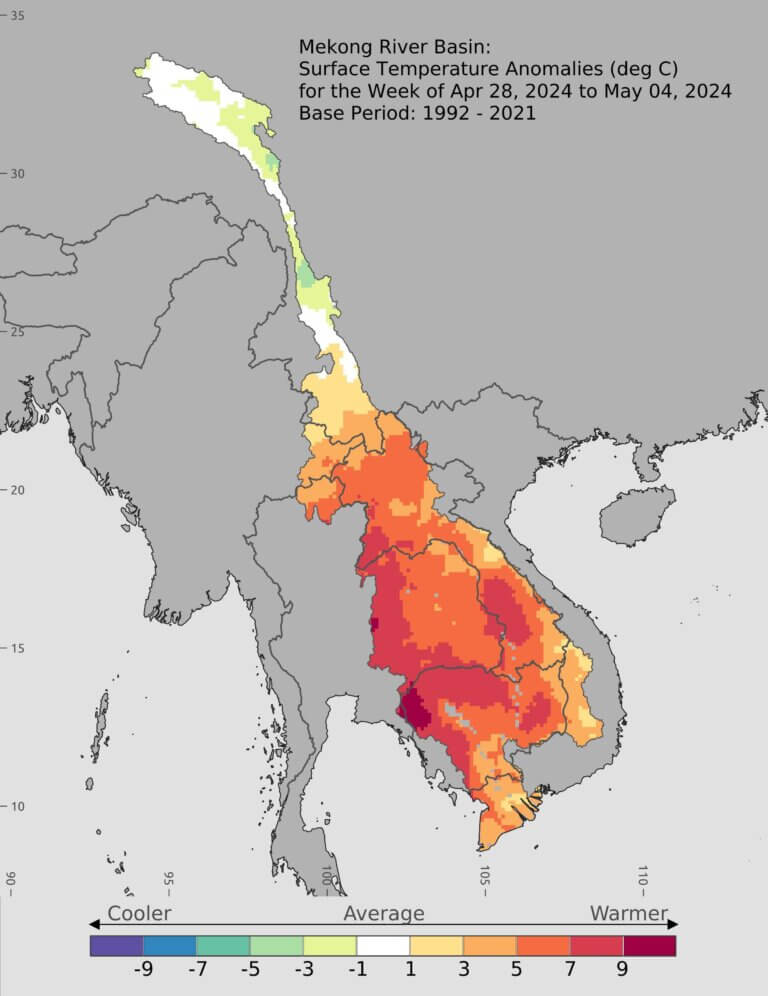
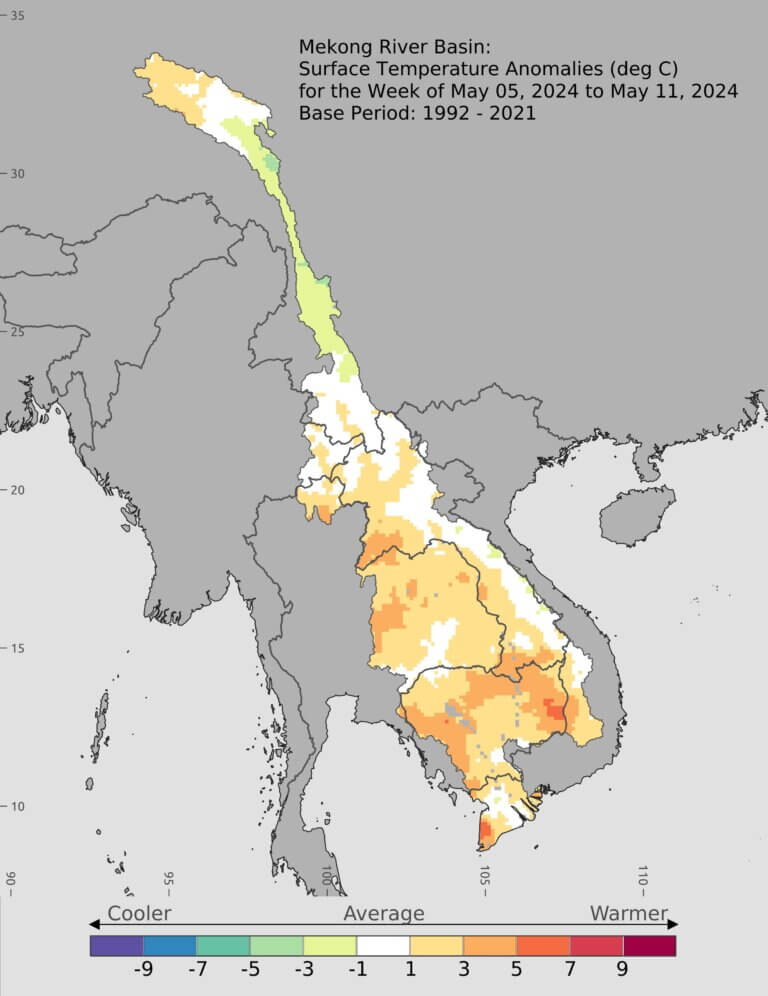
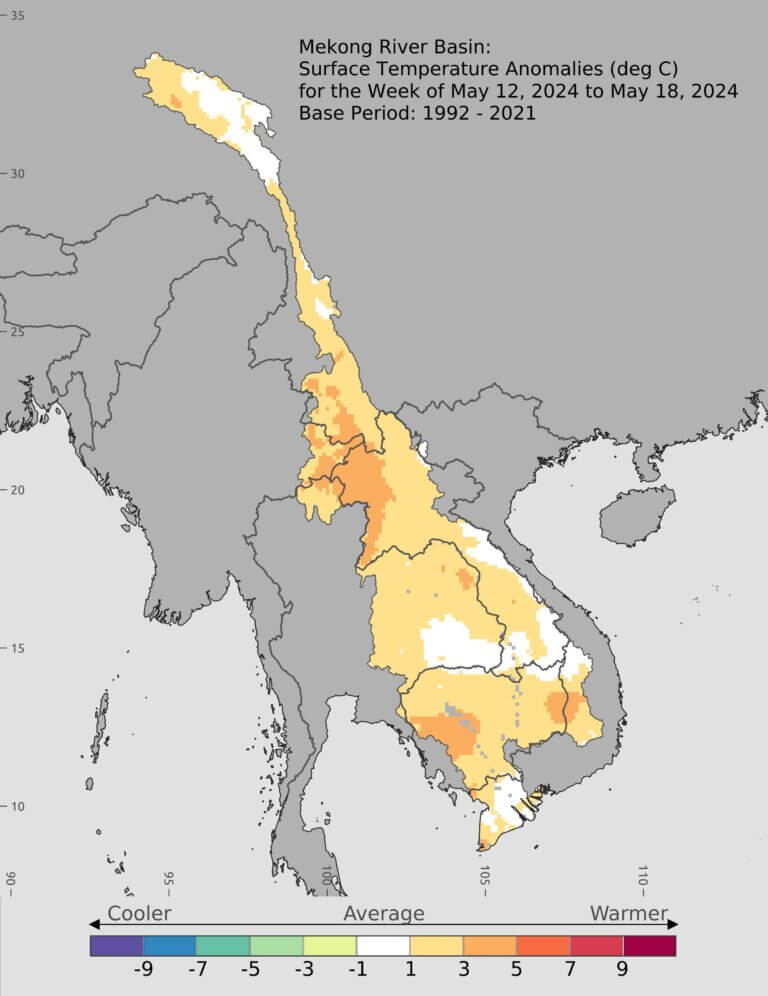
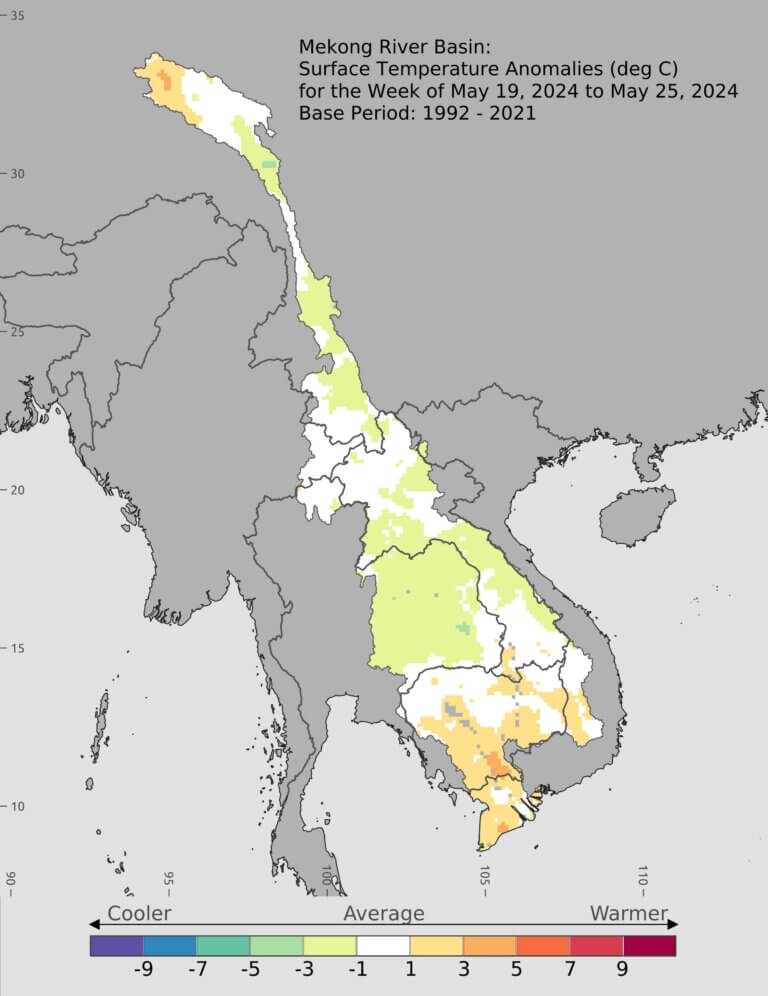
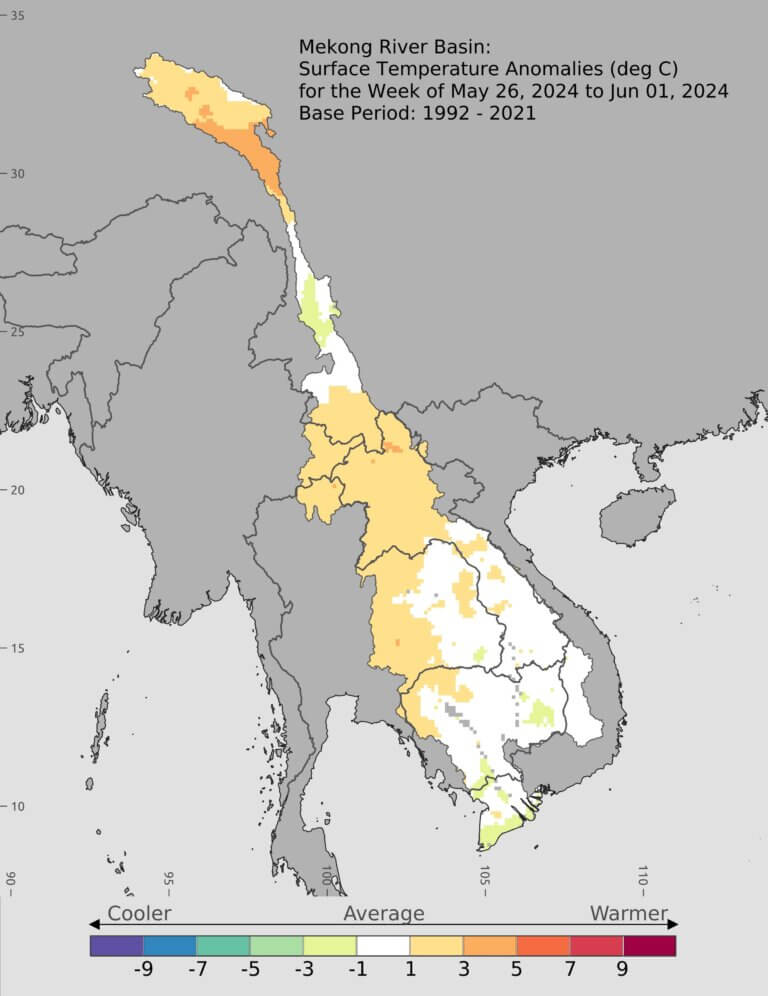
The 2024 dry season was one of the driest and hottest on record. Scrolling through the temperature maps in Figure 21 shows that most of the basin experienced temperatures between 1-3 degrees Celsius higher than normal. Orange colors (5-7 degrees Celsius higher than normal) are also prevalent through much of the lower basin during this period, especially in parts of Laos, northeast Thailand, and Cambodia. In April, parts of Cambodia and Laos experienced temperatures 7-9 degrees Celsius higher than normal. During the first week of May, western Cambodia registered temperatures more than 9 degrees Celsius higher than normal. The heatwave, which also affected much of Asia, finally broke towards the end of May.
This extreme heat drove extreme drought conditions through most of the Lower Mekong, particularly from March through May, as can be observed by scrolling through Figure 22. The worst drought conditions were observed throughout the basin in the latter weeks of April, but drought conditions began to form as early as February in some parts of the basin, particularly in the southern tip of the Mekong Delta.
Figure 22: How Dry was the 2024 Dry Season?
Use the arrows to navigate through all the maps
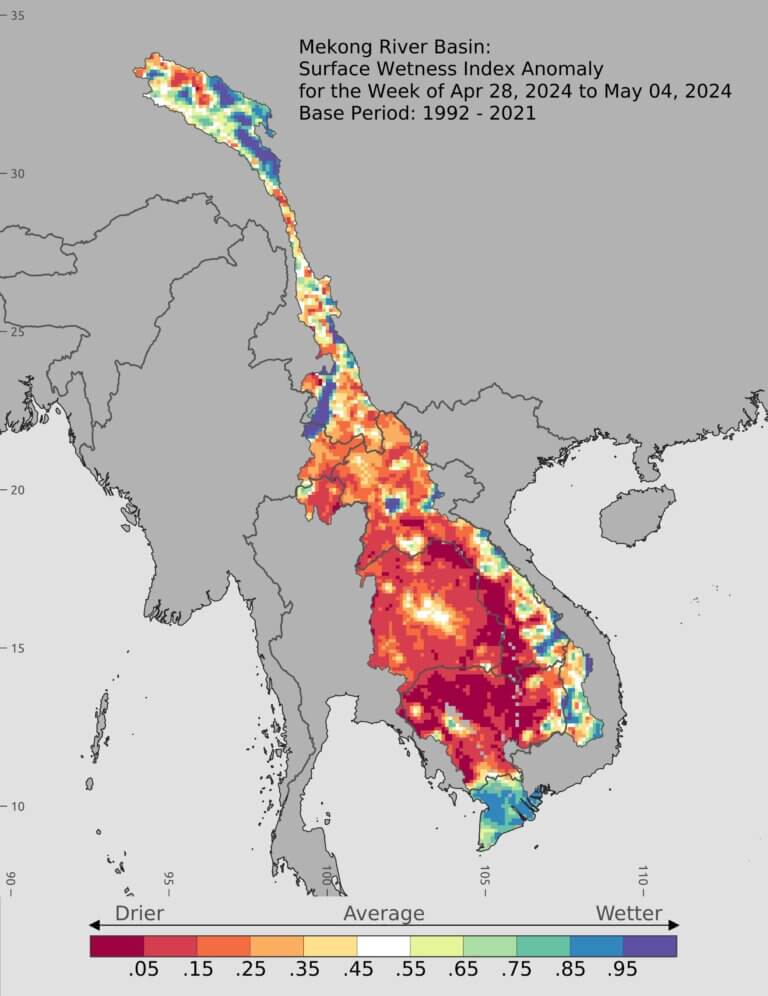
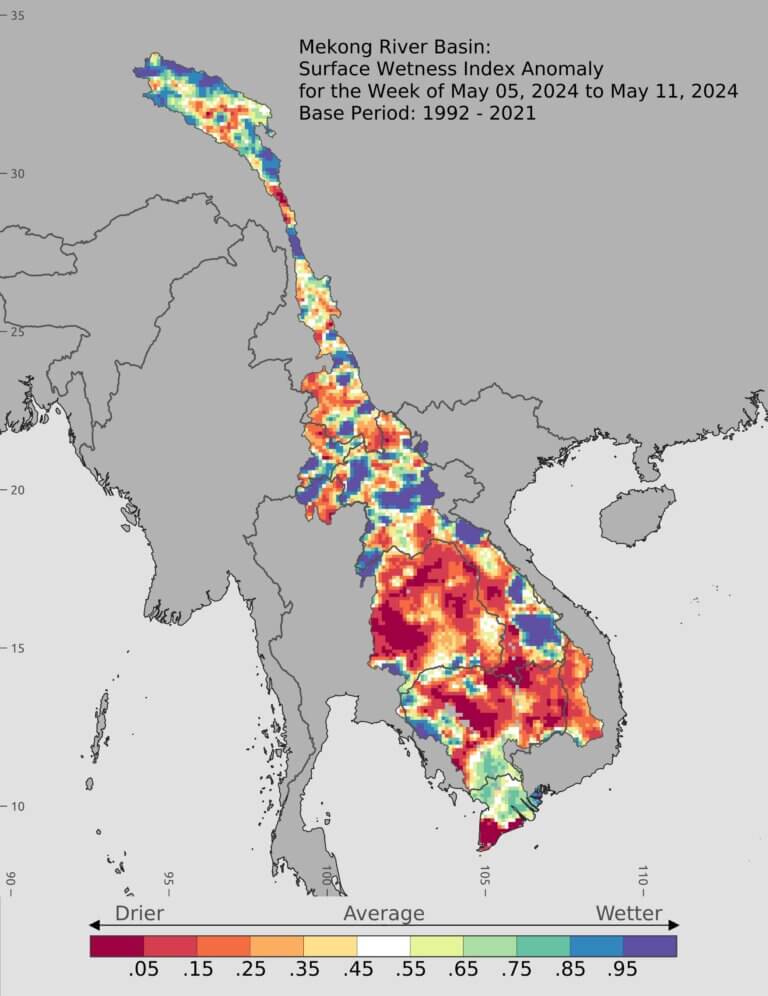
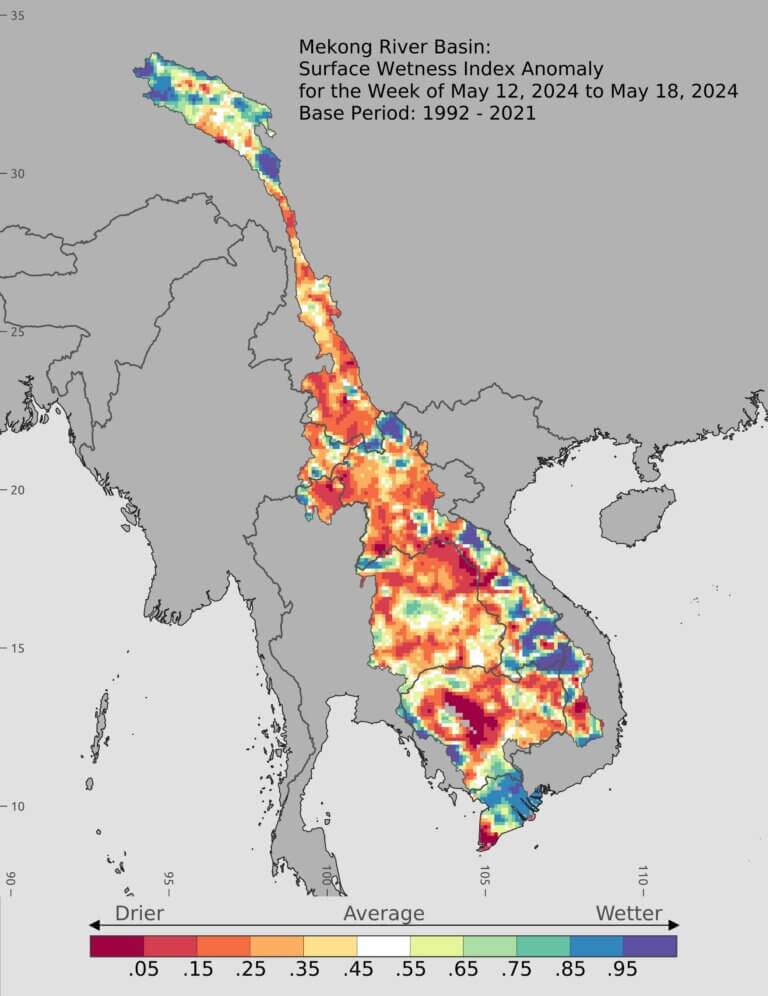
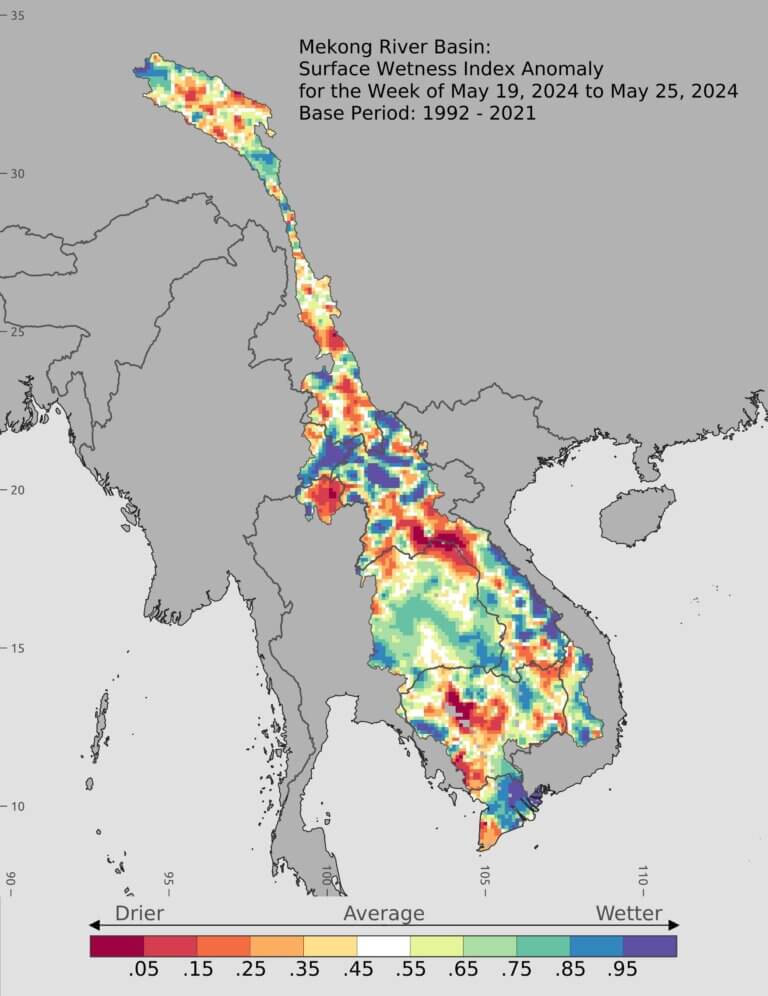


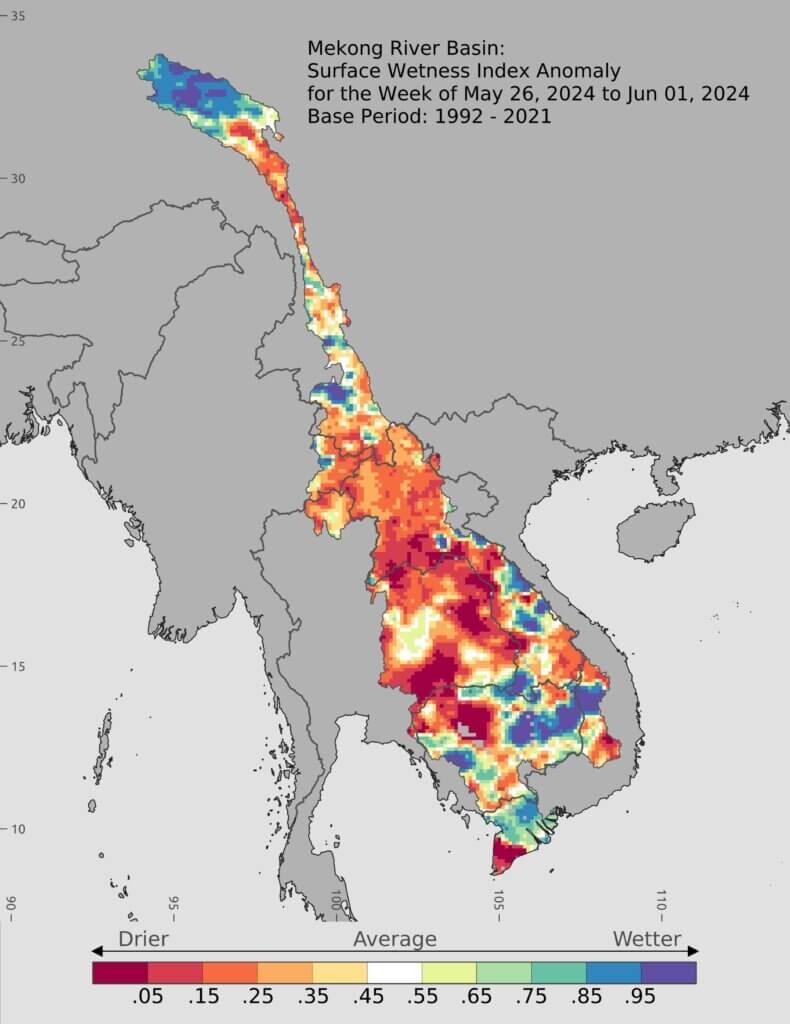
From February through May, coastal provinces in Vietnam such as Ca Mau, Bac Lieu, and Soc Trang declared a drought emergency. Yet, much of the rest of the Mekong Delta remained wetter than average even while areas north of the Mekong Delta in Cambodia also entered into severe drought conditions. What drove this wetness pattern? In March 2024, the MDM team was in Can Tho, Vietnam on a field visit and observed rice paddies in the interior Mekong Delta provinces of Hau Giang, Vinh Long, and Tien Giang were very wet and being prepared for the first dry season rice crop photo.
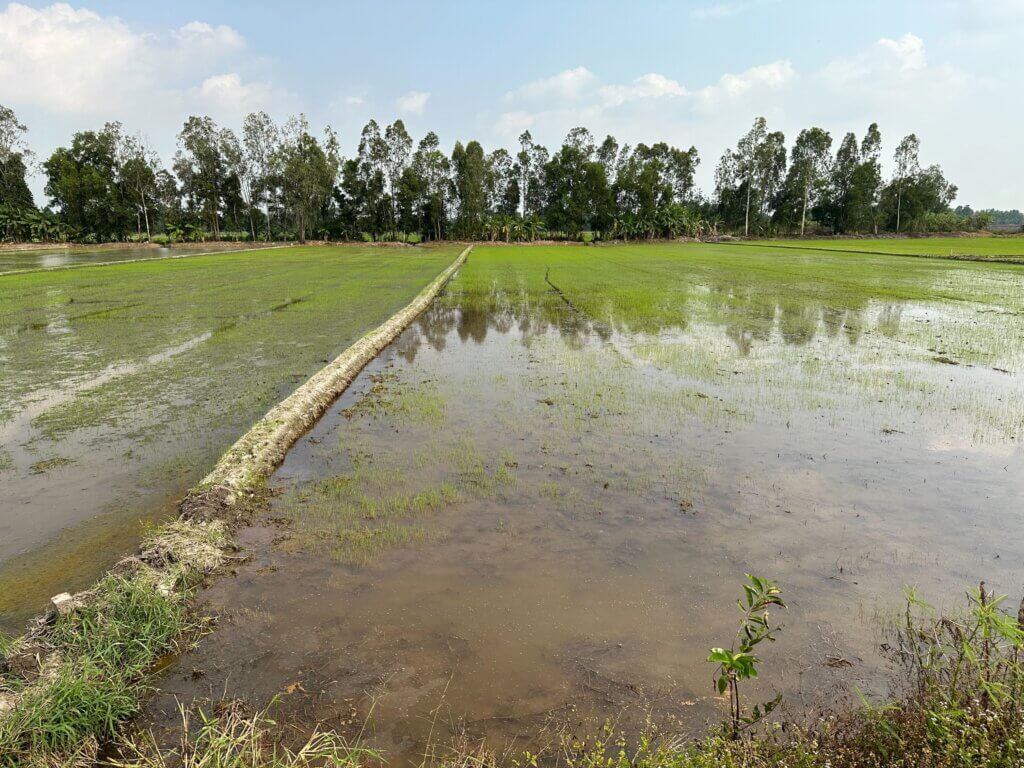
Irrigated rice fields in Vietnam’s Hau Giang Province in March 2024.
In Figure 23, notice how the Mekong Delta starts out relatively dry in the early wet season months, but becomes significantly wetter by March (green and blue). This is water provided by the Mekong Delta’s irrigation canals, which move water from the Mekong mainstream channels deep into various parts of the delta. Some of the water also comes from pumping groundwater from underground aquifers for rice farming and the growing of other dry season crops. The irrigation system could not be utilized in coastal areas, likely due to salinity intrusion. Figure 22 also shows that by the end of the dry season much of the interior of the Mekong Delta also dries up, and indeed by the end of the dry season some interior provincial governments filed for drought relief.
Figure 23: The Mekong Delta Gets Wetter (and Then Drier) Into the 2024 Dry Season
2024 Dry Season Dam Impacts
What role did dams play during these severely dry conditions from December to May? Reservoir levels in China were already abnormally low at the beginning of the dry season. Recalling the reciprocal relationship between wet season flow restrictions and dry season flow releases for hydropower production in Mekong dams, it was possible as early as November 2023 to forecast that dry season dam releases in China and their related impacts would be relatively low as well.
Our team communicates regularly with community organizations in Chiang Rai and forecasted to them in December 2023 that the river level in the 2024 dry season would be much closer to normal than previous years given lower-than-usual reservoir levels in China. We made the same forecast in December 2022, and once again our dry season forecasting was generally accurate.
Figure 24 displays the observed flow data for the Chiang Saen gauge in Chiang Rai for the dry season months of 2024 (orange) and 2023 (green) compared against the historical pre-dam mean flow (blue line with grey shaded area to denote the upper and lower limits of a normal band of dry season flow from 1960-2007). 2024 had some hills and valleys, but it generally tracked closely to the pre-dam mean’s trend line and was much lower than the mean flow from 2017-2021 (red), which at times was twice as high as the historical mean.
Figure 24: 2024 and 2023 Dry Season Flows Were Closer to Normal
Over this period, we issued fewer early warning alerts to local communities in Thailand and Laos than in any previous dry season. The peaks and valleys shown on Figure 24 come from sudden releases and restrictions of flow from China’s dams, and we provide early warning 2-5 days prior to when sudden changes of river level greater than 0.50 meter hit downstream communities. Between December 2023 and May 2024, we issued eight early warnings, none of which exceeded one meter. This was similar to the 2023 dry season when we issued nine early warnings (with two exceeding one meter). Compare this to the 2022 dry season when we issued twenty-four warnings, and the 2021 dry season when we issued ten (seven of which exceeded one meter or more).
In all, lower wet season restrictions in China led to more normal (low) and predictable river levels along the Thai-Lao border during the dry season. This led to many benefits. On social media we watched how local people enjoyed a higher than usual harvest of river weed (a local delicacy) in January. The Straits Times profiled a local farmer who was raising a good crop of bean sprouts along the riverside and noted how MDM early warnings help her protect her crop.
Figure 25: 2024 Mekong Dry Season Releases Were the Lowest in Three Years
Figure 25 shows how 2024 dry season releases across the entire Mekong were the lowest in three years. Most of the reduction came from China, which as previously stated charged its reservoirs with less water during the 2023 wet season due to drought. Dam releases from the Core Lao Dams and the 3S Dams were slightly lower than in 2023 as well again, likely as a result of dry conditions during the previous wet season.
Figure 26: Relatively Low 2024 Levels at Stung Treng Compared to Recent Years
These lower volumes of dam releases created more favorable and normal conditions along the entirety of the course of the Mekong as shown in Figure 26. The interactive feature in the next section explores gauge by gauge how dam releases lifted flow to either normal or above normal levels from Chiang Saen, Thailand to Stung Treng, Cambodia. What appears clear, however, is that for much of the upstream the river would have run at extremely low levels during the 2024 dry season without releases of flow.
These low levels would have been driven by the extremely high temperatures observed through much of the Mekong Basin as well as a carryover effect from China’s wet season: low precipitation during the 2023 wet season in China likely led to less snow cover, and less snow melt during the dry season would have meant abnormally low natural flow in the portions of the river closest to China. In other words, the effects of a weak monsoon have long-lasting and wide-reaching effects.
The wetness data in Figure 22 does suggest that much of the snowmelt runoff in China was used to fill dams instead of flow downstream. Further, of this report mentions the completion and filling of the Tuoba Dam in China during the months of February through June 2024. The animation in Figure 27 shows the reservoir filling over this period. Figure 28 provides a sense of how filling of this 1.4 km3 dam led to lower levels throughout the Mekong from February through June 2024, ranging from 11.3% lower at Chiang Saen to around 3.2% lower at Stung Treng. Obviously, the flow reduction was much more significant at Chiang Saen, but a 3.2% flow reduction to Cambodia and the Mekong Delta is measurable and somewhat significant.
Figure 27: Tuoba Dam Filling from February to June
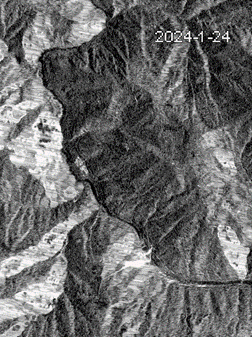
Figure 28: How did Tuoba Dam Filling Impact Downstream Flow?
In a break from past performance, China’s Nuozhadu Dam also filled to 75% capacity during May and into June of 2024. This was an abnormal practice compared to past filling patterns (large dams rarely fill during the dry season) and would have led to lower-than-normal levels downstream (likely shown best in the red downward dip at the end of the time series in figure 22). The red line in Figure 29 shows this filling pattern. While we can only speculate as to why Nuozhadu filled up much earlier than normal, it’s likely that its poor performance in previous years (as noted above) drove its dam operators to take water when it was available in May and fill the dam. The implications of this early filling will be examined in our next annual report.
Figure 29: Abnormal Practice: Nuozhadu Filled During the 2024 Dry Season
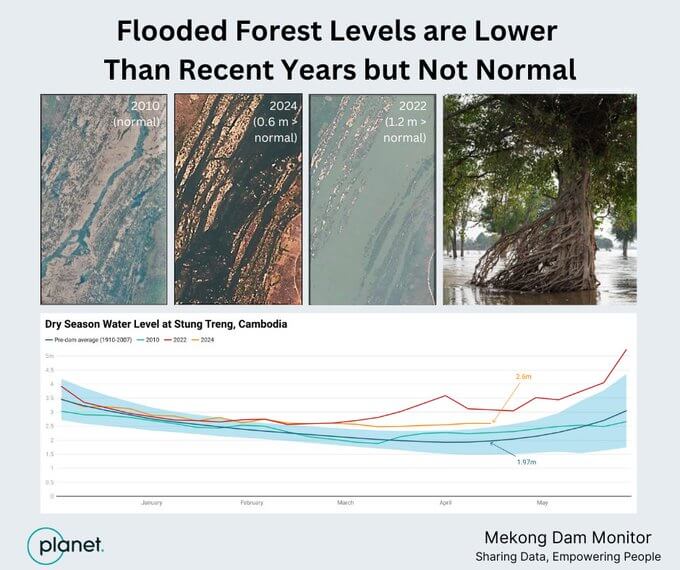
Cambodia’s Stung Treng Flooded Forest
There is a wide effort afoot to protect and conserve Cambodia’s flooded forest in the Mekong mainstream, which starts at Cambodia’s border with Laos and extends roughly 70 kilometers downstream to Stung Treng. The effort is led by Cambodian government agencies, local CSOs, journalists, and international development partners who have been shining a light on how higher river levels during the dry seasons caused by dam releases are causing a mass die-off of trees in the flooded forest. This February 2023 Mekong Water Data Hour webinar features the work of Dr. Ian Baird and provides insight into what is being lost as the flooded forest continues to deteriorate.
As highlighted above, river levels throughout much of the Mekong during the dry season were lower than recent years, and low river levels – especially those which approach normal historical levels – provide insight into the health of the flooded forest and the ability of the flooded forest to recover. Figure 29 shows that the initial months of the 2024 dry season indeed followed a normal, pre-dam river level from Pakse to Stung Treng. At the time, this cast some optimism on possible normal and low river levels throughout the entirety of the dry season. However, by February dam releases were causing river levels to buoy upward, and by the core wet season months of March and April flow to Stung Treng was already 60% higher than the pre-dam norm, albeit at much lower levels than in recent years.
Figure 30: Flooded Forest Levels are Lower Than Recent Years but Not Normal

The lower levels led our team to ponder future services provided by the MDM that could be developed using satellite imagery and locally collected data to monitor the health of the flooded forest. This is a service that we plan to develop in the near future, ideally with local partners. However, the prospects for full restoration of the flooded forest’s ecosystem during the dry season are grim: 2024 was a year of relatively low dam releases and impacts to natural flow were relatively low compared to previous years. So even during a year with relatively low dam impacts, dam releases lifted the river level in the flooded forest to levels 60% higher than the pre-dam mean. Clearly, if the Stung Treng flooded forest Ramsar site is to be preserved, a reexamination of dry season dam operations from China to Thailand to Laos will be critical.
Wet Season 2023 Monthly Snapshots
This section takes a month by month look at what happened during the 2024 dry season and highlights key points of MDM coverage across the six-month period from December 2023 through May 2024.
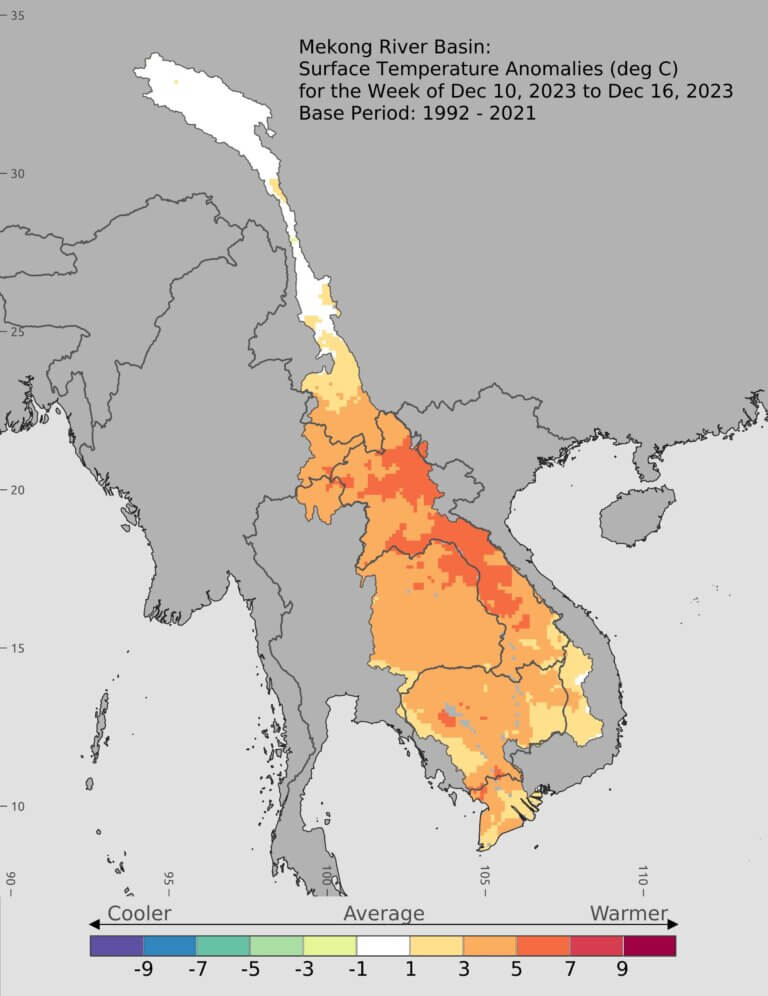
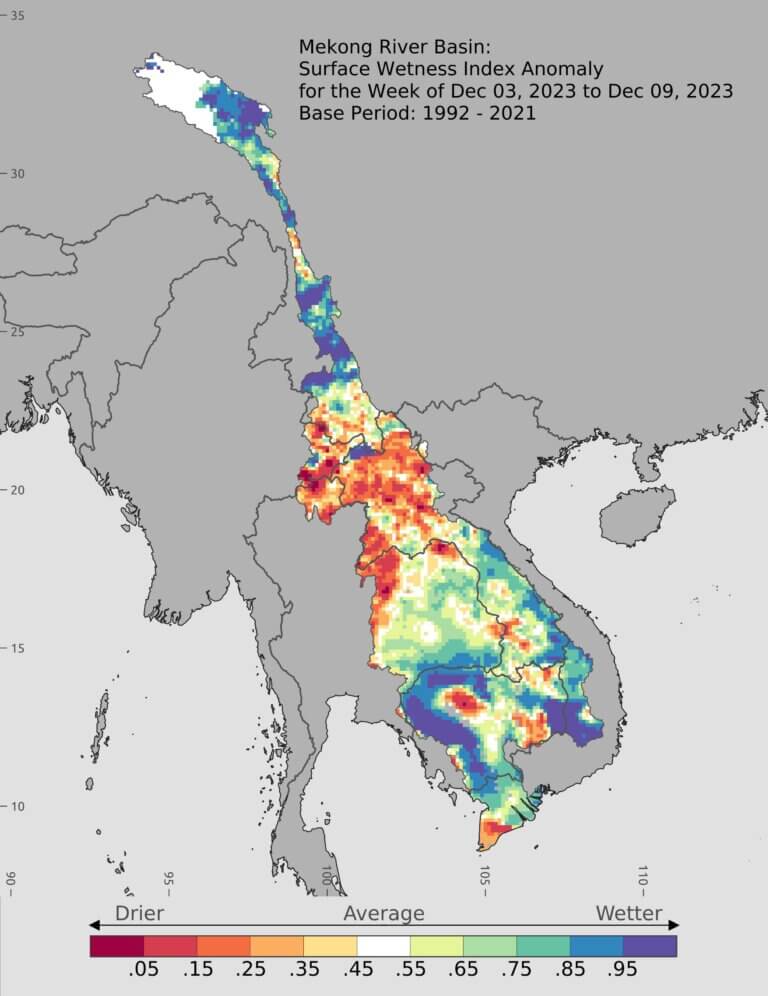
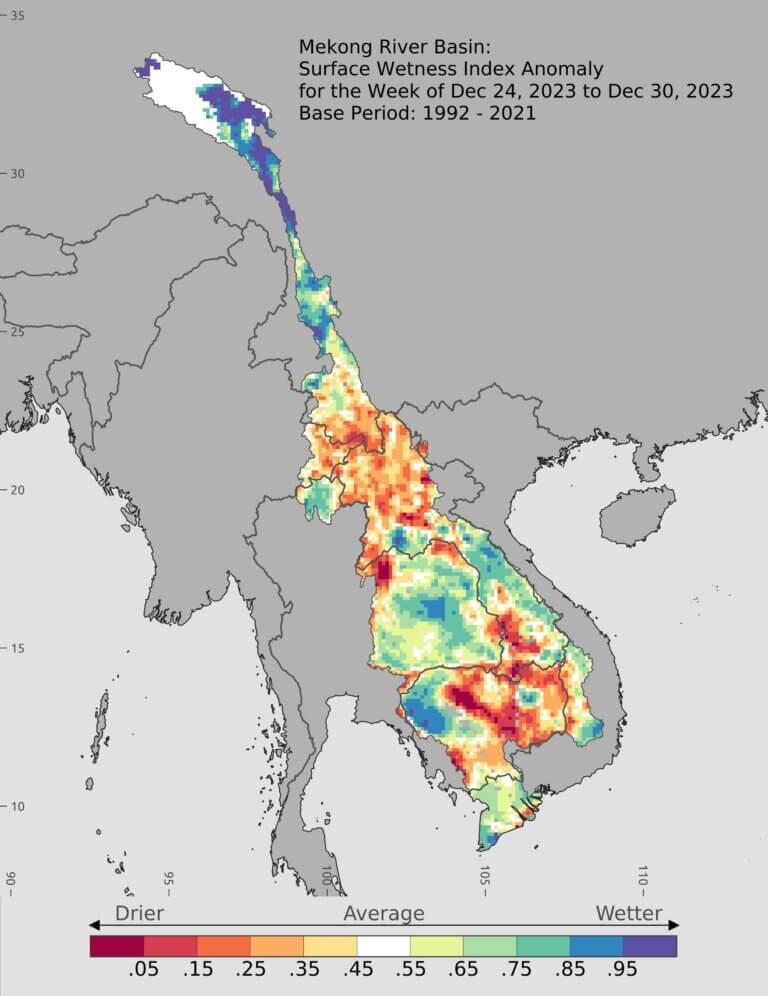
December
![]()
![]()
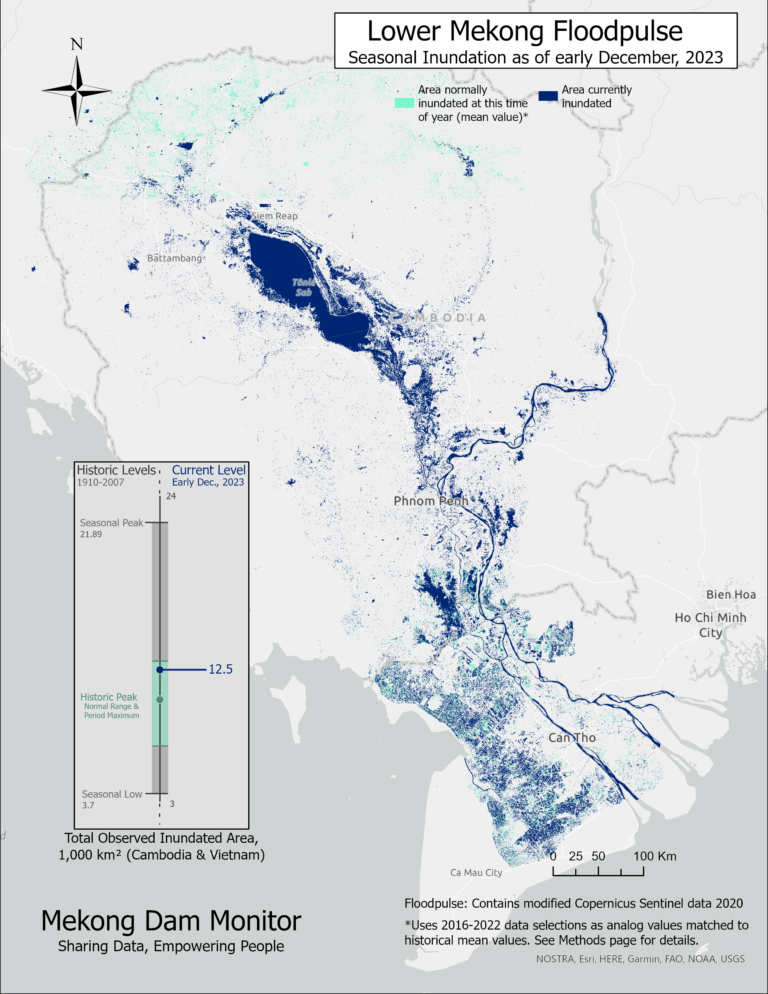
December 2023 marked the first official month of the dry season. Dams had started seasonal releases for hydropower production in the previous month, and those releases continued into December as shown on the colored line graph. At Chiang Saen, flow would have been much lower than normal without additional releases of water from China’s dams. Under natural conditions, flow at Chiang Saen would have been 60% below the long-term average due to a severe lack of natural flow coming out of China. However, the combined natural flow plus dam releases left river levels only about 30% below the long-term average. Farther downstream dam releases lifted river levels closer to normal levels with the greatest effect coming from the Core Lao Dams, which released 1.62 billion cubic meters of water into the river system. The Mekong Floodpulse remained high and within the normal range, partially due to the artificially high river levels which kept more water in the Tonle Sap Lake for an artificially longer period of time.
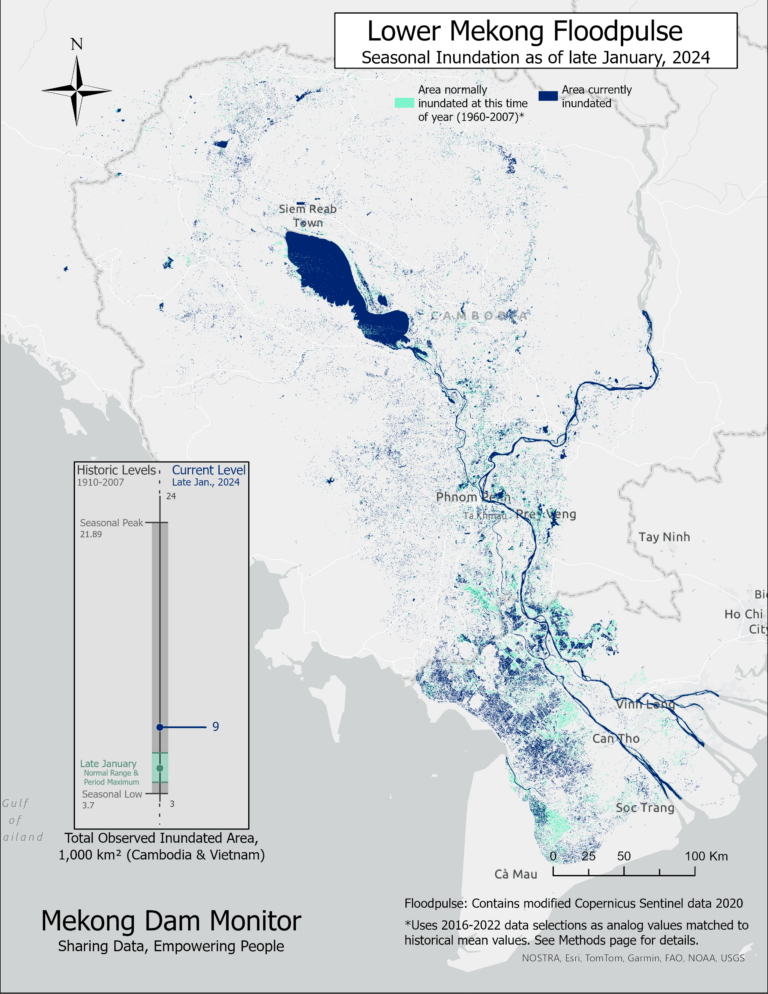
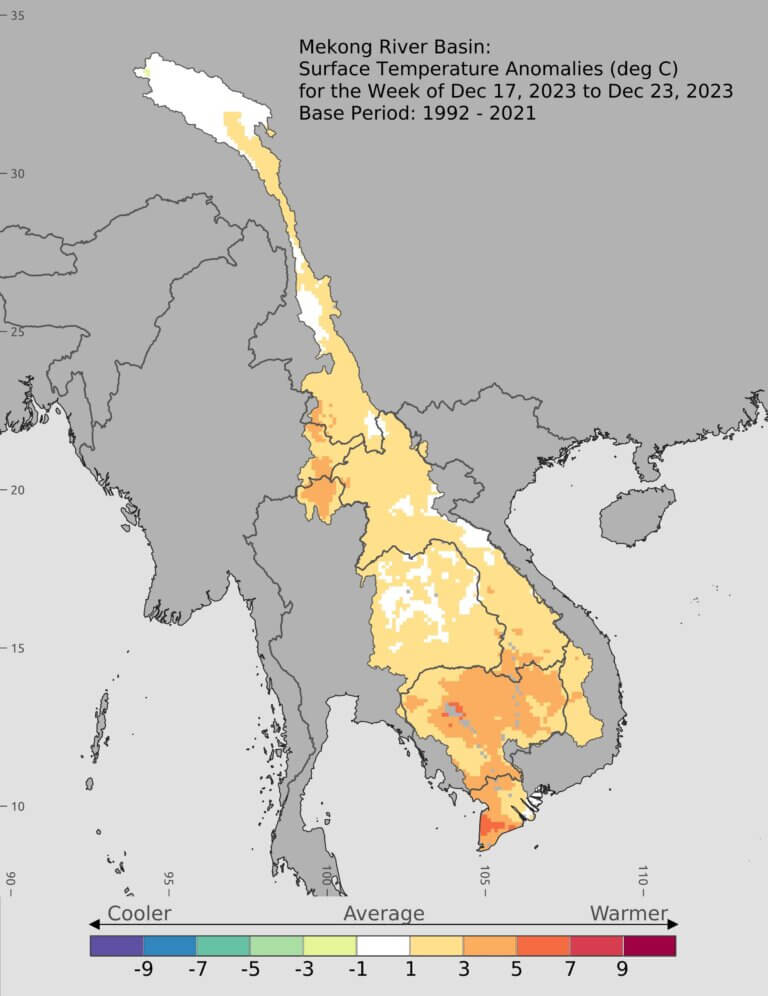
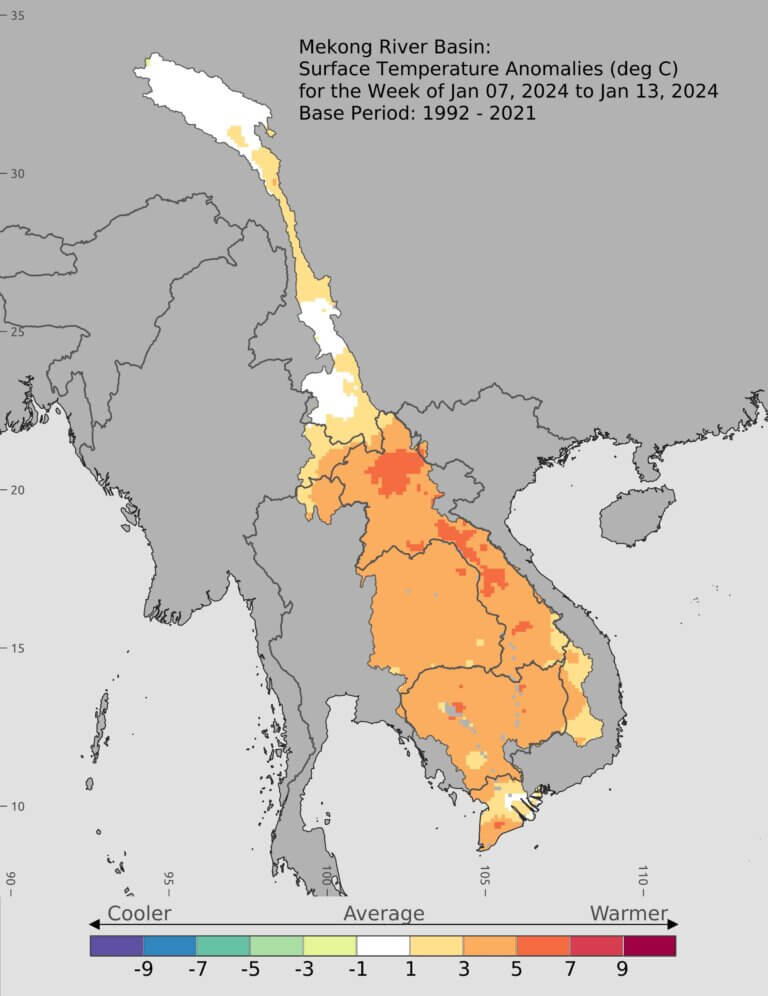
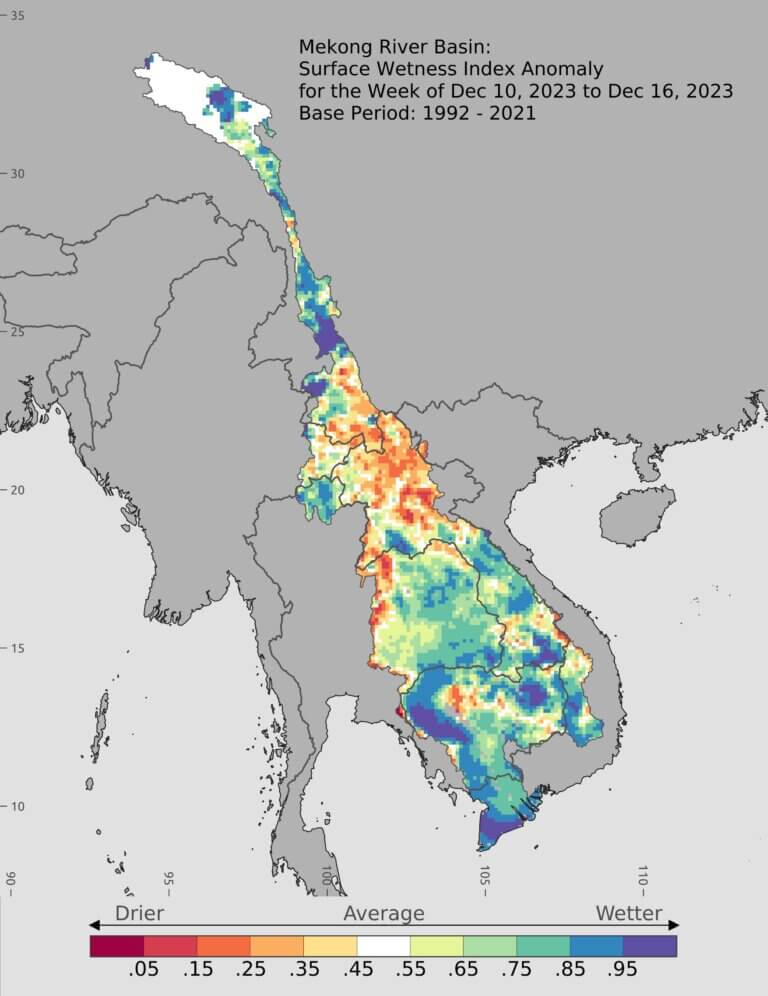
January
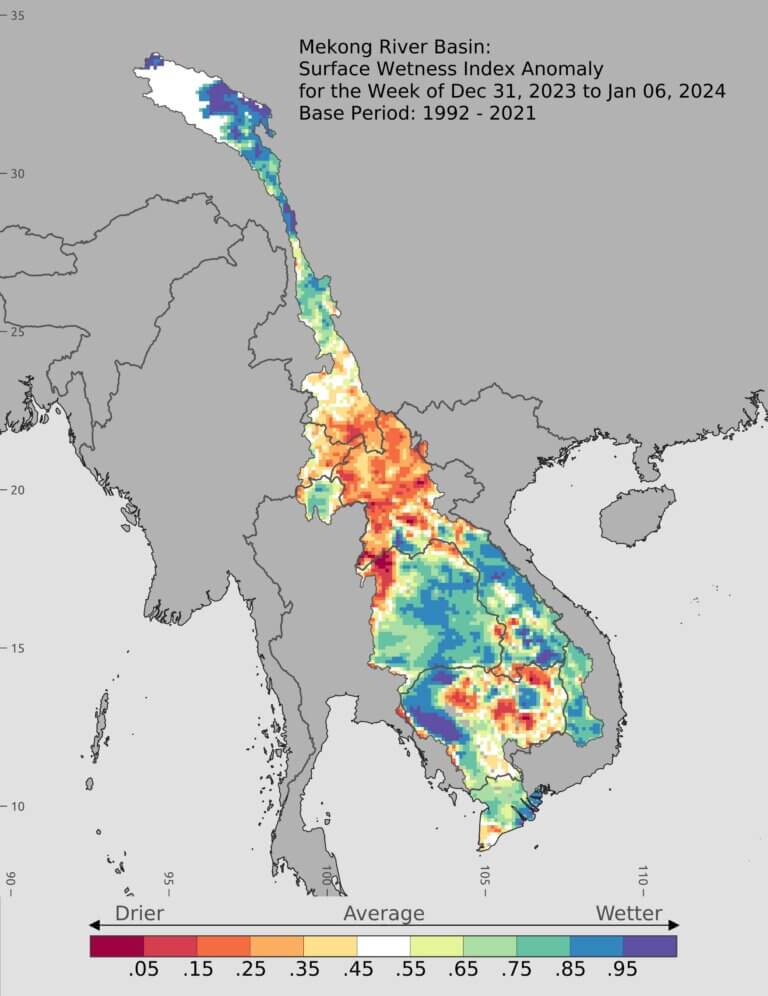
![]()
![]()
![]()
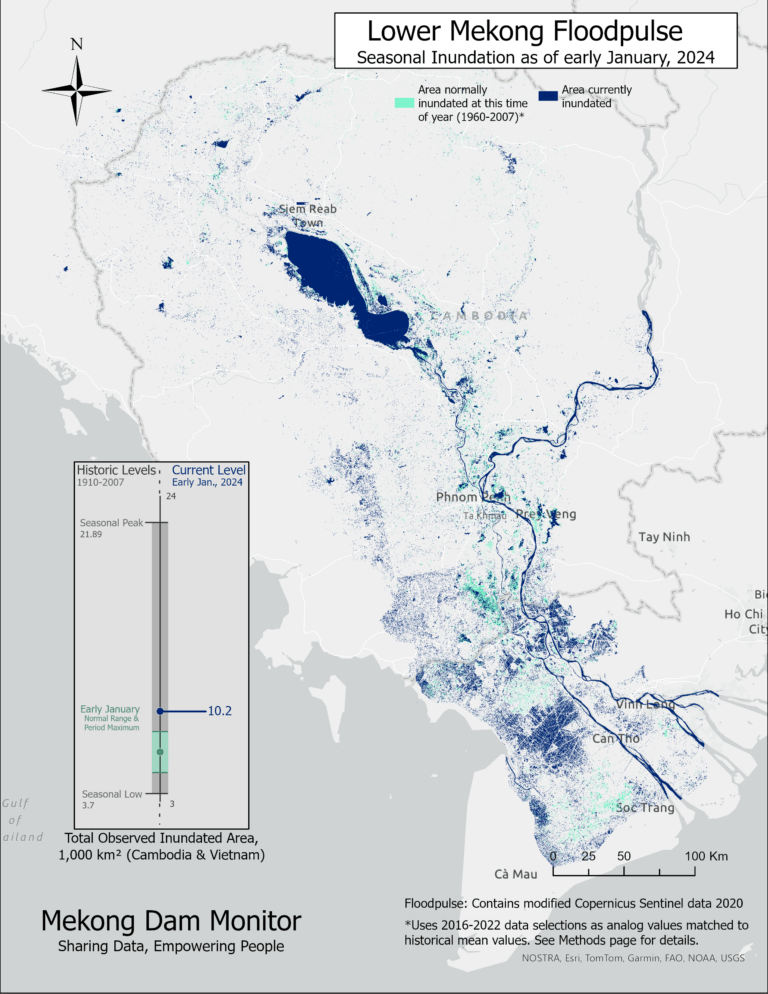
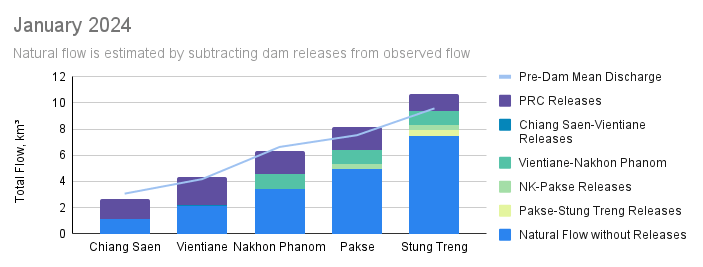
In January 2024, river levels continued to recede as the dry season deepened. The Tonle Sap Lake receded to its normal size, and the “New Perspective” infographic shows the transfer of water from the Tonle Sap to the Mekong Delta downstream. The infographic shows how some of the floodpulse passes from Cambodia through Vietnam and into the Gulf of Thailand instead of out through the river’s major outlets on Vietnam’s East Sea (South China Sea). Some of this is likely guided by irrigation systems in Vietnam. Dam releases played a role in keeping the river level close to normal levels throughout entirety of the basin. Natural Flow would have been more than 50% below normal from Chiang Saen to Nakhon Phanom without the cumulative impacts of dam releases. At Pakse, flow would have been 35% below normal and at Stung Treng, 27% below normal.
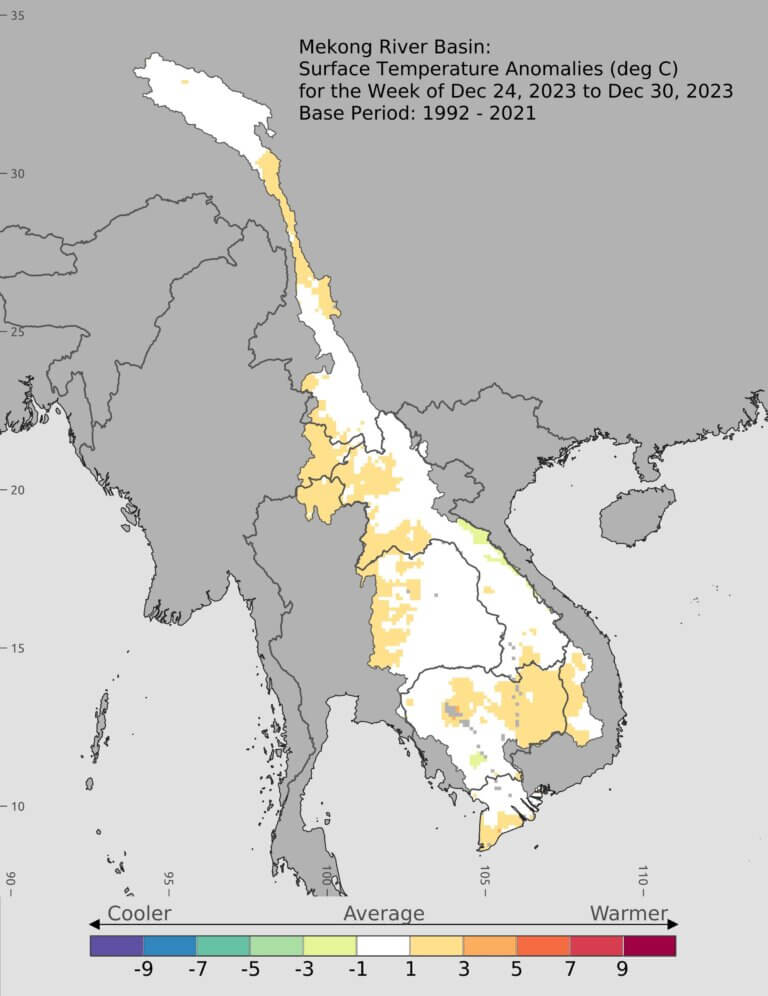
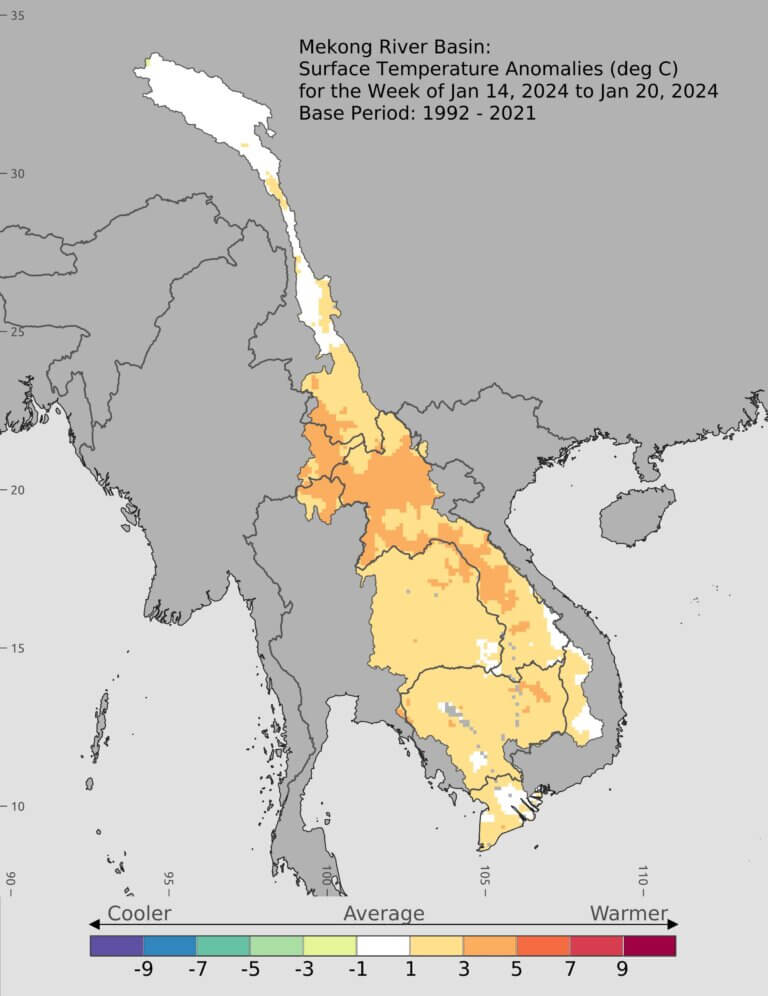
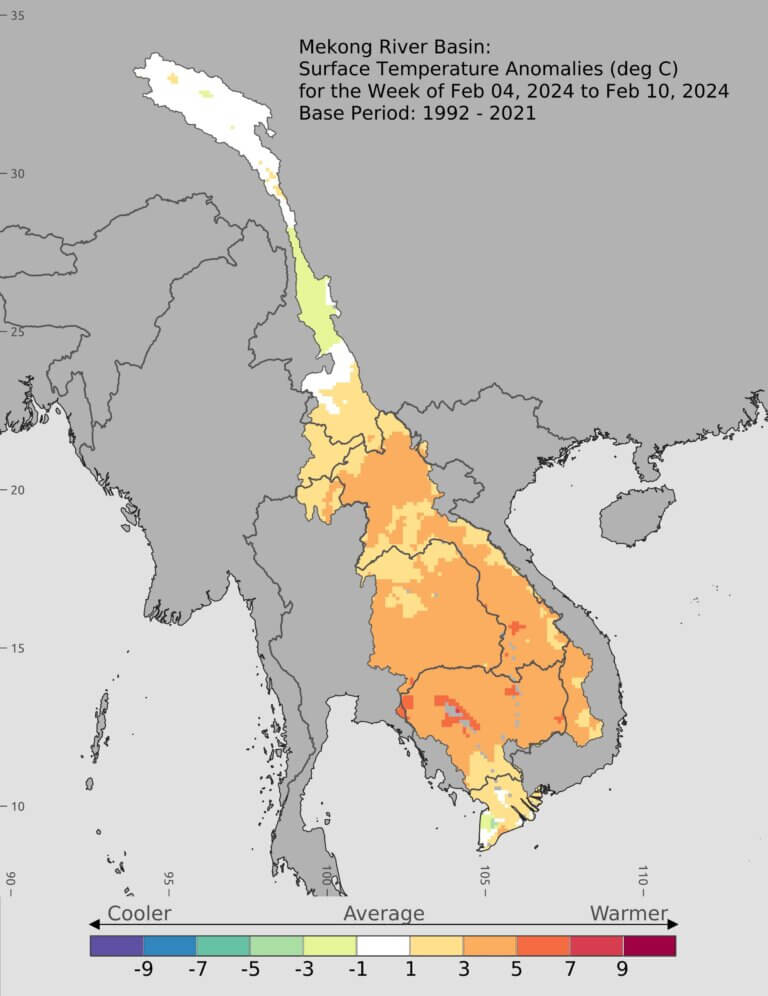
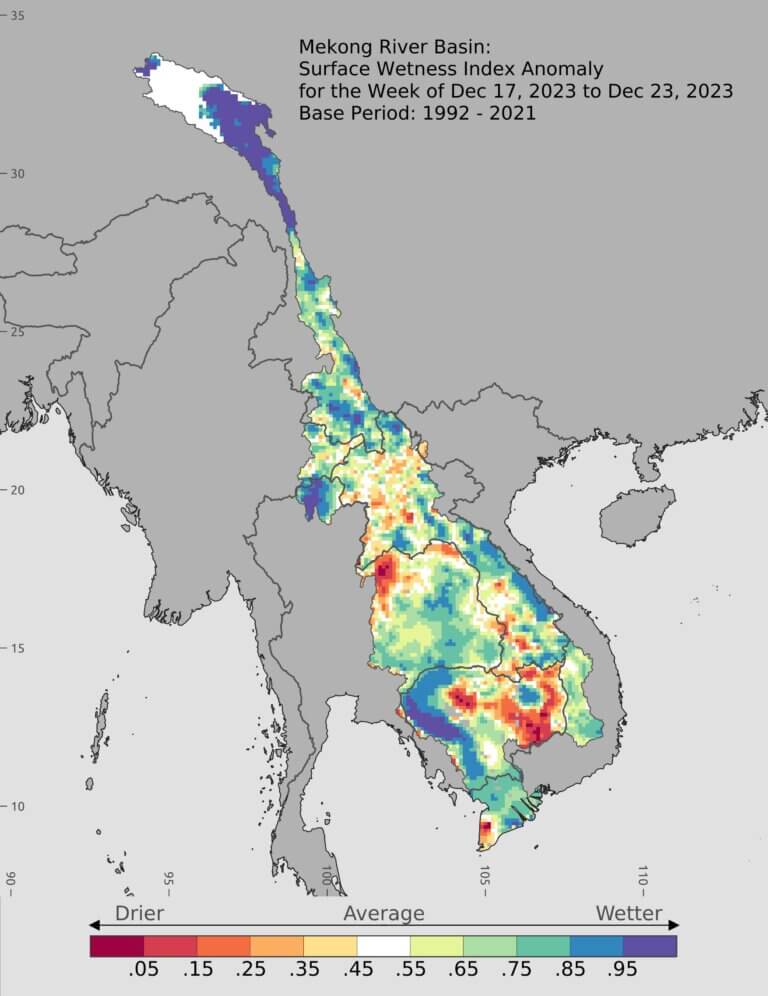
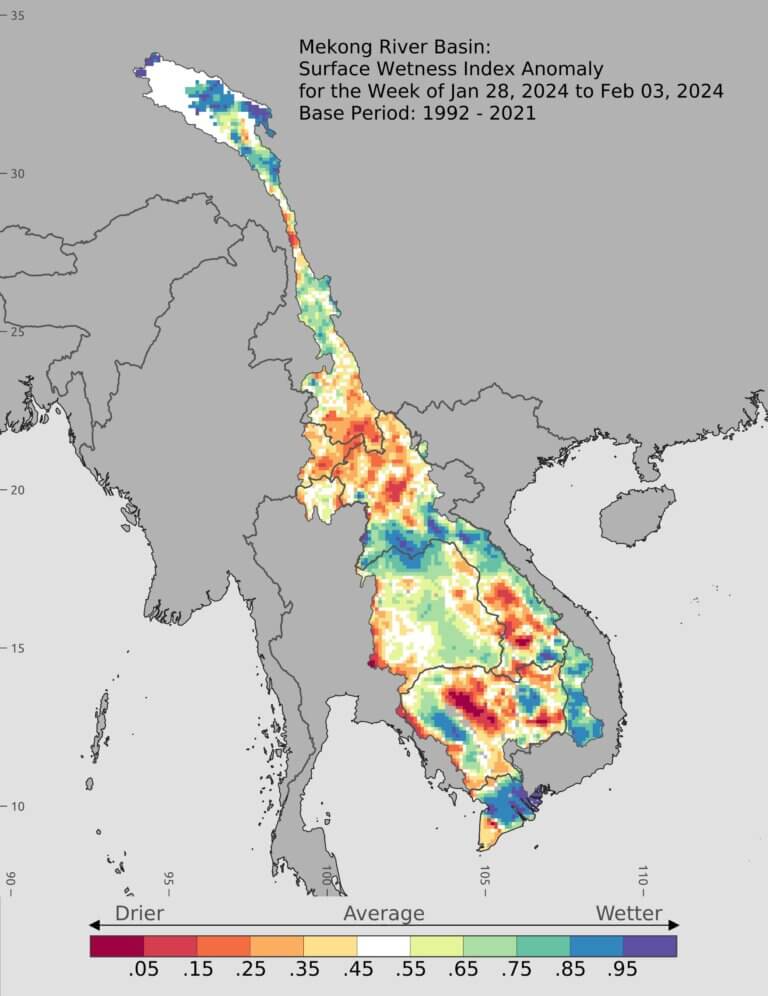
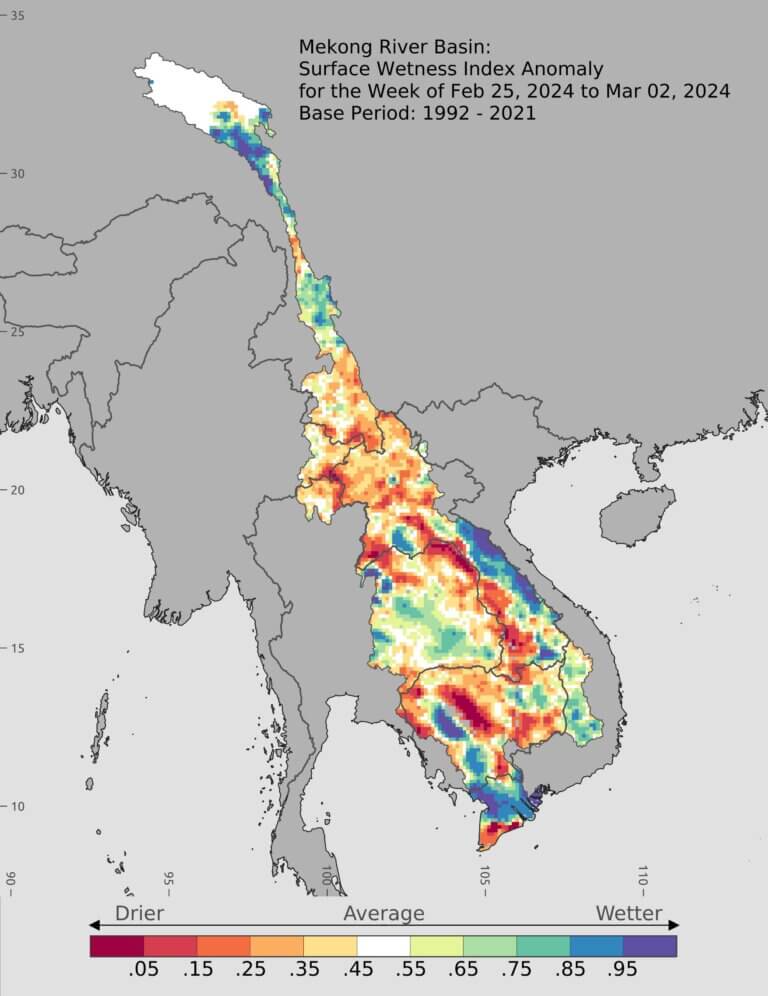
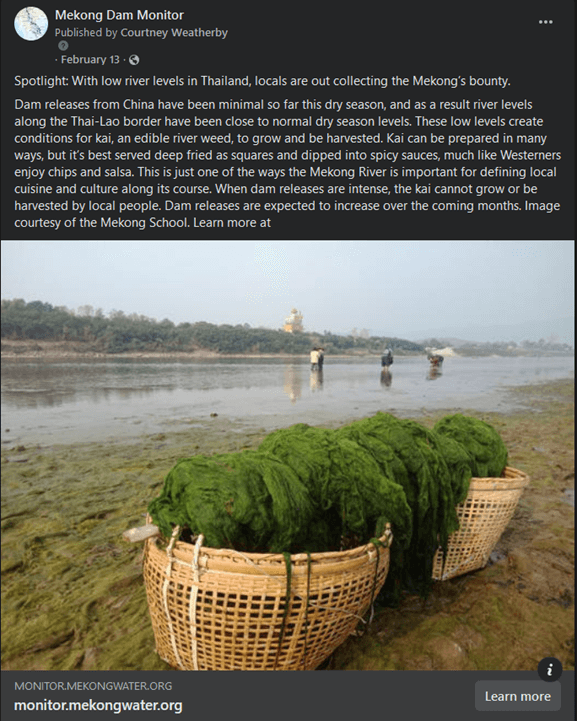
February

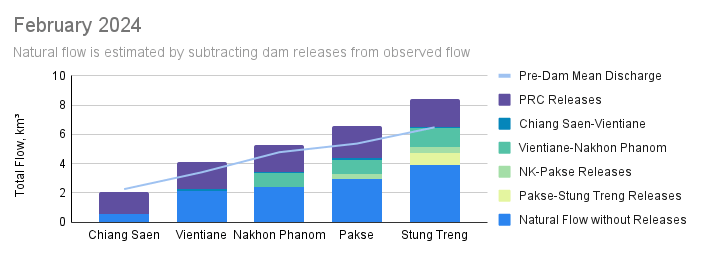
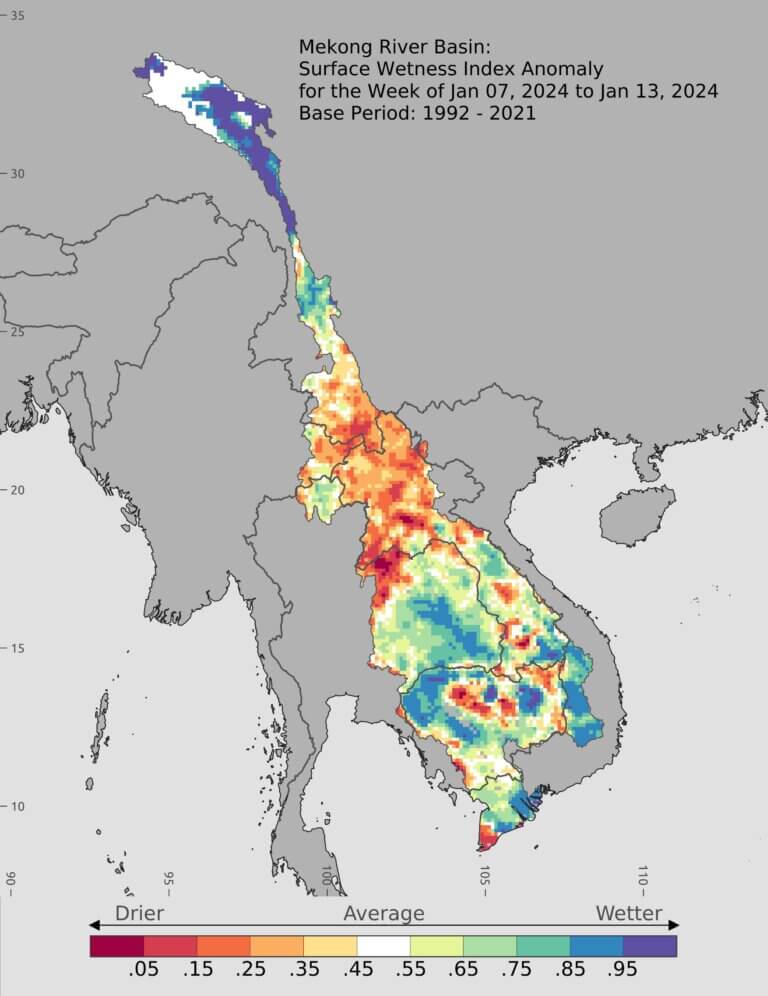
![]()
In February 2024, the normal and low river levels at Chiang Saen promoted a good harvest of kai, a local river weed that can only be harvested during the dry season. The harvested kai is then dried, seasoned, and consumed as food in communities along the Thai-Lao border. In recent years dam releases have driven the river to levels several times higher than normal, so much so that locals had no way to harvest this important local food. Thus in February 2024 low river levels were very much welcomed in this part of the Mekong. The data suggests that the river’s natural flow was significantly low in February, a trend that would continue into the remaining dry season months. This is likely due to poor snowmelt conditions in China’s portion of the basin due to a lack of snowfall accumulated during the 2023 wet season.
Higher temperatures throughout the basin also likely affected groundwater availability, leading to lower-than-normal natural flow levels downstream. However, dam releases lifted the Mekong level to normal levels from Chiang Saen to Nakhon Phanom. While normal levels are beneficial for the Mekong, the dam releases were masking extremely low natural flow conditions. Farther downstream dam releases caused the river to surpass its long-term average level. This is not a desired outcome for the Mekong’s ecology and natural hydrological cycle. The combined effects of dam releases from China and the Core Lao Dams lifted the river level 30% higher than normal in February at Stung Treng, a trend that would continue into the later dry season months. Finally, note in the Mekong Delta how surface wetness is beginning to disappear (it will reappear in March).
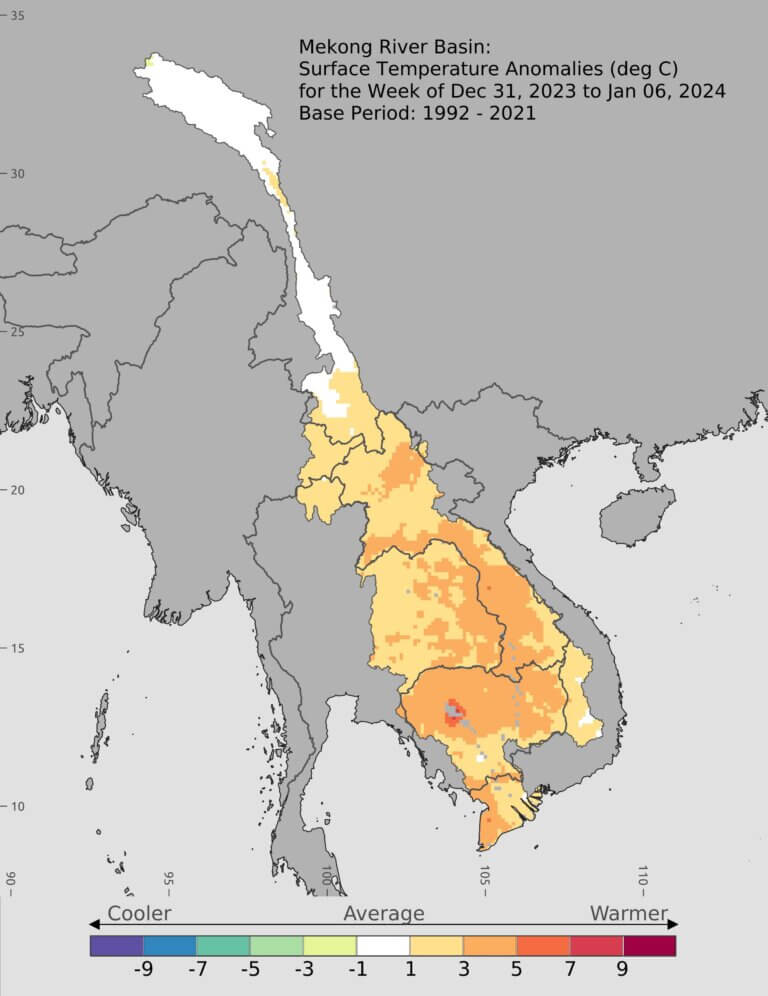
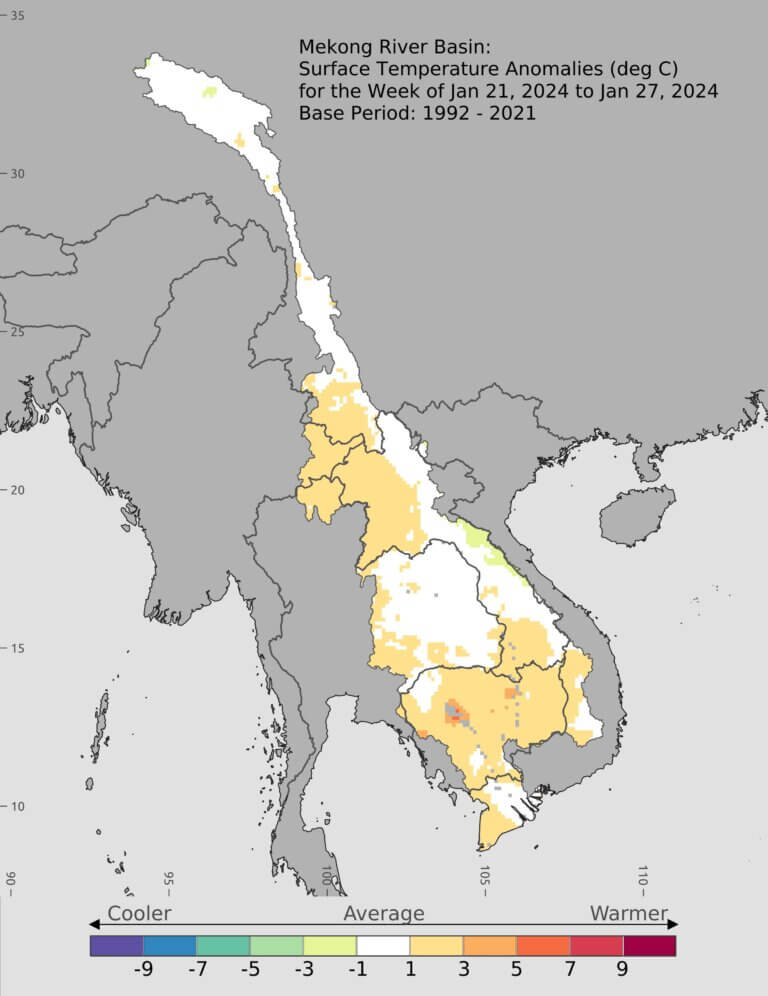
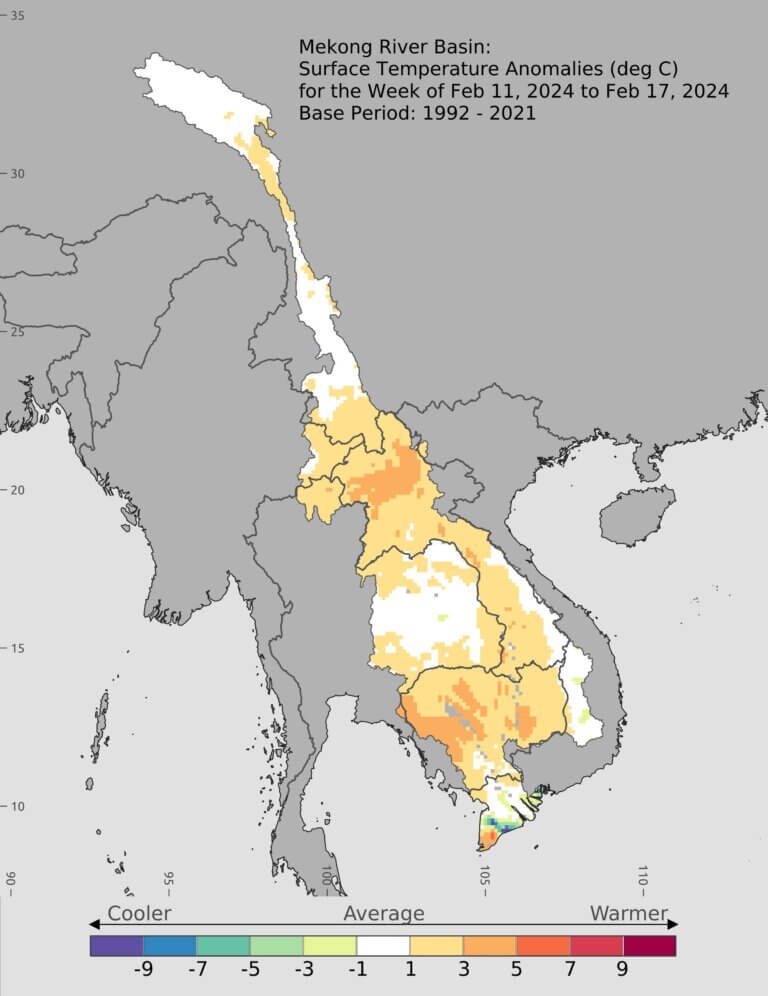
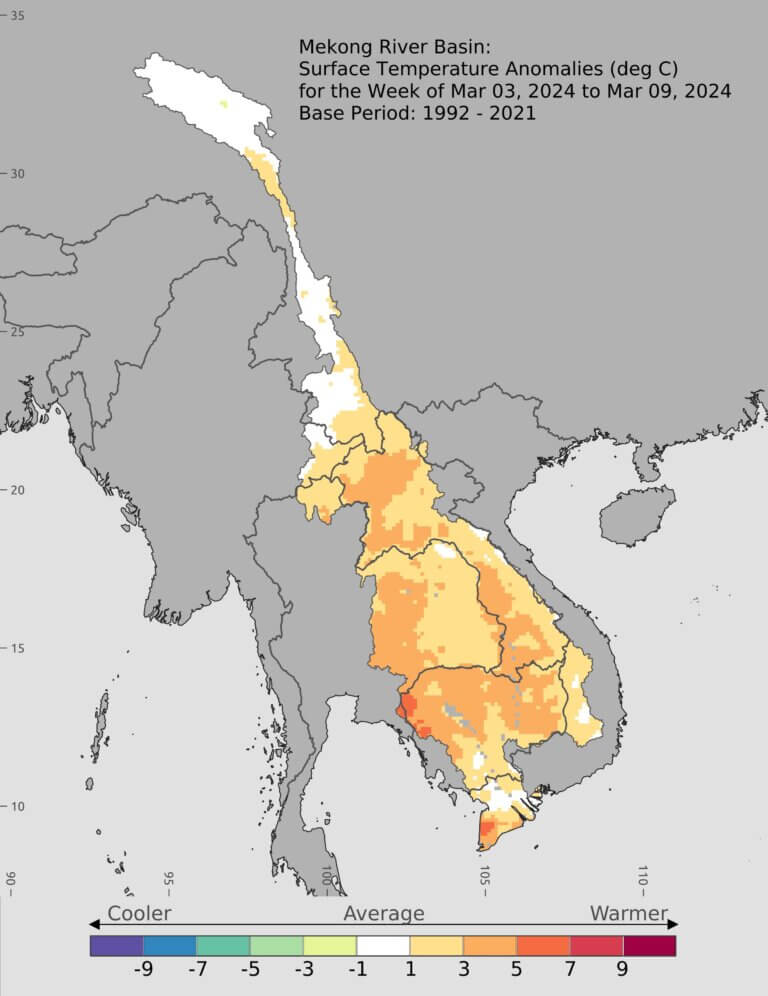
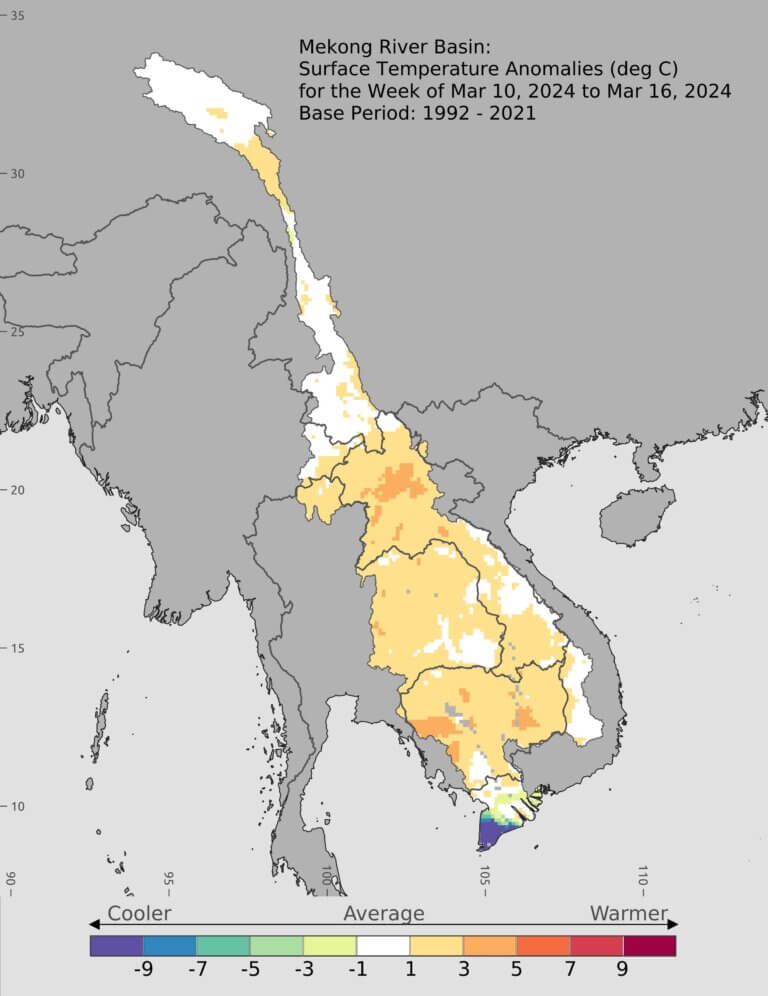
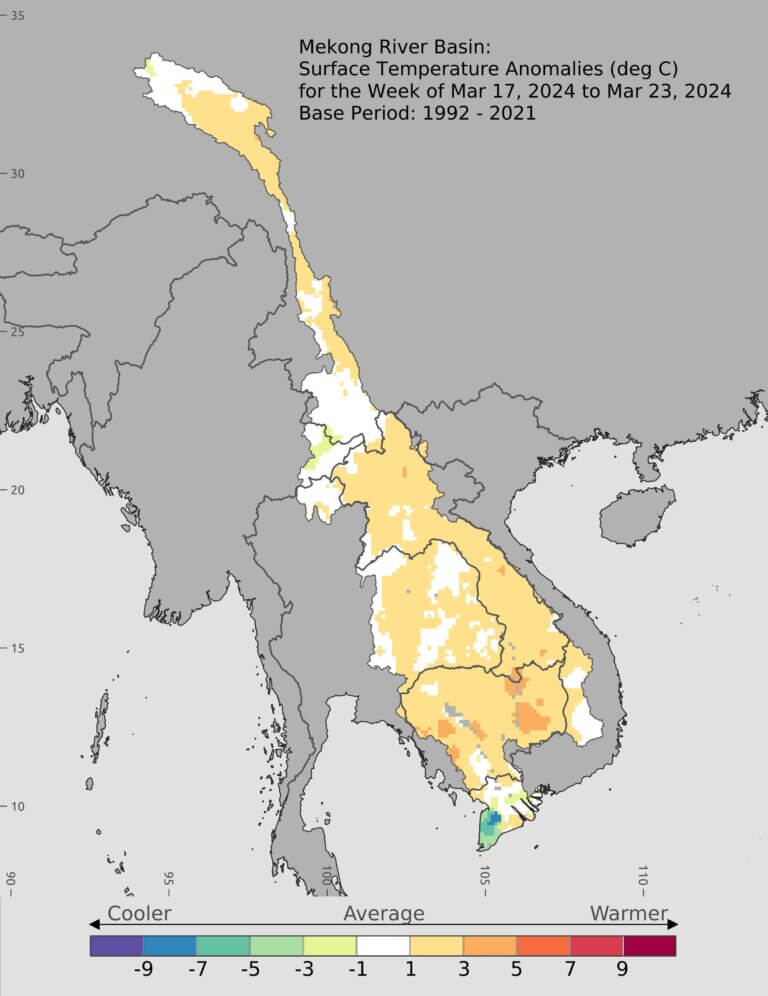
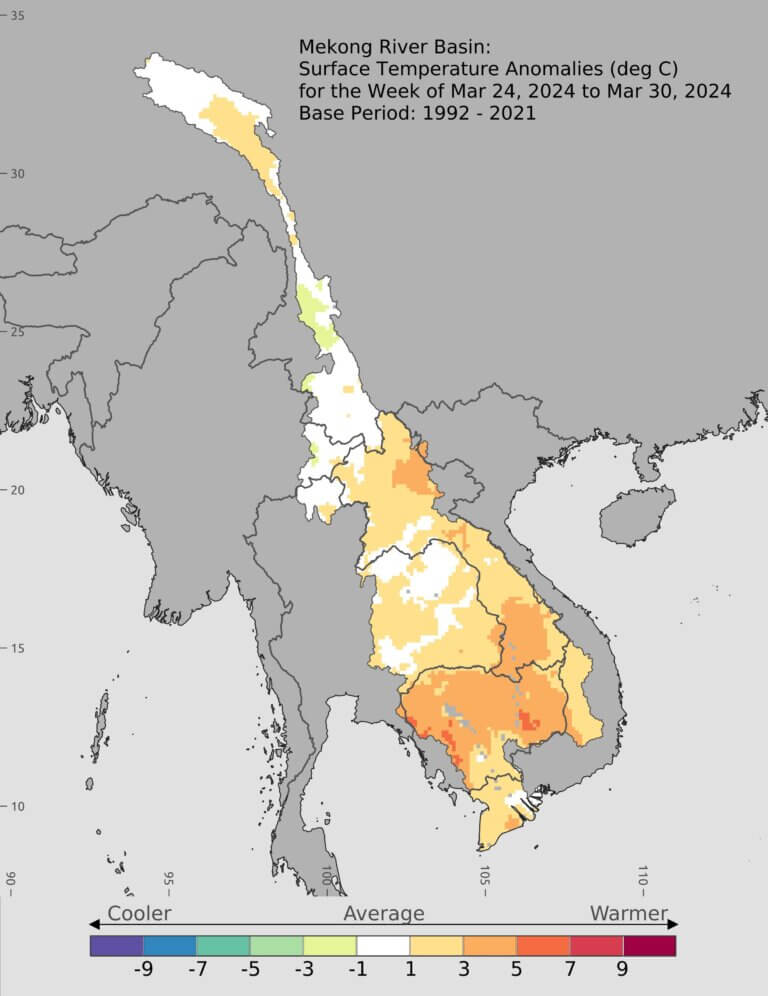
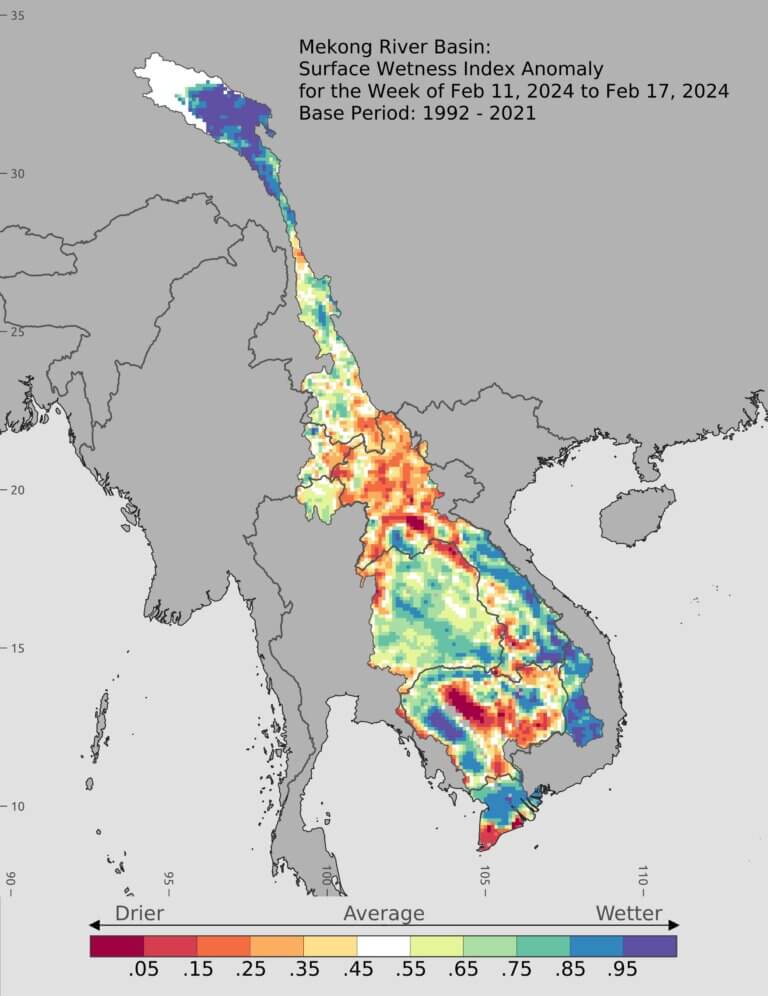
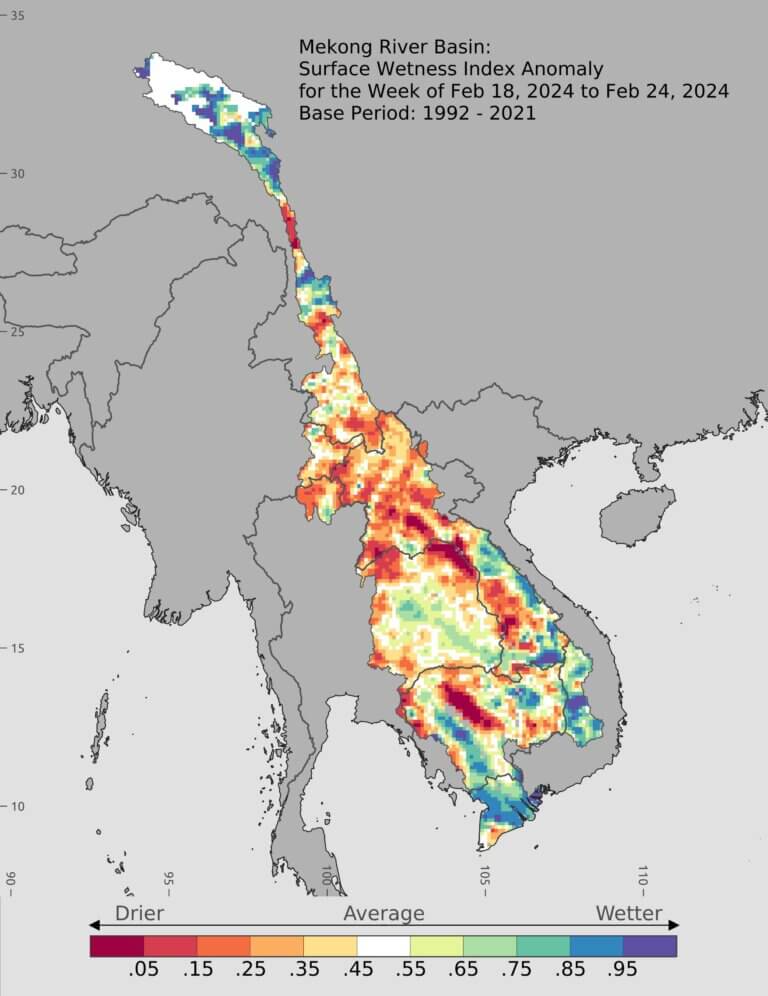
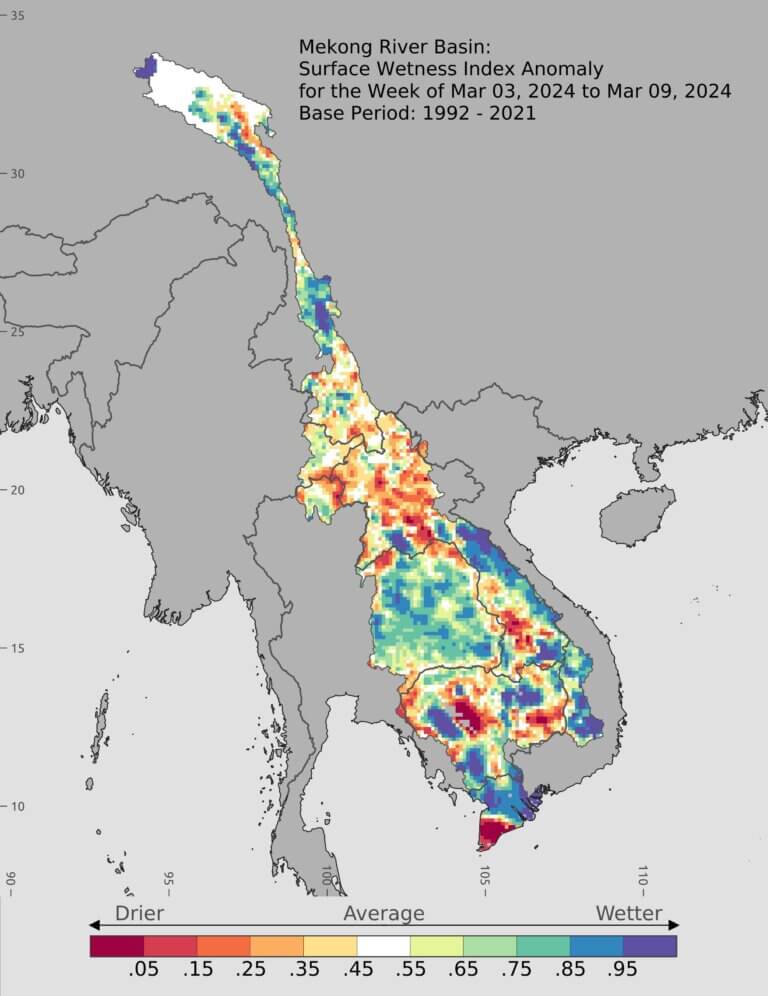
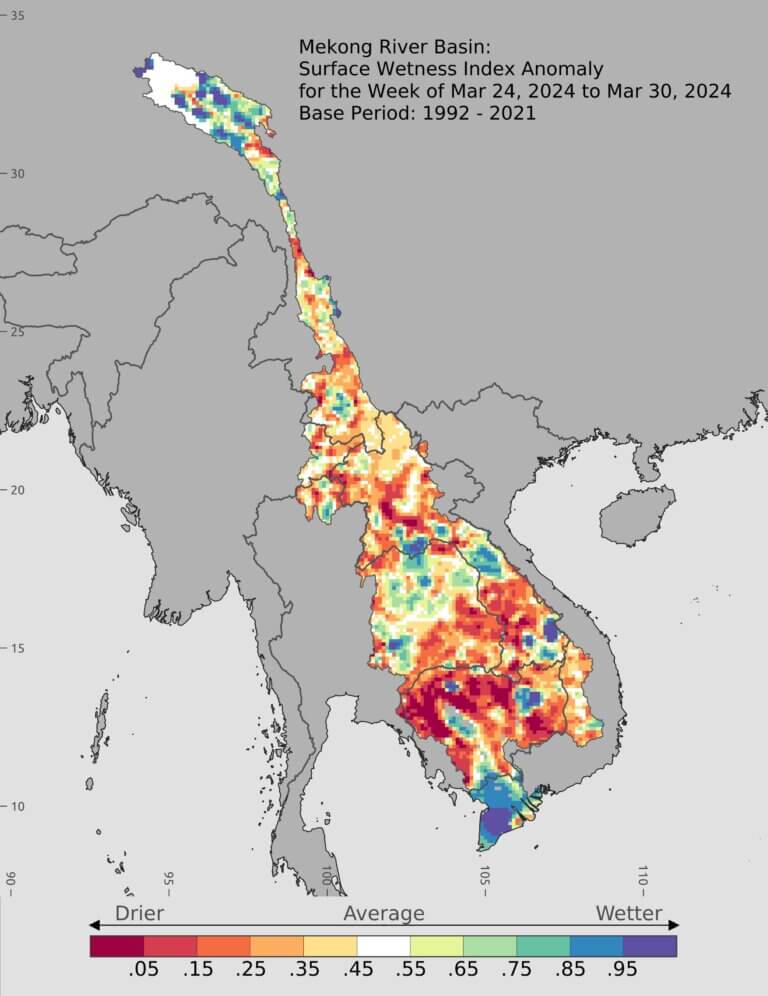
March
![]()
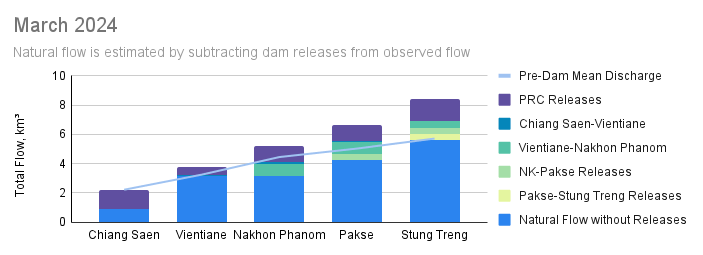
![]()

The river patterns observed in February continued through March. River levels from Chiang Saen to Vientiane were normal or slightly above normal, made possible partially by dam releases. Note the PRC dam releases decrease in quantityarther downstream. This is due to the timing of when those dam releases hit the respective gauge. From Nakhon Phanom to Stung Treng, river flow was much higher than normal due to the cumulative impact of dam releases. At Stung Treng, each grouping of dams (except for those between Chiang Saen and Vientiane) had a relatively equal effect and cumulatively raised the river level to 47% higher than the long-term average – not an ideal outcome. Higher-than-usual temperatures were also beginning to appear throughout the basin, with most of Cambodia experiencing temperatures between 3-5 degrees Celsius above normal. Surface wetness in Vietnam increased as farmers irrigated their fields with river water and ground-pumped water for dry season rice planting.
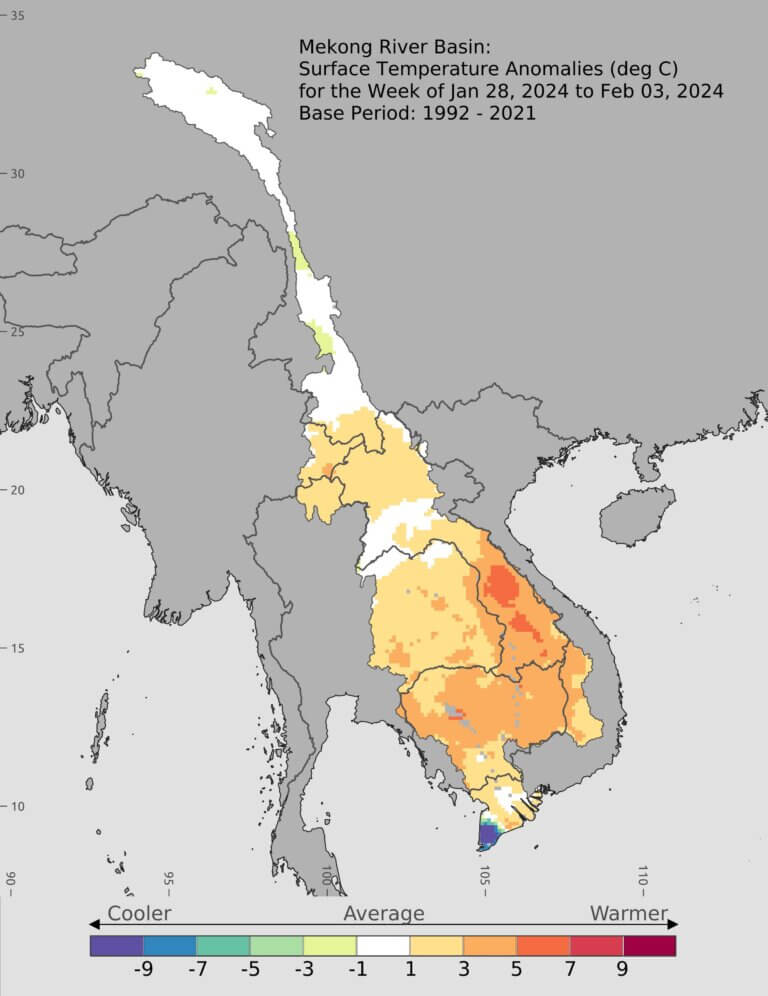
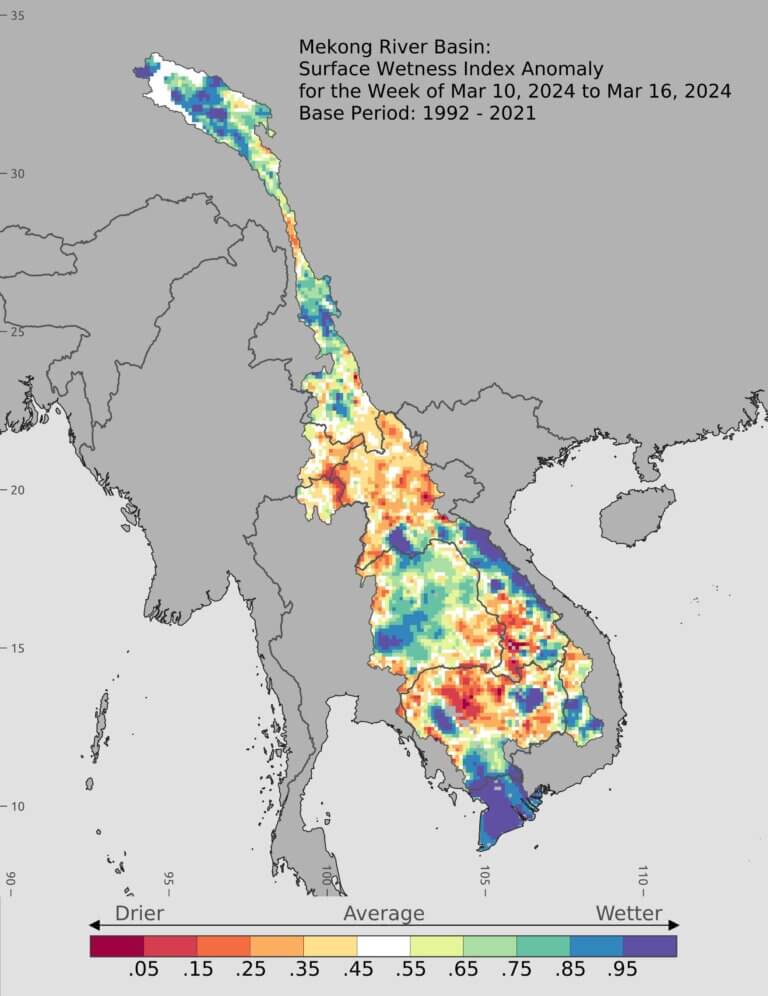
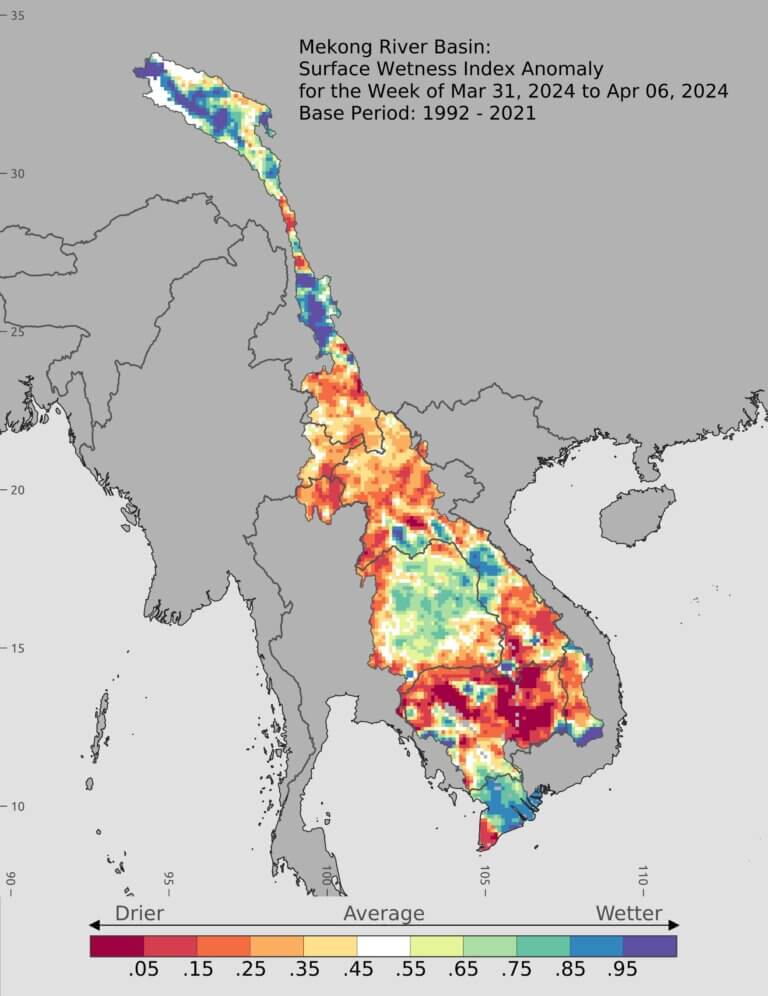
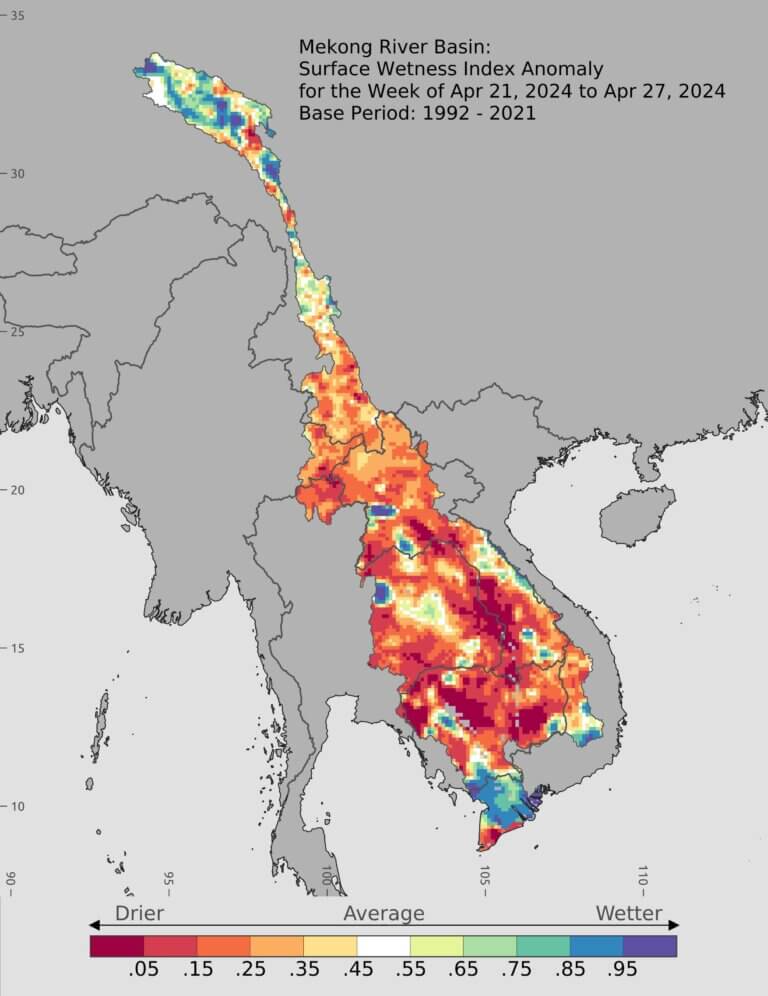
April

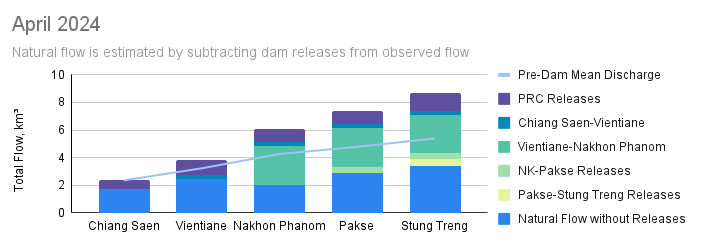
![]()
Natural flow really took a turn for the worse in April according to our estimates, particularly from Nakhon Phanom to points downstream. We estimated that dam releases to Stung Treng totaled 4.8 billion cubic meters, with only about 3.3 billion cubic meters coming from natural flow contribution. These low natural flow levels were again masked by dam releases, which lifted river levels far above normal from Nakhon Phanom to Stung Treng. Despite the artificial lift from dams, river levels were actually much lower than previous years and sparked much conversation throughout the basin. Initially our team had posted that near-normal levels were giving Cambodia’s flooded forest the first chance in a long time to dry out during the dry season. However, conversations with Dr. Ian Baird, a fellow Mekong Watcher with a deep publishing record on a wide range of Mekong issues, led to the real-time confirmation that flow at Stung Treng and Pakse was indeed still significantly higher than normal. In Vietnam’s Mekong Delta, surface wetness lessened and both coastal and interior provinces began to experience drought conditions.
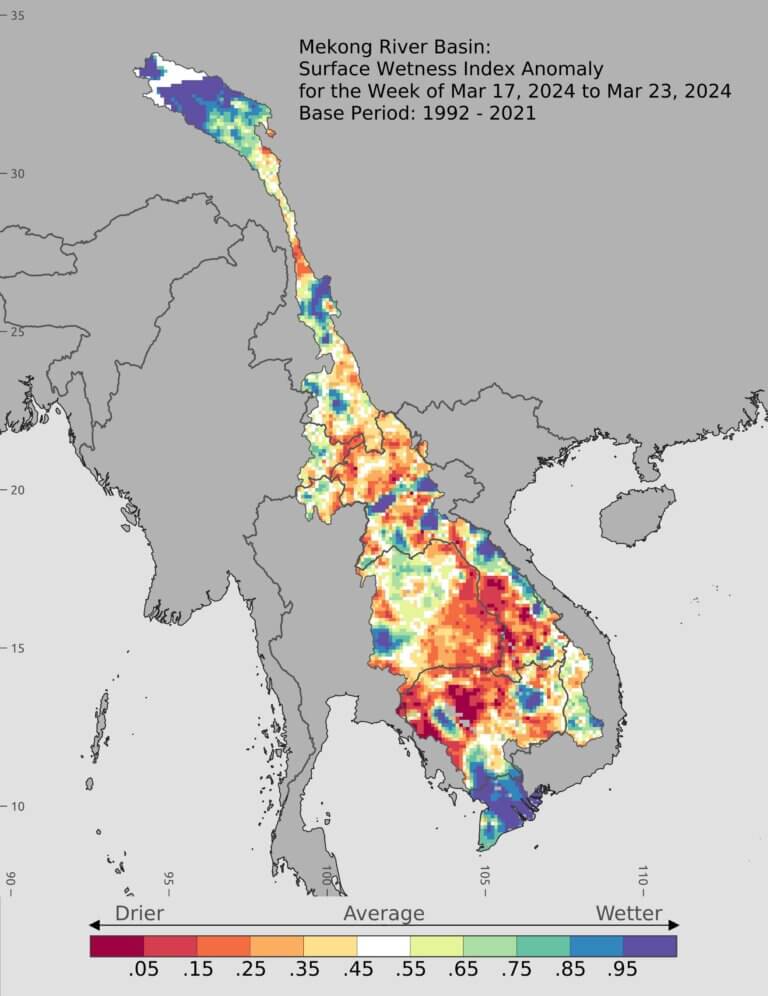
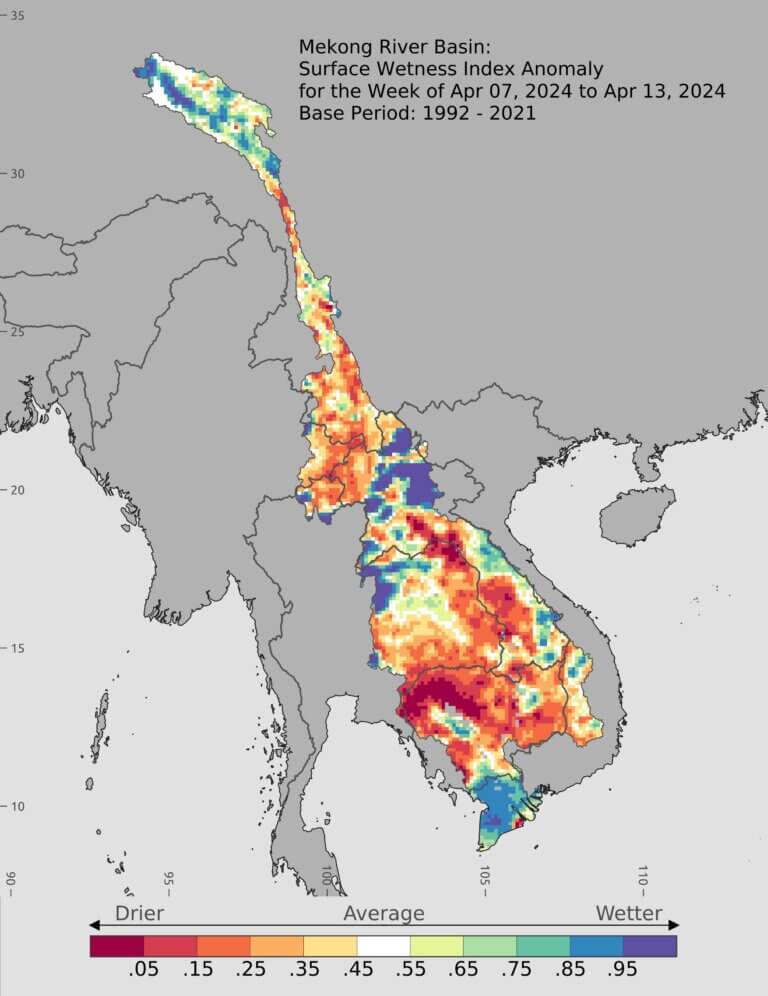
May
![]()
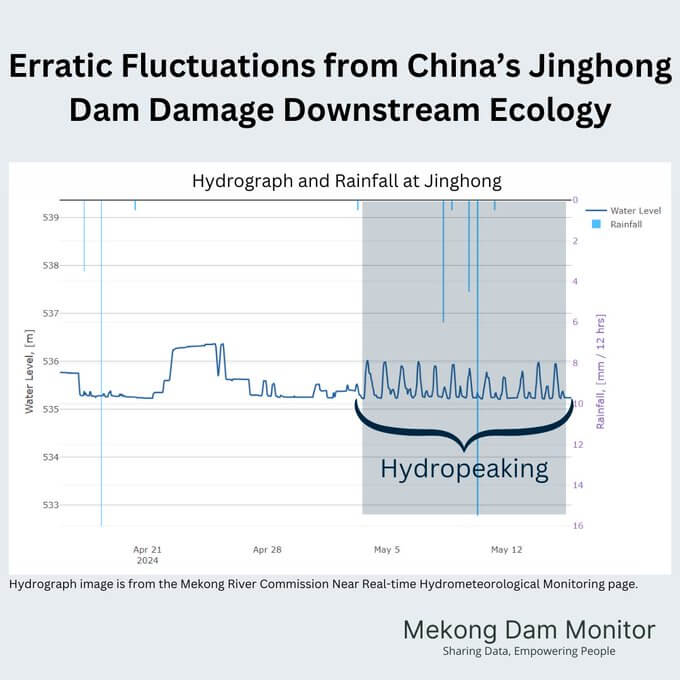
In May, the 2024 dry season ended with extreme temperatures and extreme drought conditions observed throughout the Mekong Basin, except for the far upstream reaches in China where high wetness and precipitation conditions allowed for the filling of both the Tuoba Dam and the Nuozhadu Dam (discussed above). A combination of dam restrictions and dam releases in China resulted in no net change to monthly flow to Chiang Saen, but severe hydropeaking practices were observed with 12 large daily bursts of water out of the Jinghong Dam. High temperatures drove natural flow to extremely low conditions from Nakhon Phanom downstream, but again the river level was buoyed to normal or above normal levels by releases, mostly from Core Lao Dams. At Stung Treng, the cumulative dam releases from upstream dams raised the river to 16% higher than normal.
![]()
![]()
December 2023 marked the first official month of the dry season. Dams had started seasonal releases for hydropower production in the previous month, and those releases continued into December as shown on the colored line graph. At Chiang Saen, flow would have been much lower than normal without additional releases of water from China’s dams. Under natural conditions, flow at Chiang Saen would have been 60% below the long-term average due to a severe lack of natural flow coming out of China. However, the combined natural flow plus dam releases left river levels only about 30% below the long-term average. Farther downstream dam releases lifted river levels closer to normal levels with the greatest effect coming from the Core Lao Dams, which released 1.62 billion cubic meters of water into the river system. The Mekong Floodpulse remained high and within the normal range, partially due to the artificially high river levels which kept more water in the Tonle Sap Lake for an artificially longer period of time.
![]()
![]()
![]()
In January 2024, river levels continued to recede as the dry season deepened. The Tonle Sap Lake receded to its normal size, and the “New Perspective” infographic shows the transfer of water from the Tonle Sap to the Mekong Delta downstream. The infographic shows how some of the floodpulse passes from Cambodia through Vietnam and into the Gulf of Thailand instead of out through the river’s major outlets on Vietnam’s East Sea (South China Sea). Some of this is likely guided by irrigation systems in Vietnam. Dam releases played a role in keeping the river level close to normal levels throughout entirety of the basin. Natural Flow would have been more than 50% below normal from Chiang Saen to Nakhon Phanom without the cumulative impacts of dam releases. At Pakse, flow would have been 35% below normal and at Stung Treng, 27% below normal.
![]()
In February 2024, the normal and low river levels at Chiang Saen promoted a good harvest of kai, a local river weed that can only be harvested during the dry season. The harvested kai is then dried, seasoned, and consumed as food in communities along the Thai-Lao border. In recent years dam releases have driven the river to levels several times higher than normal, so much so that locals had no way to harvest this important local food. Thus in February 2024 low river levels were very much welcomed in this part of the Mekong. The data suggests that the river’s natural flow was significantly low in February, a trend that would continue into the remaining dry season months. This is likely due to poor snowmelt conditions in China’s portion of the basin due to a lack of snowfall accumulated during the 2023 wet season.
Higher temperatures throughout the basin also likely affected groundwater availability, leading to lower-than-normal natural flow levels downstream. However, dam releases lifted the Mekong level to normal levels from Chiang Saen to Nakhon Phanom. While normal levels are beneficial for the Mekong, the dam releases were masking extremely low natural flow conditions. Farther downstream dam releases caused the river to surpass its long-term average level. This is not a desired outcome for the Mekong’s ecology and natural hydrological cycle. The combined effects of dam releases from China and the Core Lao Dams lifted the river level 30% higher than normal in February at Stung Treng, a trend that would continue into the later dry season months. Finally, note in the Mekong Delta how surface wetness is beginning to disappear (it will reappear in March).
![]()
![]()
The river patterns observed in February continued through March. River levels from Chiang Saen to Vientiane were normal or slightly above normal, made possible partially by dam releases. Note the PRC dam releases decrease in quantityarther downstream. This is due to the timing of when those dam releases hit the respective gauge. From Nakhon Phanom to Stung Treng, river flow was much higher than normal due to the cumulative impact of dam releases. At Stung Treng, each grouping of dams (except for those between Chiang Saen and Vientiane) had a relatively equal effect and cumulatively raised the river level to 47% higher than the long-term average – not an ideal outcome. Higher-than-usual temperatures were also beginning to appear throughout the basin, with most of Cambodia experiencing temperatures between 3-5 degrees Celsius above normal. Surface wetness in Vietnam increased as farmers irrigated their fields with river water and ground-pumped water for dry season rice planting.
![]()
Natural flow really took a turn for the worse in April according to our estimates, particularly from Nakhon Phanom to points downstream. We estimated that dam releases to Stung Treng totaled 4.8 billion cubic meters, with only about 3.3 billion cubic meters coming from natural flow contribution. These low natural flow levels were again masked by dam releases, which lifted river levels far above normal from Nakhon Phanom to Stung Treng. Despite the artificial lift from dams, river levels were actually much lower than previous years and sparked much conversation throughout the basin. Initially our team had posted that near-normal levels were giving Cambodia’s flooded forest the first chance in a long time to dry out during the dry season. However, conversations with Dr. Ian Baird, a fellow Mekong Watcher with a deep publishing record on a wide range of Mekong issues, led to the real-time confirmation that flow at Stung Treng and Pakse was indeed still significantly higher than normal. In Vietnam’s Mekong Delta, surface wetness lessened and both coastal and interior provinces began to experience drought conditions.
![]()
In May, the 2024 dry season ended with extreme temperatures and extreme drought conditions observed throughout the Mekong Basin, except for the far upstream reaches in China where high wetness and precipitation conditions allowed for the filling of both the Tuoba Dam and the Nuozhadu Dam (discussed above). A combination of dam restrictions and dam releases in China resulted in no net change to monthly flow to Chiang Saen, but severe hydropeaking practices were observed with 12 large daily bursts of water out of the Jinghong Dam. High temperatures drove natural flow to extremely low conditions from Nakhon Phanom downstream, but again the river level was buoyed to normal or above normal levels by releases, mostly from Core Lao Dams. At Stung Treng, the cumulative dam releases from upstream dams raised the river to 16% higher than normal.
What’s New on the Mekong Dam Monitor
Three Newly Tracked Dams
This year the MDM began publishing data and information on three dams that became operational after the launch of the MDM. The Tuoba Dam, China’s 12th and newest Mekong mainstream dam with 258 million cubic meters of active storage became operational in February 2024. Nam Ou 7 is the largest of a cascade of seven dams in Laos with an estimated active storage of 1.4 billion cubic meters and became operational in 2021. Nam Theun 1 in Laos ranks 6th largest in the Mekong, has an estimated active storage of 2.02 billion cubic meters, and began operations in 2021. Their combined active storage (3.67 billion cubic meters) increases the estimated total storage capacity of the Mekong’s 60 largest reservoirs by 7%. Currently we estimate the 60 largest dams in the Mekong Basin hold 54.5 billion cubic meters of active storage. Learn more about these dams on the MDM platform’s virtual gauges tabs. Figure 31 below shows an interactive timeline of dam and reservoir storage development divided between the five MDM monitored sub-basins.
Figure 31: Active Storage of the Largest Mekong Dams Time Series
Chiang Khan Natural Flow Model Replaces Vientiane’s NFM
We noticed some discrepancies in the MRC data for the Vientiane gauge which was used to inform the natural flow model (NFM) for Vientiane. A next best option is the Nong Khai, Thailand gauge, which is located a few kilometers from the Vientiane gauge on the opposite side of the river. Yet the Nong Khai gauge data also has some data reliability issues for reasons unknown to us.
To keep focus on the impacts of dams in northern Laos to a gauge in central Laos, we chose to develop a new natural flow model for Chiang Khan, Thailand located about 100km upstream from Vientiane. There are no dam impacts to observe between Chiang Khan and Vientiane, so Chiang Khan can serve as a good gauge for this purpose. Chiang Khan has a continuous 60+ year data set to inform the development of the natural flow model. The resulting NFM applies incremental estimations of natural flow in the sub-watershed in Laos and Thailand located between Chiang Saen and Chiang Khan on top of natural flow estimations for the watershed above Chiang Saen. The Chiang Khan NFM has an adjusted R-squared value of 95, meaning 95% of the variance in river flow can be explained by the model.
Teaching the MDM Toolkit
As more scientists and professionals throughout the Mekong become interested in remote sensing for water monitoring, the MDM team has become active in teaching our toolkit to build capacity for partnerships or new innovative methods of water and climate monitoring in the Mekong among local stakeholders. Over the last year, the team has held remote sensing capacity building workshops hosted by the Institute of Technology Cambodia and Chiang Mai University. These workshops were sponsored by the U.S. Department of Interior’s Ambassador’s Water Expert Program and each has resulted in the development of new, co-collaborative projects that can deliver positive impact to the sustainable development of the basin. Learn more about this effort in this field note penned by MDM co-leads Alan Basist and Regan Kwan about their recent training at Chiang Mai University.
Use the arrows to navigate through all the photos


The Mekong Dam Monitor team and workshop participants in Phnom Penh and Chiang Mai.
New Web Resources Webinars, and Media Mentions
Web Resources
Webinars
- Where’s the Water Wet Season 2023
- Where’s the Water Dry Season 2024
- Mekong Water Data Hour: Dam Development and Fish Biodiversity Loss
- Mekong Water Data Hour: Plastic Pollution
- Mekong Water Data Hour: Remote Sensing and Hydrological Modelling
Major Media Mentions
[table “” not found /]What’s Next for the MDM
The MDM will continue its regular activities over the 2024-2025 wet-dry season cycle and provide a report like this one after the conclusion of the 2025 dry season. The MDM team will continue its seasonal “Where’s the Water” webinar series, as well asthe “Mekong Water Data Hour” series which highlights newly published data-driven research on the Mekong. We actively continue to develop new partnerships and seek to plug our data and services into newly developed, hyper-localized smartphone applications which can provide decision support to fishers, farmers, and local community people who rely on the river for their livelihoods. To learn more about how we would like to localize our MDM efforts, please read our recent 2024 progress report. The MDM would benefit from additional resources to improve our natural flow modeling and dam impact analysis to a weekly or even sub-weekly time-step and also build out a complete archive of dam operations for all 60 dams monitored from 2016 onwards. Currently our complete archive starts in August 2021. Please contact us if you are interested in building partnerships or contributing to our efforts.
Acknowledgements
The MDM team is grateful to the U.S. Department of State’s funding of the Mekong Dam Monitor efforts from 2020-2024. Without sustained MDM core funding from the Mekong-U.S. Partnership’s Mekong Water Data Initiative over this period, local stakeholders and decision makers would have much less understanding about how dams are altering the Mekong’s natural flow and changing livelihoods. We are also grateful to the Chino Cienega Foundation (CCF), which has supported the MDM from day one and over a decade ago dreamed that an online platform like the MDM could be made possible. CCF will remain a dedicated funder of the MDM effort into the long term. This report goes through a rigorous peer review process, and we express thanks and gratitude to the invaluable feedback from multiple reviewers. As always, we are thankful for official data on river conditions and dam operations provided via publicly available portals by the Mekong River Commission and government agencies in Thailand, Vietnam, and the Lao PDR.