
Executive Summary
Coastal cities are at the forefront of the climate emergency. Rising sea levels, extreme weather events, and warming temperatures are amplifying the vulnerability of city residents, even as migration to coastal cities increases. Over the next decade, the global population is expected to increase to ten billion, with about 40 percent of the world’s population living within 100 kilometers of the coast.1UN, “Factsheet: People and Oceans,” The Ocean Conference, United Nations, New York, June 5-9, 2017. Climate change can act as a threat multiplier, exacerbating underlying social tensions, which in turn undermine peace and security.2For an example of NGO articulation of climate security see Greenpeace, “Climate Change as a Security Threat,” Munich Security Conference, February 2019. Climate-related risks, intersect with existing social, economic, and political vulnerability to degrade economic, food, and environmental security. In this environment, decision makers in coastal cities, international financial institutions, insurers, and regulators need localized risk information that prioritizes specific areas for action amongst these diverse security threats.
Recognizing the interrelated and cascading nature of physical changes, environmental degradation, and demographic shifts, there is a demand for tools by governments, international institutions, and the private sector to help them quantify threats to sustainable development.3Jonathan Woetzel, Dickon Pinner, Hamid Samandari, Hauke Engel, Mekala Krishnan, Brodie Boland, and Carter Powis, Climate Risk and Response: Physical hazards and Socioeconomic Impacts, McKinsey Global Institute, January 2020. In response, the Stimson Center has developed the Climate and Ocean Risk Vulnerability Index (CORVI). CORVI is an innovative tool which compares a diverse range of risks to produce a coastal city risk profile. This city assessment identifies areas of greatest risk and channels investment to build resilience where it is needed most. By combining empirical and expert survey data to measure ecological, financial, and political risk across 10 categories and 96 indicators, CORVI gives critical insights into the challenges cities face. This focus on local data collection sets CORVI apart from other climate risk indices, such as the Lloyds City Risk Index, which focuses on market losses from risk events.
Climate and ocean risks confronting coastal cities include sea-level rise, higher intensity weather events, degraded ecosystems, and declining fish populations. More severe droughts threaten agricultural activity, can increase migration to coastal urban areas, and harm the food security of coastal urban areas which rely on these breadbaskets.4For more information on the impact of climate change on food and economic security in the Caribbean, see UNFAO, “Drought Characteristics and Management in the Caribbean,” FAO Water Reports No. 42 (2016), https://www.fao.org/3/a-i5695e.pdf. Ongoing trends such as migration towards coastal regions and continuing coastal development can adversely affect coastal areas if not managed in a sustainable way.5G Hugo, “Future Demographic Change and its Interactions with Migration and Climate Change,” Global Environmental Change 21, Supplement 1 (2011): 21–33. In addition, demographic and socio-economic factors such as poverty and informal housing settlements make certain populations and places more vulnerable to coastal climate events such as sea-level rise and flooding.
What is CORVI?
In this environment, leaders need to better understand the impacts of climate change and integrate climate fragility risks into their decision making to help prioritize actions.
- For GOVERNMENTS, CORVI is a tool to quantify the threat posed by climate change, prioritize actions, devise innovative policy solutions, and attract international funding to build resilience.
- For PUBLIC AND PRIVATE INVESTORS, CORVI provides a detailed assessment of climate fragility risks designed to improve investment decisions that target actions for effective resilience building in coastal cities.
- The INSURANCE INDUSTRY can use CORVI to improve asset pricing and risk transfer, and drive resilience by enabling investment in the most vulnerable areas.
CORVI is designed to help decision makers and investors build resilience, by providing an assessment of climate fragility risks in a coastal city and pinpointing issues where resources – financial and technical – need to be directed to strengthen resilience. This is done in two ways. First, CORVI compares risk across multiple vectors, from financial costs, to ecosystem degradation, to political capacity. This allows city planners to compare risk factors across a diverse set of sectors. Second, CORVI compares risk across cities within a region to better illustrate relative risk dynamics and help international donors and investors understand a city’s risk scores, in the context of other coastal cities.
Although CORVI can be used by any coastal city, it is particularly helpful to investors and decision makers in coastal cities within developing countries that are threatened by climate change. This is because poorer coastal nations face significant climate hazards and are least able to respond and adapt. They also rely more on climate vulnerable industries and natural capital, and have fewer financial means to adapt quickly.
CORVI was piloted in two Caribbean cities: Castries, Saint Lucia and Kingston, Jamaica. CORVI results showed that while both cities have had successes in building resilience at the city level, both are vulnerable to the cascading risks posed by climate change. In Castries, there is a heavy dependence on the tourism sector for its economic security. At the same time coastal water quality and nature-based defenses have been compromised, and vital infrastructure is vulnerable to rising sea levels. When combined these issues present significant risks to Castries and highlight the importance of economic diversification beyond tourism. In Kingston, there has been significant urban development in areas vulnerable to flooding from extreme rainfall and storm surge. There has also been a degradation of nature-based defenses, such as corals and mangroves, impacting key infrastructure such as the airport. These issues, when combined with social pressures such as informal building construction and crime could overwhelm government agencies, pointing to the importance of a more holistic resilience strategy which integrates environmental, financial, and social vulnerability.
In sum, CORVI is an index designed to support smart future investment in climate resilience across coastal cities. Climate and ocean risks are on the rise. Coastal cities continue to grow and are important economic engines for the nations and people where they thrive. They also provide safe havens for uprooted communities migrating to urban centers. Against this backdrop, building resilience requires flexibility and enhanced capacity through social, economic, and environmental systems. Ultimately, CORVI is a valuable tool for decision makers to identify and categorize risk across sectors and aid in the design of integrated policy solutions to build climate resilient cities. Without this type of approach, the risk of instability will only grow, with devastating consequences for the security of city residents, states, and the international community.
Coastal Cities at the Forefront of Climate Change
Our climate is changing at an unprecedented rate and coastal areas are at greatest risk. Climate change is projected to lead to increasing natural resource scarcity, impacting coastal ecosystems and the societies that depend on them.6C.K. Whitney, N.J. Bennett, N.C. Ban, E.H. Allison, D. Armitage, J.L. Blythe, and L. Yumagulova, “Adaptive capacity: From assessment to action in coastal social-ecological systems,” Ecology and Society 22, No. 2 (2017): 22. Sea levels are projected to rise by as much as a meter by 2100, which presents an immense threat to people residing in coastal cities.7IPCC, Report on Oceans and the Cryosphere: Summary for Policymakers (2019). Today, coastal cities are among the most vulnerable places facing the emerging climate emergency according to the Intergovernmental Panel on Climate Change (IPCC).8IPCC, “Summary for Policymakers,” in O. Pörtner, D.C. Roberts, V. Masson-Delmotte, P. Zhai, M. Tignor, E. Poloczanska, K. Mintenbeck, A. Alegría, M. Nicolai, A. Okem, J. Petzold, B. Rama, N.M. Weyer (eds.) IPCC Special Report on the Ocean and Cryosphere in a Changing Climate (2019). By 2060, more than a billion people will be living in cities in low-lying coastal zones, the vast majority in developing countries.9Bahareh Seyedi, “Unlocking climate action: Why cities are at the forefront,” United Nations Development Programme, (October 18, 2016), accessed January 7, https://www.undp.org/content/undp/en/home/blog/2016/10/18/Unlocking-climate-action-Why-cities-are-at-the-forefront.html. As climate impacts intersect with other human stressors, such as rapid coastal development, poverty, and pollution, coastal areas face continuing environmental degradation. These compounding risks increase the vulnerability of coastal areas and the people who live there to the threats of climate change.10C. Béné, A. Newsham, M. Davies, M. Ulrichs and R. Godfrey-Wood, “Resilience, Poverty and Development,” Review of International Development 26, No. 5 (2014): 598-623. With the global consequences of flooding in coastal zones projected to exceed $1 trillion by 2100, such impacts have the potential to undermine food, economic, and environmental security if significant steps towards building resilience are not taken.11M.I. Vousdoukas,L. Mentaschi, E. Voukouvalas et al, “Climatic and Socioeconomic Controls of Future Coastal Flood Risk in Europe,” Nature Climate Change 8 (2018): 776–780.
At the same time, extreme weather events are causing devastation across the globe. The number of hurricanes classified as category four and five is predicted to increase by 45-87 percent by 2100.12Thomas Knutson, Joseph J. Sirutis, Gabriel A. Vecchi et al, “Dynamical Downscaling Projections of Twenty-First-Century Atlantic Hurricane Activity: CMIP3 and CMIP5 Model-Based Scenarios,” Journal of Climate (September 2013). This includes an increase in average wind speed and a 20 percent increase in rainfall rates during these storms.13Center for Climate and Energy Solutions, “Hurricanes and Climate Change,” accessed November 13, 2019, https://www.c2es.org/content/hurricanes-and-climate-change/. As demonstrated by Hurricane Dorian which devastated the Bahamas in 2019, extreme climate events can shatter coastal communities. The financial costs to these communities are often severe.14Oliver Ralph “Hurricane Dorian set to cost insurers $3bn in payouts in Bahamas,” Financial Times (September 6, 2019), accessed November 12, 2019, https://www.ft.com/content/cee69344-d0b1-11e9-b018-ca4456540ea6. In addition, more severe droughts threaten agricultural activity, increasing migration to urban coastal areas, and harming the food security of cities which rely on these breadbaskets.15For more information on the impact of climate change on food and economic security in the Caribbean, see UNFAO, “Drought Characteristics and Management in the Caribbean,” FAO Water Reports No. 42 (2016), https://www.fao.org/3/a-i5695e.pdf.
The ongoing trend of migration to coastal regions and continuing coastal development if left unchecked, can adversely affect coastal cities and their natural resources.16G Hugo, “Future Demographic Change and its Interactions with Migration and Climate Change,” Global Environmental Change 21, Supplement 1 (2011): 21–33. Growing urban populations and pollution from sewage, runoff, and industrial waste, impairs the ability of ecosystems to protect cities. This in turn, increases the risk of storm surge and flooding.17M. Patterson, D. Hardy, “Economic Drivers of Change and their Oceanic-Coastal Ecological Impacts,” in M. Patterson and B.C. Glavovic (eds.) Ecological Economics of the Oceans and Coasts (London: Edward Elgar Publishing, 2008): 187–209. In addition, demographic and socio-economic factors such as poverty and informal housing settlements make poorer populations and places where they reside more vulnerable to coastal climate events such as sea-level rise and flooding.18IPCC, Report on Oceans and the Cryosphere: Summary for Policymakers (2019): 42.
These interconnected impacts of the climate crisis are having serious consequences not only for the world’s environment and ecosystems, but on the associated economic and social structures that support national, regional, and global security. In response the Stimson Center has developed the Climate and Ocean Risk Vulnerability Index (CORVI), which quantifies diverse climate and oceans risks at the city level. By developing a holistic assessment of these hazards and vulnerability, CORVI uses a comparative methodology to pinpoint issue areas which are most likely to compound climate stressors. The objective of CORVI is to drive investment towards issues of greatest risk and provide a tool for decision makers to help them prioritize necessary actions to mitigate these risks.
Climate Fragility Risks and the Need for Resilience in Coastal Cities
As the impacts of climate change increase, the security of individuals, communities, states, and regions are threatened. This relationship was explicitly highlighted by the IPCC in 2014, stating that “human security will be progressively threatened as the climate changes.”19W.N. Adger, J.M. Pulhin, J. Barnett, G.D. Dabelko, G.K. Hovelsrud, M. Levy, Ú. Oswald Spring, and C.H. Vogel, “Human Security,” in Climate Change 2014: Impacts, Adaptation, and Vulnerability. Part A: Global and Sectoral Aspects. Contribution of Working Group II to the Fifth Assessment Report of the Intergovernmental Panel on Climate Change (Cambridge: Cambridge University Press, 2014): 755-791. In 2019, the IPCC issued reports on the Ocean and Cryosphere; Climate Change and Land; and Global Warming of 1.5OC, all of which linked climate and ocean risks to growing economic, food, and environmental insecurity across the globe. A key conclusion from the IPCC research is that when political institutions are unable to adapt to these stressors and absorb the shocks of a changing climate, the risks to the stability of communities, cities, and states will increase.20Malin Mobjork, Climate-Related Security Risks: Towards an Integrated Approach. X.

Numerous examples illuminate how climate change interacts with other social and economic risks to increase insecurity for coastal cities and their residents. For example, Lagos, Nigeria had an estimated population of 763,000 in 1960; today, its population is 13 million. Migration from rural areas, where climate change is a contributing factor, has increased population density in a city where two out of every three people live in informal housing settlements.21John Campbell, “Home to Over Half the Population, Nigeria’s Cities Continue to Boom,” Council on Foreign Relations, (August 22, 2019), accessed November 23, 2019, https://www.cfr.org/blog/home-over-half-population-nigerias-cities-continue-boom. Climate and ocean risks can also exacerbate the overuse of natural resources. Jakarta, Indonesia’s capital city, has a population of 10 million. Extensive ground water extraction by city residents and industry, coupled with rising sea levels, has increased the risk of flooding. These risks led President Widodo in 2019 to announce that the capital city will move from Jakarta, on the island of Java, to the province of East Kalimantan on neighboring Borneo island.22Kate Lyons, “Why is Indonesia Moving its Capital City? Everything you need to know,” Guardian, (August 27, 2019), accessed September 23, 2019, https://www.theguardian.com/world/2019/aug/27/why-is-indonesia-moving-its-capital-city-everything-you-need-to-know. Cities in developing countries often need to address the impacts of climate change on top of fast paced urbanization. In this environment, being able to prioritize climate resilient actions for the safety of its citizens is key.
Both of these examples demonstrate that the sharpest risks arise when climate change intersects with multiple pressures. Many developing cities are already grappling with underlying economic and social issues, such as poverty and inequality, high levels of unemployment, outdated infrastructure, poor governance, and corruption. As the impact of climate change increases, the intersection of social, economic, and environmental issues may leave governments in developing cities unable to provide basic services and protections to their citizens, which may lead to civil unrest and instability. Despite the growing recognition of the impact of climate and ocean risks on security in coastal cities, there is a lack of tools which quantify diverse risk factors at the city level. Critically, there is a need to address how climate and ocean risks affect existing policies and could create new situations of insecurity.23Malin Mobjork, Maria-Therese Gustafsson, Hannes Sonnsjo, Sebastian Van Baalen, Lisa Maria Dellmuth, and Miklas Bremberg, “Climate-Related Security Risks: Towards an Integrated Approach,” SIPRI (2016): 55.
Introducing the Climate and Ocean Risk Vulnerability Index
CORVI builds a coastal city risk profile that assesses climate fragility risks and pinpoints issues where resources – both financial and technical – should be directed to build and strengthen resilience. To adequately prepare for the future, coastal cities must mitigate the risk of natural hazards, climate change, and social issues such as poverty and inequality, while at the same time reduce greenhouse gas emissions which are driving climate impacts.24A.R. Siders, “Resilient Incoherence – Seeking a Common Language for Climate Change Adaptation, Disaster Risk reduction, and Sustainable Development,” in J. Peel and D. Fisher (eds.) The Role of International Environmental Law in Disaster Risk Reduction (Leiden: Brill Nijhoff, 2016): 101-126. The impacts of climate change are already being felt, and steps need to be taken to reduce these impacts now to advance a more sustainable future tomorrow.
CORVI builds on the work of previous indices but is different in three important ways. First, unlike many other environmental indices which tend to focus on the national level, CORVI is city based, providing city level detail on the nature and impact of climate and ocean risks. Second, CORVI looks across a broad set of risk factors connected to the security of cities and their residents. Third, CORVI uses a methodology that combines empirical and expert survey data through structured expert judgement.25Roger Cooke, Experts in uncertainty: Opinion and Subjective Probability in Science (New York: Oxford University Press, 1991). This approach provides a contextual and data driven assessment about the diverse security risks which coastal cities face.
Given the cross-cutting nature of climate change, there is an urgent need to develop an integrated assessment which CORVI provides. By assessing the broad impacts of climate and ocean risks, alongside vulnerabilities connected to a cities social and environmental systems, CORVI integrates risks that are often viewed in isolation. CORVI is made up of 10 risk categories, grouped under ecological risk, financial risk, and political risk (see figure 1). These 10 categories are made up of 96 indicators. The categories and indicators were selected through extensive research by the project team, which consists of experts in climate, demography, economics, security, and environmental fields. This research was supplemented with detailed feedback from the project’s Climate Advisory Panel.26For a list of the Stimson Climate Advisory Panel, see acknowledgement section at the end of the report. Where possible, CORVI indicators were aligned with existing indicators from other indices such as those underpinning the United Nation’s Sustainable Development Goals to maximize the potential for available data.
Each coastal city risk profile offers granular detail developed from local experts and empirical data, on ecological, financial, and political risks. With this information, CORVI aids decision makers by pinpointing issues that have the greatest potential to degrade the security of their city. By highlighting issue areas that are the most vulnerable to climate and ocean risks, CORVI can drive funding to the issues most in need, helping coastal cities build resilience against current and future climate fragility risks.

Pinpointing Areas for Action
CORVI standardizes risk on a 1-10 scale relative to other cities in a region, providing a simple reference for decision makers looking to categorize and pinpoint risk. Each risk score is categorized using a scale from low to high risk, depending on the probability that an issue will lead to insecurity.


It is important to note that risk scores provide a starting point from which to assess relative risk across multiple sectors and issue areas. The scores are supplemented with research and expert interviews to build on the veracity of risk scores to help devise policy solutions that are relative to the context of a particular coastal city.
Decision making for climate change adaptation requires an integrated and cross-sectoral approach to adequately capture the complexity of interconnected systems.27Marc B. Neumann, “Emergence of New Knowledge for Climate Change Adaptation,” Environmental Science and Policy 83 (2018): 46-53. By assessing relative risk across 10 categories, CORVI builds a risk profile. This reflects the fact that resilience to climate change is built by strengthening social, economic, and environmental systems together, with the specific priorities dependent on the unique needs of each coastal city being assessed.
When analyzing how to build resilience to climate and ocean risks identified by CORVI, this report uses the IPCC definition of resilience: “capacity of social, economic, and environmental systems to cope with a hazardous event or trend or disturbance, responding or reorganizing in ways that maintain their essential function, identity, and structure, while also maintaining the capacity for adaptation, learning, and transformation.”28IPCC, “Summary for policymakers,” in C.B. Field, V.R. Barros, D.J. Dokken, K.J. Mach, M.D. Mastrandrea, T.E. Bilir, M. Chatterjee, K.L, 29Ebi, Y.O. Estrada, R.C. Genova, B. Girma, E.S. Kissel, A.N. Levy, S. MacCracken, P.R. Mastrandrea, and L.L.White (eds.) Climate Change 2014: Impacts, Adaptation, and Vulnerability. Part A: Global and Sectoral Aspects. Contribution of Working Group II to the Fifth Assessment Report of the Intergovernmental Panel on Climate Change (Cambridge: Cambridge University Press, 2014): 1-32.
This flexible definition of resilience focuses on the exposure coastal cities face to climate and ocean risks. It allows coastal cities to build resilience and target funding in the manner most appropriate to their specific needs.30S. Moser, “Communicating Climate Change Adaptation and Resilience.” Climate Science (September 2017). Resilience measures will vary greatly from city to city depending on the issues they must address. Sea level rise, aging infrastructure, degraded ecological systems, and poverty are all important aspects of a coastal city’s risk to climate change and require different resilience policies. In sum, by developing individual risk assessments for coastal cities, CORVI assesses multiple risk factors that can help build comprehensive solutions and drive funding to where it matters most.
CORVI Categories and Indicators
Ecological Risk
Coastal cities are heavily dependent on both terrestrial and marine environments for their safety and economic security. Ecological risks, such as ecosystem health, the state of near and offshore fisheries, and geographical factors such as coastal erosion provide important metrics to understand the environmental changes faced by a particular coastal city. The following four categories – geography/water, climate, ecosystems, and fisheries – are comprised of 39 indicators.
Geology/ water
This category identifies the geophysical vulnerabilities of a coastal city to climate and ocean risks. For example, sea level rise can rapidly affect the physical attributes of coastal regions, by altering soil salinity, increasing coastal erosion, and increasing saltwater intrusion into coastal aquifers. These impacts affect the quality of freshwater and arable land in coastal regions, which are often essential to the food security of a city. Given the importance of land stability to coastal cities, land subsidence and landslide risk provide important metrics for measuring land degradation, and its subsequent impacts on city residents.31D Sarah, and E Soebowo, “Land Subsidence threats and its management in the North Coast of Java,” IOP Conference Series: Earth and Environmental Science 118 (2017).
Climate
The Climate category focuses on the risk of a city experiencing significant climate-related impacts and indicates whether this risk is increasing. Extreme weather events such as storms, droughts, flooding, and heat events are all related to climate change and can impact the economic and social vulnerability of a coastal city’s residents. This can include rapid onset hazards such as tropical cyclones, which impact city residents through damage to infrastructure, economic cost, and potential loss of life, as well as slow onset changes such as droughts, which impacts agricultural productivity in areas that supply coastal cities with food. This category also assesses the spread of vector-borne diseases.32S.C. Terrelonge, “Sustainable Development and Climate Change in the Caribbean Department of Economics,” The University of the West Indies (2007).
Ecosystems
This category assesses the extent and health of ecosystem services such as those provided by mangroves and wetlands, coral reefs, sea grass beds, and sand dunes. Not only can these habitats provide food for coastal communities33B.M. Gillanders, “Seagrasses, Fish, and Fisheries,” Seagrasses, Biology, Ecology and Conservation (2007): 503–5., they also provide a physical barrier which can protect cities from storm surge and flooding, thereby safeguarding coastal city infrastructure and the livelihoods that depend on it.34U. Thampanya, J. Vermaat, S. Sinsakul, and N. Panapitukkul, “Coastal Erosion and Mangrove Progradation of Southern Thailand.” Estuarine, Coastal and Shelf Science 68, no. 1-2 (June 2006): 75–85. This category also measures the impact that harmful algal blooms and sargassum outbreaks have on the marine environment, as well as coastal infrastructure and economic sectors such as tourism.35David Jessop, “Sargassum a Continuing Challenge for Tourism,” Caribbean Council, May 22, 2019 (accessed December 1, 2019), https://www.caribbean-council.org/sargassum-a-continuing-challenge-for-tourism/.
Fisheries
Given their location, coastal cities often depend on healthy fisheries for food and economic security. Changing sea temperatures weaken marine habitats and drive fish to cooler waters and further from shore, reducing the food and economic benefits to city residents.36Vicky W. Y. Lam et al., “Projected Change in Global Fisheries Revenues under Climate Change,” Scientific Reports 6 (September 2016). Moreover, illegal, unreported, and unregulated fishing has been linked to illicit activities, such as trafficking in drugs, guns, and people. This activity has the potential to undermine national security and erode the social fabric of a city.37T.N. Phelps Bondaroff, “The Illegal Fishing and Organized Crime Nexus,” The Global Initiative Against Transnational Organized Crime (April 2015), https://www.unodc.org/documents/congress/background-information/NGO/GIATOC-Blackfish/Fishing_Crime.pdf. In sum, vulnerabilities related to the fisheries sector, including the health of fish stocks, the level of illegal or unreported catch, and decline of fisheries, point to the need for greater fisheries management and protection.
Financial Risk
Socioeconomic factors and risks to business and infrastructure are included in the financial risks section. Major industries such as tourism, fishing, and shipping, which are often dependent on ecosystem services, are essential for the economic and food security of city residents. These sectors are also highly vulnerable to a changing climate. Moreover, climate and oceans risk represent a threat to coastal infrastructure as rising seas and extreme weather events threaten seaports, airports, housing, and public utilities. Finally, this category considers the economic vulnerability of city residents by assessing their ability to adapt and recover from the loss of employment, from slow-onset changes such as migrating fish stocks, as well as economic shocks from extreme weather events associated with rapid onset events. The following three categories – economics, major industries, and infrastructure – are comprised of 29 indicators.
Economics
This category measures the economic factors of the coastal city and the country in which it resides. Income inequality intersects with climate change as those in temporary or seasonal employment and informal housing or squatter settlements are least able to adapt to climate and ocean risks.38Tackling Climate Change Could Tackle Inequality,” International Institute for Environment and Development, (September 7, 2018), accessed October 3, https://www.iied.org/how-tackling-climate-change-could-tackle-inequality. Indicators that measure unemployment and the informal economy provide important metrics for economic vulnerability.39David Dodman, Diane Archer, and Marcus Mayr, “Addressing the Most Vulnerable First – Pro-Poor Climate Action in Informal Settlements,” UN-Habitat Thematic Guide (Nairobi: United Nations, 2018). This category also measures the percentage of national GDP that is generated in coastal regions, capturing the extent to which the nation relies on economic output in vulnerable areas.
Major Industries
Certain economic sectors are highly vulnerable to climate change. These include agriculture, fishing, tourism, and shipping.40For more information on the tourism vulnerability to climate change, see Daniel Scott, C. Michael Hall, and Stefan Gössling, “Global Tourism Vulnerability to Climate Change,” Annals of Tourism Research 77 (July 2019): 49–61. Each of these sectors is critical to the economic security of a coastal city, as they provide jobs, foreign direct investment, foreign exchange earnings, and tax revenue needed for government services at both the national and city level.41Olaf De Groot and Miguel Pérez Ludeña, “Foreign Direct Investment in the Caribbean: Trends, Determinants and Policies,” Studies and Perspectives Series – The Caribbean, Vol. 35. EU Economic Commission for Latin America and the Caribbean (2014). For many small island developing states, tourism represents a significant portion of the economy.42Colin Cannonier and Monica Galloway Burke, “The Economic Growth Impact of Tourism in Small Island Developing States—Evidence from the Caribbean.” Tourism Economics 25, No. 1 (2018): 85–108. The fishing industry, both industrial and artisanal, also represent a significant economic sector for many coastal communities. Coastal fisheries made up 89 percent of all global fisheries catch in 2018.43“The Importance of Coastal Fisheries.” Sea Around Us, (February 1, 2019) accessed September 6, 2019, https://www.seaaroundus.org/the-importance-of-coastal-fisheries/. Coastal cities are also hubs of industry, with shipping accounting for 90 percent of global trade in goods.44Jessica Green, “Analysis: Why Do We Need New Rules on Shipping Emissions? Well, 90 Percent of Global Trade Depends on Ships.” The Washington Post, (April 18, 2018), accessed October 30, https://www.washingtonpost.com/news/monkey-cage/wp/2018/04/17/why-do-we-need-new-rules-on-shipping-emissions-well-90-of-global-trade-depends-on-ships/. Finally, agriculture, while not usually within the metropolitan area of a city, plays a critical role in producing food for coastal cities and supporting the tourism industry. As such, any disruption to this supply can degrade the food security of city residents, and in some cases lead to unrest.45For a deeper discussion on the impact of rural policy on urban unrest, see C.S. Hendrix and Stephan Haggard, “Global Food Prices, Regime Type, and Urban Unrest in the Developing World,” Journal of Peace Research (2015).
Infrastructure
The risks from climate change to coastal infrastructure such as seaports, airports, energy facilities, electrical generation, and ground transportation are growing. Rising sea levels, storm surge, and extreme weather events all pose a significant risk. Moreover, degraded and outdated infrastructure is especially vulnerable.46S.F. Balica, N.G. Wright, and F. van der Meulen, “A flood Vulnerability Index for Coastal Cities and its use in Assessing Climate Change Impacts,” Natural Hazards (2012): 64 – 73. 1 Poor infrastructure impacts a city’s ability to provide essential services to its residents after an extreme weather event, increasing the risk of instability or unrest.47Arelis Hernández, “Puerto Rico Has Turned on Its Governor as Deep Unrest Reaches the Surface,” The Washington Post, (July 22, 2019), accessed September 5, https://www.washingtonpost.com/national/puerto-rico-has-turned-on-its-governor-as-deep-unrest-reaches-the-surface/2019/07/21/c4e14b4c-ab4e-11e9-a3a6-ab670962db05_story.html. This category also measures the extent of informal housing and the percent of city residents who live less than five meters above sea level. These indicators are vital for assessing the risk posed by climate change to the most vulnerable city residents.48“The Future We Don’t Want – Staying Afloat: The Urban Response to Sea Level Rise,” C40.org, accessed September 4, https://www.c40.org/other/the-future-we-don-t-want-staying-afloat-the-urban-response-to-sea-level-rise.
Political Risk
Political capacity is at the heart of how cities respond to increased climate and ocean risk. Political risk can come in the form of weak social and government institutions. When political risk intersects with environmental pressures such as degraded fisheries, flooding, and heat waves, and financial risks such as high unemployment, a monolithic economy, and aging infrastructure, the risk of social tension grows. Ultimately, a lack of political capacity can reduce the ability of a city to adequately respond to the overall threat posed by the climate emergency. The following three categories – social/demographics, governance, and stability – are made up of 27 indicators that measure social drivers, instability, and resilience in coastal cities.
Social/Demographics
Coastal cities are often engines of economic development and play a pivotal role in a national economy. However, demographic shifts and rapid urbanization can destabilize social structures if cities are not prepared to cope with such influxes.49J Leitmann et al, “Environmental Management and Urban Development: Issues and Options for Third World Cities”, Environment and Urbanization 4, no. 2 (1992) Climate change can act as a powerful push factor, driving migration from rural areas to cities as rising temperatures and erratic rainfall reduce the viability of agricultural livelihoods.50C Raleigh, Lisa Jordan, and Idean Saleyan, “Assessing the Impact of Climate Change on Migration and Conflict,” World Bank, https://siteresources.worldbank.org/EXTSOCIALDEVELOPMENT/Resources/SDCCWorkingPaper_MigrationandConflict.pdf. It can also cause migration from one island nation to another as rising seas, severe storms, and flooding make coastal regions uninhabitable. Urban poverty tends to be concentrated in locations most exposed to hazards relating to the direct and indirect impacts of climate change. As economic growth becomes more susceptible to climate shocks, vulnerable populations will be affected. These communities are most likely to suffer injury, loss of property, and loss of income, making it difficult for them to adapt.51Jorgelina Hardoy and Gustavo Pandiella, “Urban Poverty and Vulnerability to Climate Change in Latin America,” Environmental and Urbanization 21, no. 1 (2009): 203-224. As such, the intersection between demographic shifts, poverty, and vulnerability increase the risk of insecurity for the most vulnerable communities in coastal cities.52I Boas, Climate Migration and Security: Securitisation as a Strategy in Climate Change Politics (Routledge, 2015).
Governance
Governance measures the ability of government institutions to provide for its citizens. Poor governance leads to low levels of resiliency and in the face of climate change and climate events, such cities can be overwhelmed. In certain cases it can also cause instability and civil unrest, as seen in Iran where severe flooding in 2019 led to protests, in part due to the inadequate government response.53Emma Graham-Harrison, “At least 62 people killed in Iran floods as US accused of blocking aid,” Guardian, (April 4, 2019), accessed January 14, 2020, https://www.theguardian.com/world/2019/apr/04/iran-floods-death-toll-reaches-62. The lack of capacity needed for climate resilience planning and response, low trust in government institutions by citizens, and the potential for government corruption all hinder governmental efforts to develop holistic strategies to adapt to climate change. This can impair a government’s ability to respond to climate fragility risks.54“Global Corruption Report: Climate Change A User’s Guide,” (Berlin: Transparency International, 2011). Ultimately, the capacity of urban governments and public institutions to respond to current and future climate risks, defines not only the resilience of coastal cities but their potential to develop sustainably.55R. Miller, C. Lacambra, C. Ariza, R. Saavedra, R. Bloch, et al., “Climate Change Adaptation Planning in Latin American and Caribbean Cities Complete Report: Castries, Saint Lucia,” Climate Change Adaptation Planning in Latin American and Caribbean Cities (London: World Bank, 2012).
Stability
The overall goal of CORVI is to assess climate fragility risks to coastal cities. Climate related disasters can overburden and undermine the capacity of institutions to respond adequately.56L. Rüttinger, D. Smith, G. Stang, D. Tänzler, and J. Vivekananda, “A New Climate for Peace: Taking Action on Climate and Fragility Risks,” Adelphi, International Alert, Woodrow Wilson International Center for Scholars, European Union Institute for Security Studies (2015): 36. This category provides an assessment of a coastal city’s pre-existing level of stability by assessing the level of employment across industries particularly vulnerable to climate change, such as fishing, agriculture, tourism, and shipping. Damage caused to these industries by extreme weather events, can lead to widespread unemployment, which increases pressure on city and national government institutions. This category also examines previous incidences of political instability, as climate change can act as a threat multiplier that exacerbates pre-existing social grievances.
CORVI Methodology
By collecting data on 96 indicators across 10 risk categories, CORVI compares climate risk across multiple sectors, from financial costs, to ecosystem degradation, to political capacity. This allows city planners to compare diverse factors in a risk profile. CORVI is also a regional index. In addition to the target city, data is collected on other coastal cities in the same region. This comparative dataset illustrates relative risk dynamics and can help international funders understand a city’s risk scores, in the context of other coastal cities within a region.
Each indicator outlined in the previous section provides detail on a vast array of climate and ocean risks that impact coastal cities. To ensure that the risk scores provide a holistic risk rating, each indicator is made up of five factors: current, past, and expected trends, along with the rate of change in the risk, and finally the impact of this risk to the particular coastal city. Each indicator provides a relative risk score which can be compared to other risk scores in the index. This leads to a better understanding and prioritization of issues in need of action.
Indicator Factors
- The BASELINE measures the current level of risk for each indicator relative to other coastal cities in the region. Baseline data for economic and social indicators is derived from the most recent year of complete data. Climate indicators use a longer time period of 15 years.
- OBSERVED TREND assesses the trend of risk for the past 10 years, measured from the baseline year. The only exception to the 10-year trend measure are the climate indicators, which use a 15-year trend horizon to account for slow onset changes.5730-year time horizons are traditionally used to calculate the seasonal cycle and other long-term averages of climate variables. However, as the climate changes, current conditions are more dissimilar to those from 30 years ago than they are from 10 years ago. In this environment, the optimum climate normals (OCN) method can be used to calculate the minimum number of years required to accurately produce the climatological average for climate variables. The National Oceanic and Atmospheric Administration suggests that a 10-year time series for temperature and a 15-year time series for precipitation are acceptable minimum limits to produce an accurate climatology within a non-stationary period. CORVI follows the same limits that NOAA uses in their experimental seasonal forecast product by using a similar 15-year time horizon to measure climate indicators. For more information on OCN, see D.S. Wilks, “Projecting “Normals” in a Nonstationary Climate,” Journal of Applied Meteorology and Climatology (February 2013): 289-302.
- EXPECTED TREND assesses the anticipated trend of risk in the next 10 years, measured from the baseline year. The only exception to the 10-year trend measure are the climate indicators, which use a 15-year trend horizon to account for slow onset changes.
- MAGNITUDE assesses the degree of expected future trend change, relative to other cities in the region. Change that happens quicker than expected is assumed to increase risk when compared to changes that take place over a longer time scale. This assumes that longer time periods of change contribute to less risk, as decision makers have more time to adapt and build resilience.
- Finally, IMPACT assesses the importance of change for each indicator in describing future risk in the coastal city.

Structured Expert Judgment
While empirical data on the impacts of climate and ocean risks has greatly improved, data gaps remain. Accessing comparative city level data remains a challenge. Despite this, decision makers need tools which reduce uncertainty to pursue integrated resilience planning in an effective manner. To overcome this challenge, CORVI uses structured expert judgement (SEJ), a social science technique which seeks to quantify risk when existing empirical data is inadequate. By combining empirical and expert survey data, the CORVI assessment collects data in areas that would otherwise be unavailable to researchers.
Subject matter experts are identified through research and extensive outreach to stakeholders in the target coastal cities. These experts refer the Stimson research team to other experts and stakeholders with appropriate expertise using a sampling technique known as “snowball sampling.”58Snowball sampling or chain-referral sampling is a non-probability sampling technique used when samples have traits that are difficult to find. In this sampling technique, existing subjects provide referrals to recruit additional subjects required for a research study. Expert include representatives from academia, government, civil society, and the private sector. To guard against confirmation bias, survey answers are compared to empirical data to weight the expert responses by utilizing a coherence check.59Abigail Colson and Roger Cooke, “Expert Elicitation: Using the Classical Model to Validate Experts’ Judgements,” Review of Environmental Economics and Policy 12, no. 1 (2018): 113-132. This ensures that experts whose answers do not match empirical data are not weighted as highly as those who do. For more information on the weighting process, see the Appendix.
Through structured interviews and surveys, as well as a series of weighting procedures to ensure data is representative, SEJ allows researchers to quantify topics that might otherwise be impossible to study in a systematic fashion. As SEJ is often applied to specialized fields where empirical data is scarce, it is a useful method for analyzing small sample sizes. In climate change research, SEJ provides a method to bring expert knowledge to bear on these important problems.60M. Granger Morgan, “Certainty, Uncertainty, and Climate Change,” Climatic Change 108, no. 4 (2011): 707–721. To date, SEJ has been used to research the link between climate change and conflict61Katharine J. Mach et. al., “Climate as a Risk Factor for Armed Conflict,” Nature 571 (2019): 193–197., the contribution of sea ice to sea level rise62Jonathan L. Bamber, Michael Oppenheimer, Robert E. Kopp, Willy P. Aspinall, and Roger M. Cooke, “Ice Sheet Contributions to Future Sea-Level Rise from Structured Expert Judgment,” PNAS 116, no.23 (2019)., and the impact of invasive species on ecosystem services.63Tobias Schwoerer, Joseph M Little, and Milo D Adkison, “Aquatic Invasive Species Change Ecosystem Services from the World’s Largest Wild Sockeye Salmon Fisheries in Alaska,” Journal of Ocean and Coastal Economics 6, no. 1. (2019). In all these cases, expert knowledge is combined with empirical data to reduce uncertainty and produce more robust conclusions.
This approach has several strengths. First, CORVI is an evolving index which incorporates the views of subject matter experts and local stakeholders at each stage of its implementation. This approach allows the risk profile to better reflect the specific context that it is seeking to measure and to provide more focused information for end users. Further, as more survey data is collected, indicators become stronger and more robust.64However, this does mean that early versions of the index will have increased levels of uncertainty, both in terms of which indicators to include, but also the final scores of each indicator and category. Second, pairing the use of SEJ with empirical data also allows CORVI to provide a depth of insight to risks relating to urban coastal environments which empirical datasets alone do not provide.
Ultimately, CORVI is a tool to understand how climate fragility risks intersect with social, economic, and ecological systems in coastal cities. By collecting empirical and survey data on a wide range of indicators, CORVI reduces data gaps and produces a holistic empirical assessment which can be used by city planners and investors to build resilience where it matters most.
CORVI Limitations
CORVI risk profiles are designed to provide guidance to decision makers on current and potential future trends as they make investments to build resilience in coastal cities. The use of SEJ quantifies uncertainty when empirical data is not available for the risk categories in this assessment. As with all scientific approaches, the CORVI methodology has certain limitations which are noted below.
- NOT A SCIENTIFIC PREDICTION: CORVI risk scores are designed to reduce uncertainty for decision makers who are designing resilience strategies.65Abigail Colson and Roger Cooke, “Expert Elicitation: Using the Classical Model to Validate Experts’ Judgements,” Review of Environmental Economics and Policy 12, no. 1 (2018): 113-132. However, they should not be taken as a scientific prediction of a future outcome. The goal of the SEJ method is to quantify uncertainty, however it does not eliminate it.66R. M. Cooke, and W. P. Aspinall, Quantifying scientific uncertainty from expert judgement elicitation (Cambridge: Cambridge University Press, 2011).
- NUMBER OF SURVEYS: Each of the 96 risk indicators is assessed separately. In this report, the number of expert responses is unequal across the indicators, with some indicators having a greater survey response rate than others. Because of the small sample-size statistical tests were not conducted. As more data is collected the methodology will be adjusted to include statistical testing. Due to the fact that risk category scores are dependent on the level of expert participation, fewer surveys are associated with lower data confidence. Similarly, the individual indicator scores should not be viewed in isolation, but instead considered as part of the overall category score.
- NOT A SUBSTITUTE FOR EMPIRICAL DATA:While the use of SEJ allows CORVI to assess a diverse range of risks, it should not be regarded as a substitute for empirical data collection. Rather, SEJ is best viewed as an alternative research technique specialized to analyzing topics with significant data gaps.67C. Werner, T. Bedford, R. M. Cooke, A. M. Hanea, O. Morales-Napoles, “Expert Judgement for Dependence in Probabilistic modelling: A Systematic Literature Review and Future Research Directions,” European Journal of Operational Research 258 (2017): 801-819.
- NUMBER OF COASTAL CITIES: Due to the limited number of cities currently in the CORVI, it is not yet feasible to compare category scores with other cities in the region. As more cities are added, comparing cities within the same region will be possible. However, while the overall category scores can provide a broad-based comparison, the primary purpose for CORVI is to understand and prioritize risk across multiple factors in a single city.
The Caribbean Assessment
Home to an estimated 43 million people and with more sea than land, the geography of the Caribbean region makes it vulnerable to climate and oceans risks such as hurricanes and droughts. Of the 14 Caribbean island nations in the comparative Caribbean dataset, 51 percent of the population live in cities, the vast majority of which are located in coastal areas.68Inter-American Development Bank, “Climate Change and Inter-American Development Bank: Building Resilience and Reducing Emissions – Regional Study: LAC Small Island Development States,” IADB (2014).
Rising temperatures and atmospheric changes continue to increase climate and oceans risks across the region. Moreover, the damage caused by hurricanes continues to worsen. In 2017, Hurricane Irma destroyed 95 percent of buildings on Barbuda. Irma also left 66 percent of homes uninhabitable in Saint Martin due to a lack of electricity, gas, drinking water.69BBC, “Hurricane Irma: Caribbean islands left with trail of destruction,” British Broadcasting Service, (September 11, 2017), accessed January 4, 2020, https://www.bbc.com/news/world-latin-america-41218002. Hurricane Dorian, which devastated the Bahamas in 2019, is projected to cost an estimated $2.4 billion.70Inter-American Development Bank, Assessment of the Effects and Impacts of Hurricane Dorian in the Bahamas: Executive Summary (November 15, 2019), accessed January 5, 2020, https://idbdocs.iadb.org/wsdocs/getdocument.aspx?docnum=EZSHARE-1256154360-486. Droughts are also becoming more intense across the Caribbean, a phenomenon exacerbated by weather related El Nino events.
Coastal cities are at the forefront of climate change and their economies drive economic growth across the region. However, much of the Caribbean’s urban physical infrastructure was not designed to cope with the magnitude of climate-related storms and the impact of increasing populations. Further, the degradation of coastal and marine ecosystems threatens the resilience of the tourism sector. Some estimates indicate that 29 percent of tourist properties in the 15 Caribbean Community member countries will be partially or fully flooded by one meter of sea level rise.71Daniel Scott, Murray Simpson, and Ryan Sim, “The Vulnerability of Caribbean Coastal Tourism to Scenarios of Climate Change Related Sea Level Rise,” Journal of Sustainable Tourism 20, No. 6 (2012): 883 – 898. Ultimately, the capacity of political institutions to respond to these compounding factors will determine the vulnerability of the regions coastal urban population.
The Caribbean CORVI Assessment builds a comparative empirical dataset made up of 14 coastal cities, which is used to assess the impact of climate change on the pilot cities of Castries, St Lucia and Kingston, Jamaica. This data is combined with expert surveys to fill empirical data gaps. Together the data forms the risk scores which are presented in the city risk profiles. The Stimson Climate Project Team supplemented this data with field research and expert interviews. As more CORVI projects are undertaken across the Caribbean, the ability to make city to city comparisons will grow.
Castries, Saint Lucia
Built on reclaimed land and located on the west coast, Castries is the capital of Saint Lucia and its largest city. While the city population has remained relatively consistent, the urban area around Castries has expanded, extending from Grand Cul de Sac Bay in the South to Gros Islet in the north. This stretch of coastline is vulnerable to climate risks such as sea level rise and severe storms. Given the urban expansion, the geographic area of this risk profile was broadened to combine Gros Islet district and the city of Castries. The Castries-Gros Islet Corridor is home to nearly 50 percent of the nation’s population.
Saint Lucia is a leader among Caribbean states working to prioritize responses to climate change. Yet at the same time it suffers from climate and ocean risks. These include a high reliance on tourism to drive its economy, ecosystem degradation, and the vulnerability of key infrastructure to the physical impacts of storms and sea level rise. Furthermore, and partly as a consequence of its rapid urbanization, the study area continues to face issues relating to fresh and marine water quality.
With 1.2 million tourists arriving by cruise ship or plane in 2018, tourism continues to dominate the economy, contributing 41 percent to Saint Lucia’s GDP and employing 51 percent of the workforce.72World Travel and Tourism Council, “Economic Impact 2018: St Lucia,” (London: WTTC, 2018), 3. While tourism is a vital part of the economy, it has unforeseen negative consequences. Unregulated tourist settlement construction and pollution from a lack of effective waste management has had secondary impacts on coastal ecosystems, such as coral reefs, and mangroves, and sea grass beds. Given the importance of tourism to the Castries-Gros Islet Corridor, an extreme weather event would be devastating, increasing the economic vulnerability in a city which already faces high urban unemployment.
The city is already working to improve ecosystem resilience, flood management, and disaster planning, but more needs to be done. The risk profile identifies three priority areas in need of action.
- Empower the city-level government to design and implement climate resilience plans
- Build a more sustainable tourist industry
- Improve urban infrastructure resilience
By advancing cross-cutting policies and channeling resources to these areas, Castries can lessen its vulnerability to climate and ocean risks.
Castries: Ecological Risk
Famed for its natural beauty, Saint Lucia’s marine and land ecosystems play a critical role in protecting coastal areas from flooding, supplying important fish sanctuaries, and helping Saint Lucia to stand out in a crowded global tourist market. However, ecosystem risk category scores are among the highest ecological risk category in the Castries risk profile, reflecting the growing physical risks posed by climate change and urbanization to the environment.
- In the ECOSYSTEMS category (expert weighted avg 6.18)the high scores in this category focus on the lack of coverage of coral reefs (8.03) and mangroves (7.88) which negatively impact marine habitats and nature-based city defenses. Data gaps excluded seven indicators from this category.73Seven indicators in the Geology/Water category did not pass the data quality threshold. These Indicators are E3 Level of Coastal Sand Dune Coverage; E7 Health of existing Sand Dune systems; E9 Percent of GDP Protected by Mangroves; E10 Percent of GDP Protected by Coral Reefs; E11 Percent of GDP Protected by Coastal Sand Dunes; E12 Percent of GDP Protected by Sea Grass Beds; E13 Rate of Occurrence of Harmful Algal Blooms; E14Incidence of High Sargassum Abundance.
- In the CLIMATE category (expert weighted avg 5.85) the high and medium-high scores in this category highlighted extreme heat events (8.27), droughts (7.08), floods (5.39), and hurricanes (5.17) as risks that increase the vulnerability of city residents. The risk of extreme weather is also reflected by a high-risk score in the number of people affected by extreme weather (8.11).
- In the FISHERIES category (expert weighted avg 5.28), the medium-high risk scores in this category are fisheries management (7.23) and declining nearshore fish stocks (6.92), both of which pose a risk to food availability and the livelihoods of city residents.
- While the GEOLOGY/WATER category (expert weighted avg 4.02) shows medium risk scores for sea-level rise (4.03) and coastal erosion (4.00), the category also highlight risks posed by poor freshwater quality (5.22).
Ecosystems across Saint Lucia, including coral reefs, mangrove forests, and sea grass beds, have degraded over time, affecting ecosystems services to the city. The clearance of mangrove forests in favor of construction projects has weakened the ability of Castries to combat storm surge. Recent regulations have reduced mangrove destruction, yet degradation continues, albeit on a smaller scale. Despite long-term coral degradation, recent positive stabilization trends have been seen, with 30 percent of national reefs now in “good condition,” as measured by the Reef Health Index.74P.R. Kramer, L.M. Roth, S Constantine et al, “Saint Lucia’s Coral Reef Report Card 2016,” The Nature Conservancy, accessed October 2, 2019, https://caribnode.org/documents/87. However, declines in these marine ecosystems have already harmed nearshore fish stocks. Despite the high degree of fisheries management and compliance within the local fisheries sector, much of Castries’s fishing activities revolve around pelagic fish species which have the least regulations.75Elizabeth Mohammed and Alasdair Lindop, “St. Lucia: Reconstructed Fisheries Catches, 1950-2010,” The Sea Around Us, The University of British Columbia: Fisheries Centre, 2015. Both issues are reflected in medium-high risk scores in the fisheries enforcement (7.23) and nearshore fisheries (6.92) indicators.

Despite the protection afforded by Castries’ location on the western side of the island, hurricanes still pose a direct threat.76Caribbean Disaster Emergency Response Agency & World Bank, “Saint Lucia National Flood Plan: Floodplain Management and Flood Response (2003). In 2010, Hurricane Tomas hit Saint Lucia resulting in the death of 14 people and the displacement of thousands.77“Hurricane Kills 14 People in St Lucia,” BBC News, (November 2, 2010), accessed September 3, 2019, https://www.bbc.com/news/world-latin-america-11672819. In 2013, much of Saint Lucia was damaged by an excessive rainfall event, termed the “Christmas Eve Trough Floods,” that caused severe flooding.78Carrie Gibson. “We Ignore the Disastrous Storms in the Caribbean at Our Peril.” The Guardian, (December 31, 2013), accessed November 23, https://www.theguardian.com/commentisfree/2013/dec/31/storms-caribbean-uk-climate-change. The deluge caused flash floods which damaged infrastructure and killed at least 15 people, especially in areas with high poverty levels.79“EU Agrees to Allocate EC$45M for St. Lucia and St. Vincent for 2013 Storm Flooding.” St. Lucia News Online, (September 26, 2014), accessed September 23, 2019, https://www.stlucianewsonline.com/eu-agrees-to-allocate-ec45m-for-st-lucia-and-st-vincent-for-2013-storm-flooding/. Hurricane Matthew’s heavy rainfall in 2016 led to flooding, power outages, and disruption of the fresh water supply in Castries.80“DREF Operations Final Report: Saint Lucia Hurricane Matthew,” International Federation of Red Cross and Red Cross Crescent Societies, July 20, 2017. These events are reflected in a high risk score for people affected by extreme weather (8.11), with eight percent of the national population impacted by extreme weather events per year between 2003 to 2018.81Data taken from the EM-DAT The International Disaster Database available at: https://www.emdat.be/.
Drought is also a cause for concern across the study area. Castries depends upon precipitation for the majority of its water supply, and drought increases vulnerability, as seen in the 2009-10 drought which triggered a state of emergency and diminished agricultural output.82UNEP, “National Environmental Summary: Saint Lucia,” United Nations Environment Programme, Regional Office for Latin America and the Caribbean (2010). Moreover, watersheds in the study area are vulnerable to water contamination. Poor waste management and urban run-off are polluting the surface freshwater supplies upon which Castries’ relies.83UNFAO, “AQUASTAT Country Profile – Saint Lucia,” United Nations Food and Agriculture Organization, 2015. In addition, expert interviews noted that informal housing construction also contributes to both marine and freshwater water pollution.84Interview with the Saint Lucia Water Resources Management Agency and the Saint Lucia Tourism Authority. Interviews took place in May 2019.
Finally, extreme heat events present a challenge to Castries as they increase water scarcity and deter tourists, one of Castries’s main sources of economic security. Overall, while tourist arrivals have not diminished, studies show that tourists are becoming more aware of climate risks when choosing their vacation destination.85J Forster, P.W. Schuhmann, I.R. Lake. et al, “The Influence of Hurricane Risk on Tourist Destination Choice in the Caribbean Climatic Change 114 (2012): 745. This view was corroborated in expert interviews, which noted that the risk of extreme heat could reduce tourist numbers in Saint Lucia.86Interview with the Saint Lucia Chamber of Commerce. Interview took place in May 2019.
Castries: Financial Risk
The Castries-Gros Islet Corridor hosts a high concentration of roads, settlements, and the majority of the island’s population and critical infrastructure. This concentration of economic activity on low-lying coastal land, along with a reliance on tourism as its primary industry, represents two key areas of risk. One study estimated that without significant improvements in coastal resilience, Saint Lucia could lose up to $20 million annually by 2025 and $70 million by 2100, under a global high emissions scenario.87Ramón Bueno, Cornelia Herzfeld, Elizabeth A. Stanton, and Frank Ackerman, “The Caribbean and Climate Change: The Costs of Inaction” Stockholm Environment Institute—US Center & Global Development and Environment Institute, Tufts University (2008). Another study estimated that one meter of sea level rise could flood 30 percent of tourism properties.88Merkevia Isaac, “The Implications of Sea-level Rise for Tourism in St. Lucia,” UWSpace (2013), https://hdl.handle.net/10012/7637.
- In the ECONOMICS category (expert weighted avg 7.20), high scores in the indicators which measure the vulnerability of people to climate shocks: national youth unemployment (8.40), national unemployment rate (8.05), income inequality (7.95), and dependence on the informal economy (7.52) increase the economic insecurity of city residents to climate change.
- The INFRASTRUCTURE category (expert weighted avg 5.16) highlights a dependency on oil imports and a lack of renewable energy generation (7.17), which increases Castries reliance on oil tankers. Other public infrastructure including poor road networks (6.65), the geographic location of freshwater distribution facilities (6.42), and poor wastewater management (5.98) are also at risk from storms and sea level rise.
- While the MAJOR INDUSTRIES category (expert weighted avg 4.42) highlights medium risk scores in fishing (nearshore 3.73 and offshore 3.60) and agriculture sectors (2.80), it highlights the importance of tourism (5.52) to the overall economic security of Castries.
Since the erosion of European Union trade preferences in the 1990s, the economy of Saint Lucia has become increasingly dependent on tourism as the economy has shifted towards a more service dominated model of development.89UNFAO, “AQUASTAT Country Profile – Saint Lucia,” United Nations Food and Agriculture Organization, 2015. Despite the success of the industry, driven by the “sun-sea-sand” model, unsustainable land use, climate change, and environmental degradation continue to threaten the success of the tourist industry.90Isavela Monioudi, “Climate Change Impacts on Coastal Transportation infrastructure in the Caribbean,” Enhancing the Adaptive Capacity of Small Island Developing States – Saint Lucia: A Case Study,” (Geneva: United Nations Conference on Trade and Development, 2017), accessed November 23, 2019, https://sidsport-climateadapt.unctad.org/wp-content/uploads/2018/05/Executive-summary-St-Lucia.pdf.
The construction of hotels and other tourism infrastructure – including restaurants, gift shops, and cruise ship facilities – in the study area have had a variety of environmental impacts. These include destruction of natural marine and estuarine habitats, loss of productive agricultural land, and soil erosion.91Walters, Bradley. “St Lucia’s Tourism Landscapes: Economic Development and Environmental Change in the West Indies,” Caribbean Geography 21 (2016): 10. When interviewed, multiple experts stated that inappropriate land use and management is a central factor contributing to environmental degradation in the Castries-Gros Islet Corridor.92Interview with Saint Lucia Tourism Authority and the Saint Lucia Chamber of Commerce. Interviews took place in May 2019. The construction is placing greater stress on natural resources and biodiversity, and the capacity to produce food and retain freshwater has been diminished.93UNFAO, “AQUASTAT Country Profile – Saint Lucia,” United Nations Food and Agriculture Organization, 2015. Moreover, increased water consumption by the tourism sector, when compounded by climate change, is increasing food and water insecurity throughout Saint Lucia, as well as suppressing long-term growth prospects.94UNFAO, “AQUASTAT Country Profile – Saint Lucia,” United Nations Food and Agriculture Organization, 2015.
Critical infrastructure networks in Saint Lucia are also exposed to coastal and inland flooding. Key economic infrastructure in the study area, including roads, airports, the seaport, fuel storage, and energy supply networks are located along the coast or on low-lying reclaimed coastal land. Disruption to this infrastructure would impact the whole island. Climate change will likely exacerbate the current impact of flooding. While growth in population, unplanned settlement construction, and tourism will likely compound this impact.95R Miller, et al, Climate Change Adaptation Planning in Latin American and Caribbean Cities Complete Report: Castries, Saint Lucia, 2012. There are further concerns that the energy infrastructure in Saint Lucia, and in Castries in particular, is exposed to the impacts from coastal and inland flooding, as well as high winds during tropical storms and hurricanes.96P.A. Murray and B. Tulsie, “Saint Lucia Climate Change Vulnerability and Adaptation Assessment – Coastal Sector. Provided by the Ministry of Physical Development & the Environment, Government of Saint Lucia (2011).
Transportation infrastructure is also at risk, as evidenced by high and medium-high indicator scores in road, airport, and seaport resilience. Poor road quality and landslide risk can impede disaster response, particularly to poorer areas of the Castries-Gros Islet Corridor. George F.L. Charles Airport, which sits along the coast is prone to flooding from both precipitation and storm surge event, despite being situated 3.4 meters above sea level.97P.A. Murray and B. Tulsie, “Saint Lucia Climate Change Vulnerability and Adaptation Assessment – Coastal Sector. Provided by the Ministry of Physical Development & the Environment, Government of Saint Lucia (2011). However, the risk to the coastal city is negated by the fact that George F.L. Charles Airport is a secondary airport with most of the international traffic landing at Hewanorra International Airport, located in the southeast corner of the country. Nevertheless, because of the distance that tourists must travel over roads to get to Gros Islet, the tourism industry is still vulnerable due to poor road quality, which are at risk from floods and landslides.
Port Castries has been able to withstand past storm surges without sustained damage. However, during Hurricane Dean in 2007, large vessels were forced to return to open waters during the storm event to avoid floating debris that drained off the island into the harbor. Nevertheless, operations at George F.L. Charles Airport and at Port Castries have never fully been halted due to flooding.98P.A. Murray and B. Tulsie, “Saint Lucia Climate Change Vulnerability and Adaptation Assessment – Coastal Sector. Provided by the Ministry of Physical Development & the Environment, Government of Saint Lucia (2011).
Finally, Saint Lucia relies on imported oil for the majority of its energy. This exacerbates the reliance on Cul-de-Sac Bay – where oil facilities are located – for its economic security. Despite its potential for wind and solar power, renewables make up a small proportion of overall energy generation, as reflected in the medium-high risk score of 7.17.99“Renewable Energy Sector Development Project (P161316).” Renewable Energy Sector Development Project (P161316). The World Bank, May 30, 2017. https://documents.worldbank.org/curated/en/949751496156024515/pdf/ITM00184-P161316-05-30-2017-1496156021818.pdf.
Castries: Political Risk
Like many small island developing states in the Caribbean, Saint Lucia has a democratically elected government. In response to the threat posed by climate change, the government of Saint Lucia has spearheaded numerous climate-related development projects, including the implementation of the Special Programme on Adaptation to Climate Change, which has sought to strengthen critical coastal infrastructure in Castries. While relatively low CORVI risk scores across social/demographic, governance, and stability categories show that Saint Lucia has been successful in building political capacity to adapt to climate risks, the scores also highlight vulnerabilities which could be exacerbated by a changing climate.
- The SOCIAL/DEMOGRAPHICS category (expert weighted avg 4.86) highlights population trends such as urbanization of the study area (6.20), population density (5.43), and a high dependency ratio (7.40) which increases the vulnerability of Castries to extreme weather events.
- The STABILITY category (expert weighted avg 4.81) shows a comparatively high number of people employed in artisanal fishing (5.37) and tourist (5.30) sectors.100One indicator in the Stability category did not pass the data quality threshold. This indicator is S3 Percent of People Employed in Port and Shipping Industries.
- The GOVERNANCE category (expert weighted avg 4.55) shows medium risk scores in the rule of law (3.20) and civil society engagement (2.95) scores. However, unequal access to healthcare (6.42), a lack of trust in ethics enforcement bodies (5.75), and relatively low voter turnout (5.65) are scored at medium-high risk.
Vulnerable populations are most at risk from climate change. Poorer areas, which are concentrated in the south and southeast of the study area, tend to have higher urban density. This is coupled with informal housing construction using substandard materials, and are often located on steep hillsides.101R Miller, et al, Climate Change Adaptation Planning in Latin American and Caribbean Cities Complete Report: Castries, Saint Lucia, 2012: 55. Few households have home insurance, increasing their risk to climate shocks.102Saint Lucia Population & Housing Census 2010. In addition, the absence of effective city planning, along with ineffective enforcement of existing building policies is contributing to the expansion of unplanned and unsafe settlements. This growth is occurring in vulnerable areas such as steep hillsides, watersheds, flood plains, and is also driving deforestation.103UNFAO, “AQUASTAT Country Profile – Saint Lucia,” United Nations Food and Agriculture Organization, 2015. With Saint Lucia’s high dependency ratio and relatively unequal access to health services, the island’s poorest citizens are increasingly vulnerable to extreme weather events.104Dependency ratio is defined as the ratio of dependents–people younger than 15 or older than 64–to the working-age population–those ages 15-64. https://datacatalog.worldbank.org/age-dependency-ratio-working-age-population In the aftermath of Hurricane Tomas, health coverage was negatively impacted by over $3 million worth of damage to the hospitals across Saint Lucia, including Castries.105PAHO, “Case Studies in Grenada and Saint Lucia, (November 28, 2014), accessed November 23, 2019, https://www.paho.org/disasters/index.php?option=com_docman&view=download&category_slug=news-caribbean&alias=2362-case-studies-grenada-and-st-lucia-resilient-health-services&Itemid=1179&lang=en.
Disaster risk management is an area where Saint Lucia has developed a well-defined policy and legislative framework. The National Emergency Management Office has created and implemented strategies to mitigate the risk of hazards for public and private development.106R Miller, et al, Climate Change Adaptation Planning in Latin American and Caribbean Cities Complete Report: Castries, Saint Lucia, 2012: 65. However, as incapsulated in the high financial risk scores, these policies lack legal weight and expert interviews documented concern that the guidelines are not often followed or enforced.
Overall, the Government of Saint Lucia leads the island’s climate change adaptation and disaster risk management strategy. Critically, at the city-level there are no independent policy tools or implementation mechanisms for city led adaptation to climate change. The Castries City Council, the only functioning city level governmental entity, has a limited mandate and resources to undertake such tasks.107R Miller, et al, Climate Change Adaptation Planning in Latin American and Caribbean Cities Complete Report: Castries, Saint Lucia, 2012: 65. Castries City Council also has limited responsibility for post-disaster recovery, and does not play a key role in disaster risk reduction or climate change adaptation planning. In response, the national government, through the National Integrated Planning and Programme Unit, has enacted Castries Vision 2030 in collaboration with UN Office for Project Services and the Office of the Mayor of Castries. This new initiative has the potential to improve climate resilience planning, but at this stage it is too early to gauge the extent to which climate change will be incorporated into its strategy for Castries and the greater Castries-Gros Islet Corridor.
Recommended Action Areas
Castries faces many climate and ocean risks that will potentially have an impact on the local population and economy. Physical hazard indicators such as heatwaves (8.27), droughts (7.08), floods (5.39), and hurricanes (5.17), when overlaid with the two highest scoring categories, economics (7.20) and ecosystems (6.18), have the potential to overwhelm current adaptation strategies. Many of the vulnerabilities and potential solutions are encompassed in a broad shift towards a blue and green economy, whereby the value of ecosystem services is integrated into urban planning. These high scoring categories and indicators highlight the need for the following priority actions.
Improved City Planning
Multiple stressors identified through indicators scores in mangrove coverage (7.88) and freshwater quality (5.22), measure the consequences of urban coastal development (6.45), especially in the tourist sector. Despite the need for improved city planning, as with many small island states, adaptation planning in Saint Lucia is generally undertaken at the national level. Enhancing the risk management and planning capabilities of the Castries Constituency Council, or establishing new city level agencies to address adaptation and planning, is crucial for promoting local level adaptive capacity in the context of the city.108R Miller, et al, Climate Change Adaptation Planning in Latin American and Caribbean Cities Complete Report: Castries, Saint Lucia, 2012: 65. In this regard, Castries Vision 2030 could be used as a launch point for advancing integrated urban spatial planning.
Erosion and flooding are two key areas that increase vulnerability, especially for the poorest residents of Castries. Urban planning and building regulations remain limited and largely unenforced. Even minor rainfall can lead to flooding in Castries. In response, Castries has partnered with the World Bank to create the Management of Slope Stability in Communities project, which has reduced landslides.109“Saint Lucia” Leaders in Reducing Landslide Risk,” World Bank (June 11, 2013), accessed November 1, 2019, https://www.worldbank.org/en/news/feature/2013/06/11/saint-lucia-oecs-leader-reducing-landslide-risk. These efforts should be expanded. In the long-term, Castries needs stronger construction laws and greater enforcement, as well as increased funding and capacity building within the urban planning authorities so that accurate zoning maps and regulations can be crafted to reduce vulnerability.110R Miller, et al, Climate Change Adaptation Planning in Latin American and Caribbean Cities Complete Report: Castries, Saint Lucia, 2012: 65.
Diversify Economic Output and Ensure a Sustainable Tourism Industry
The rapid pace of climate change is increasing the financial costs to the tourism sector, highlighting the urgent need for Saint Lucia to diversify its economy. This can be done through public and private investment that promotes economic diversification across service and industrial sectors, including light manufacturing, agricultural crops, and finance.
Due to the construction of hotels and related infrastructure without strategic regional planning111R Miller, et al, Climate Change Adaptation Planning in Latin American and Caribbean Cities Complete Report: Castries, Saint Lucia, 2012: ii., the tourism sector has negatively impacted Castries’ capacity to build resilience against risks such as inland flooding, storm surge, and hurricanes. The Government has recently announced more hotel projects to create opportunities in both the tourism and construction sectors.112Government of Saint Lucia, “SLTB Announces Island wide Hotel Expansion,” Saint Lucia – Access Government, (June 12, 2017), accessed September 2, 2019, https://www.govt.lc/news/sltb-announces-islandwide-hotel-expansion. However, these programs must be balanced against the negative impacts of tourism, such as poor waste management and the destruction of ecosystems, as Saint Lucia’s natural beauty is a vital part of its attraction as a tourist destination. Ecosystem services provided by the coastal environment play a critical role in protecting coastal infrastructure from extreme weather events and maintaining marine ecosystems and their biodiversity.113Lauretta Burke, Suzie Greenhalgh, Daniel Prager, and Emily Cooper, “Coastal Capital – Economic Valuation of Coral Reefs in Tobago and St. Lucia,” The Economic Valuation of Coral Reefs in the Caribbean. World Resource Institute, 2018.
Finally, while unemployment has declined slightly, in part due to growth in the tourism sector, it continues to be a source of vulnerability for Castries.114IMF, “St. Lucia: Staff Concluding Statement of the 2019 Article IV Mission,” International Monetary Fund, (November 18, 2019), accessed December 2, 2019, https://www.imf.org/en/News/Articles/2019/11/18/mcs111819-st-lucia-staff-concluding-statement-of-the-2019-article-iv-mission. In response, the Government of Saint Lucia has sought to diversify employment opportunities outside of tourism, through increasing the viability of agricultural employment115Office of the Prime Minister, “Government Renews Commitment to Employment,” Saint Lucia – Access Government, (June 13, 2017), accessed November 20, 2019, https://www.govt.lc/news/government-renews-commitment-to-employment. and by implementing a National Apprenticeship Program.116Anicia Antoine, “National Apprenticeship Program Students Graduate,” Saint Lucia – Access Government, (October 3, 2019), November 3, 2019, https://www.govt.lc/news/national-apprenticeship-program-students-graduate. These efforts should be continued through expanded investment in skills training.
Climate Resilient Infrastructure
As infrastructure is located on the coast and subject to increasingly extreme weather events, it is critical that city infrastructure adapt to the changing climate. This includes the Castries waterfront, transportation, energy, and water infrastructure. However, the relative vulnerability of critical infrastructure depends on many factors, including building materials, design, maintenance, and past damage.117R Miller, et al, Climate Change Adaptation Planning in Latin American and Caribbean Cities Complete Report: Castries, Saint Lucia, 2012: 90.

Given its reliance on rainfall, the government of Saint Lucia has recognized freshwater as a vulnerable resource.118Government of Saint Lucia, “Saint Lucia’s Sectoral Adaptation Strategy and Action Plan for the Water Sector (Water SASAP) 2018- 2028, under the National Adaptation Planning Process,” Department of Sustainable Development, Ministry of Education, Innovation, Gender Relations and Sustainable Development and Department of Agriculture, Fisheries, Natural Resources and Cooperatives, Ministry of Agriculture, Fisheries, Physical Planning, Natural Resources and Cooperatives, 2018. In response, the National Utilities Regulatory Commission (NURC) was formed in 2016 to better manage water resources. As part of the NURC, the Operations and Maintenance Management system was developed to protect and maintain Saint Lucia’s water supply, which has reduced its risk to climate change. These efforts need to be expanded, with an increased focus on adopting water conservation practices, including increasing water efficiency across industries, particularly in the tourism sector.
Damage to roads impairs post-disaster response and stalls economic activity, particularly in the socially vulnerable areas of East and South Castries. Improving road resilience, especially in areas prone to slope instability and coastal flooding, should be prioritized. Finally, conducting a detailed vulnerability analysis of selected critical infrastructure would serve to identify which structures and systems are most vulnerable and arm decision makers with recommendations on how to build resilience into the system.
Kingston, Jamaica
Located in a one of the world’s deepest natural harbors and backed by the Blue Mountains, Kingston is the focal point for Jamaica’s commercial, industrial, and service sectors. Similar to other coastal cities the Caribbean, Kingston has experienced urbanization over the last few decades.119Doneika Simms, “The Effects of Urbanization on Natural Resources in Jamaica,” 44th ISOCARP Congress, 2008. To fully capture climate and ocean risks in Kingston, the study area was expanded to include the neighboring city of Portmore, as the majority of its residents work in Kingston. The population of this study area is 765,000, or 26 percent of the population of Jamaica.
The CORVI risk profile shows that climate and ocean risks to Kingston are spread across multiple categories. Ecosystems services such as coral reefs, sea grass beds, and mangrove forests scored highest for risk, which impacts Kingston’s ability to combat climate risks. In addition, flooding after rainfall is made worse by degraded watersheds surrounding the city and by poor waste management practices within the city. These risks are further compounded by increasing extreme weather events such as hurricanes.
CORVI findings show that Kingston’s diverse economy lowers its vulnerability to extreme weather events, as it is not as dependent on one industry for its economic security. However, risks including relatively high levels of unplanned settlements and squatter communities, as well as poor construction practices, lessen Kingston’s ability to recover from extreme weather events. Relatively high levels of crime in certain neighborhoods of Kingston are reflected in indicators which measure social cohesion. In response, the Government of Jamaica declared a state of emergency in parts of Kingston and continues to work to tackle these social issues. However, in the event of an extreme storm, these resources could be diverted, potentially increasing the risk of social instability. Finally, climate change is negatively impacting certain agricultural sectors, such as coffee growing in the Blue Mountains on the outskirts of Kingston.
The Government of Jamaica has been recognized globally for its leadership in building resilience to climate change. Its national development plan, encompassed in the Vision 2030 Report, identifies hazard risk reduction and adaptation to climate change as critical areas for development.120PIOJ, “Vision 2030 Jamaica: National Development Plan,” Planning Institute of Jamaica, 2009. While overall CORVI results show Kingston is well placed to combat the effects of climate change, the CORVI risk profile identifies three priority areas for action:
- Build resilience in marine ecosystems and city watersheds
- Improve urban city planning
- Continue to address social issues related to vulnerability and integrate them into disaster response planning
With these targeted efforts and implementation of its Vision 2030 Plan, Kingston can continue to guard against growing climate risks.
Kingston: Ecological Risk
In common with many low-lying coastal cities, Kingston’s metro area is at risk from flooding.121Arpita Nandi, Arpita Mandal, Matthew Wilson, and David Smith, “Flood Hazard Mapping in Jamaica Using Principal Component Analysis and Logistic Regression,” Environmental Earth Sciences 75, no. 6 (2016): 465. The risk is exacerbated by degraded watersheds and lost wetlands, which heightens the impact of hurricanes and other extreme weather in the study area.
- In the ECOSYSTEMS category (expert weighted avg 5.78) high risk scores are recorded in sea grass beds (8.13) and mangrove (7.91) coverage, as well as the health of existing coral reefs (7.86).
- The CLIMATE category (expert weighted avg 5.33) shows that while Kingston is highly vulnerable to hurricanes (7.65) it has been successful at limiting the impact of extreme weather on city residents, as reflected in the medium risk score for people affected by extreme weather (3.21).
- In the FISHERIES category (expert weighted avg 5.16), there are medium-high scores in offshore fish stock status (6.95), a lack of fisheries that are certified as sustainable by the marine stewardship council (6.95), and increases in incidences of foreign vessels fishing (6.25), all of which demonstrate growing risks to the fishing sector.
- While there are data gaps in the GEOLOGY/WATER category (expert weighted avg 4.48), data did show a high percent of metro area at risk from flooding (5.98) which is identified as medium-high risk.122Five indicators in the Geology/Water category did not pass the data quality threshold. These indicators are GW3 Degree of Soil Salinity in Arable Lands; GW5 Rate of Coastal Erosion; GW6 Degree of Saltwater Intrusion in Coastal Aquifers; GW7 Piped Water Supply; and GW8 Proportion of Bodies of Water with High Water Quality.
Ensuring watersheds drain correctly is crucial for building resilience against flood risk. However, urban development in Kingston, coupled with the removal of ecosystems such as forests and vegetation, has increased flood risk across the study area. This effect is exacerbated by intense storms, as well as poor waste management practices and drainage systems that have not kept pace with the development of the city. Of the seven major gully systems in the study area, only one is designed to accommodate massive flood discharge, making the city more vulnerable to flooding.123R. Ahmad, “Protecting Built Environment in a Natural Hazard-Prone City,” (Kingston: U.W.I. Press, 2005). The negative impact of degraded watersheds was also highlighted in expert interviews, which noted that urban planning did not adequately consider its impact on watershed management.
Marine ecosystems that provide vital services to the study area, have experienced significant degradation over the past decades, as captured in high CORVI risk scores across ecosystem services. Coral reefs, mangrove forests, and seagrass beds offer two primary benefits to Kingston. By acting as a natural barrier between the urban area and ocean risks, nature-based defenses lessen the power of extreme weather events and reduce the risk of storm surge and associated flooding. Ecosystems also play a critical role in supporting fisheries in Jamaica’s exclusive economic zone. They also provide habitats to commercially caught fish in the early stages of their life cycle.
Within the study area, marine ecosystem services are concentrated in two locations: Portmore and the Palisadoes Peninsula. In part due to Kingston’s urbanization, the municipality of Portmore was expanded to ease the burden on Kingston city and reduce urban density. While this was successful, the expansion of the urban area led to the removal of mangrove forests from the Portmore coastline.124B Wade and D Webber, “Coastal Zone Management,” in Ivan Goodbody and Elizabeth Thomas-Hope (eds.) Natural Resource Management for Sustainable Development in the Caribbean (Kingston: Canoe Press, 2002). The Palisadoes Peninsula, a thin spit of land that protects Kingston Harbour, has also suffered from ecosystem degradation. It was once covered in mangroves, but the development and expansion of critical infrastructure such as Norman Manley International Airport has led to a significant reduction in mangroves coverage. This has increased soil erosion because mangrove roots are critical for stabilizing sandy soil.125P Williams, “Palisadoes in Peril: U.W.I., N.E.P.A. Replanting Mangroves,” The Jamaican Sunday Gleaner Archive, 2008. Moreover, coastal erosion threatens the road that connects the airport to the city.
Coral reefs and seagrass beds have also declined nationally across Jamaica. The reduction is driven by a combination of urban pollution, rising sea temperatures, and damage from hurricanes.126“Coastal Capital: Jamaica The Economic Contribution of Jamaica’s Coral Reefs,” Coastal Capital project in the Caribbean. The World Resources Institute, n.d. Despite declines in national coral cover from a high of 50 percent in 1970 to less than five percent by 1990127“Coral Reefs of Jamaica Status and Trends 2007” Jamaica’s National Report: Ecosystems Management Branch National Environment and Planning Agency, March 2018., recent assessments by the National Environment and Planning Agency assess the Palisadoes Port Royal Protected Area as “fair” on the Coral Reef Index.128NEPA, “Coral Reefs of Jamaica, An Evaluation of Ecosystem Health: 2013,” The National Environment and Planning Agency, 2014: 15. However, coral reefs in the study area continue to be at risk, which is reflected in the high risk for health of existing coral reefs (7.86) indicator.
Recognizing the cost effectiveness of ecosystem-based defenses compared to physical infrastructure such as sea dykes and levees, the Government of Jamaica has invested in a series of restoration projects to protect and restore mangrove forests. Kingston has restored some mangrove ecosystems in the study area, as reflected in the lower CORVI score in current mangrove health (5.16) as compared to mangrove coverage (7.91). One recent example of these efforts is the Palisadoes Mangrove Planting Project.129NWA “The Palisadoes Mangrove Replanting Project,” National Works Agency, (August 4, 2015), accessed August 20, 2019, https://www.nwa.gov.jm/news/palisadoes-mangrove-replanting-project. This project, which has the goal of planting 6,000 mangrove saplings, along with measures to improve dune based coastal defenses, are part of larger efforts to better balance environmental and economic considerations in Kingston Harbour.

Overall, seagrass beds, mangrove forests, and coral reefs are important to Kingston as they provide coastal protection, maintain fisheries, and mediate runoff. Improvements to maintain ecosystem health decrease the risk of further loss of coverage in the future and they strengthen the ecosystems’ ability to provide crucial ecosystem services of habitat and storm protection.
While of secondary importance to the economic and food security of Kingston, fisheries remain an important component of resilience. Nearshore fisheries around Jamaica are overfished.130K Aiken and G.A. Kong, “The Marine Fisheries of Jamaica,” The ICLARM Quarterly 23, no. 1 (January 2000). Jamaica has sought to build resilience in their fisheries sector by strengthening fisheries management capacity through the recently revised 2018 Fisheries Act and expanding fish sanctuaries. This new Act will increase fines for violating fishery management regulations. However, it remains unclear whether monitoring and enforcement capacity will match the law’s intent.131FAO, “Jamaica Passes New Fisheries Act,” United Nations Food and Agricultural Organization, (October 26, 2018), accessed November 1, 2019, https://www.fao.org/jamaica-bahamas-and-belize/news/detail-events/en/c/1184193/. Furthermore, maintaining accurate data for coral reef fisheries remains a challenge for effective long-term fisheries management.132Daniel Pauly and Dirk Zeller, “Accurate Catches and the Sustainability of Coral Reef Fisheries,” Current Opinion in Environmental Sustainability 7 (April 2014): 44–51.
Kingston: Financial Risk
In comparison to other coastal cities in the region, Kingston’s economic diversity is a strength, as it does not rely on any one sector for its economic security. However, with 90 percent of its national economy produced in coastal zones, Jamaica remains economically vulnerable.
- The ECONOMICS category (expert weighted avg 5.85) highlights medium-high scores in national GDP per capita (7.00), urban unemployment (6.80), and public debt (6.50), all of which limit the capacity of Kingston to build resilience against climate change.
- In the INFRASTRUCTURE category (expert weighted avg 5.14), a high risk score for unplanned settlement construction (8.25), as well as medium high risk scores in level of commercial damage from extreme weather events (6.00) and level of grid resilience (5.20) represent key risk areas which need to be integrated into city planning. Separately, while insufficient data was collected to produce a CORVI risk score for the airport resilience indicator, multiple experts identified Norman Manley International Airport as at risk from growing climate and ocean risks.133Seven indicators in the infrastructure category did not pass the data quality threshold. These indicators are I1 Percent of Low-Income Housing in Relation to Flood Zones; I4 Level of Housing Damage from Extreme Weather Events; I5 Level of Shoreline Development; I9 Level of Water Distribution Infrastructure Resilience; I10 Proportion of Wastewater Safely Treated; I13 Level of resilience for Airports; and I14 Level of Resilience for Ports and Shipping.
- Findings from the MAJOR INDUSTRIES category (expert weighted avg 4.55) show that Jamaica’s economy is diverse, with only one medium-high score for percent of economy based in agriculture (5.57), while other important industries, such as tourism (4.80), offshore fishing (3.80), nearshore fishing (3.20), scored medium risk.134Two indicators in the Major Industries category. These indicators are MI5 Percent of National Economy Based in Port and Shipping Industries and MI6 Diversity of Lodging Types.
Over the past 25 years, the impact of extreme weather on Jamaica’s GDP has greatly increased. Between 1990 and 2000, damages from disasters in Jamaica cost an estimated 12.6 percent of GDP.135Jamaica Social Investment Fund, “Jamaica Disaster Vulnerability Reduction Project,” Jamaica Disaster Vulnerability Reduction Project, n.d., accessed December 4, 2019, https://www.jsif.org/content/jamaica-disaster-vulnerability-reduction-project. Between 2001 and 2010, the loss has tripled compared to the previous decade. During this period, there were ten major events with far-reaching impacts, affecting approximately 80 percent of the national population and causing nearly $1.21 billion in damages.136Jamaica Social Investment Fund, “Jamaica Disaster Vulnerability Reduction Project,” Jamaica Disaster Vulnerability Reduction Project, n.d., accessed December 4, 2019, https://www.jsif.org/content/jamaica-disaster-vulnerability-reduction-project.
The economic diversity of Kingston is a source of resilience, yet specific sectors are more at risk from climate change than others. In Jamaica, the negative impacts of climate change to the tourist sector are concentrated outside the study area, such as in Montego Bay. Nevertheless, with many tourist firms headquartered in Kingston, as well as the importance of tourism for foreign exchange earnings, the threat posed by climate change to tourism still presents a risk to Kingston. The agricultural sector is also threatened by rising temperatures and droughts. This is compounded by the fact that the agricultural sector in Jamaica is heavily reliant on rainfall for irrigation.137Jeff Popke, Scott Curtis, and Douglas W. Gamble, “A Social Justice Framing of Climate Change Discourse and Policy: Adaptation, Resilience and Vulnerability in a Jamaican Agricultural Landscape,” Geoforum 73 (July 2016): 70–80. Relevant to the study area, coffee growing in the Blue Mountains located on the outskirts of Kingston, is increasingly under threat from climate change. The sector almost entirely relies on rainfall, which has become increasingly erratic, threatening the economic security of farmers.138Anne-Teresa Birthwright, “Jamaica’s Coffee Farmers Are Resisting Climate Change,” Food Tank, (October 14, 2017), accessed September 3, 2019, https://foodtank.com/news/2017/10/bcfn-jamaica-climate-resilience/.
The risk of flooding in Kingston due to degraded watersheds is also a concern. While this is indicated in the ecological risk indicators, it also impacts financial risk. Flooding in the metropolitan area represents a risk both to human health and economic activity.139Chris Burgess, Michael Taylor, Tannecia Stephenson, Arpita Mandal, and Lesiska Powell, “A Macro-Scale Flood Risk Model for Jamaica with Impact of Climate Variability,” Natural Hazards 78, no. 1 (2015): 231-256. Not only is flood damage costly to repair, it can make it more difficult for businesses to recover, leading to suppressed long-term economic growth.140K.J. Tierney, “Businesses and Disasters: Vulnerability, Impacts, and Recovery,” in Handbook of Disaster Research. Handbooks of Sociology and Social Research (New York: Springer, 2007).
Finally, critical transport infrastructure such as roads, Kingston Port, and Norman Manley International Airport are at risk from extreme weather events. For example, during Hurricane Ivan in 2004, the greatest financial cost from the extreme weather event was borne by infrastructure, accounting for 45 percent of the overall costs, largely due to destruction to roads and bridges.141 Jamaica Social Investment Fund, “Jamaica Disaster Vulnerability Reduction Project,” Jamaica Disaster Vulnerability Reduction Project, n.d., accessed December 4, 2019, https://www.jsif.org/content/jamaica-disaster-vulnerability-reduction-project. Moreover, in recent decades informal settlement construction has increased across the study area. This has added stress to the delivery of social services and compounded the risk of flooding.142Interview with Ministry of Industry, Commerce, Agriculture, and Fisheries and the Rural Agricultural Development Authority. Interview’s conducted in May 2019. Such development tends to be located around gullies and riverbanks which are often more vulnerable to extreme weather events as flood waters are funneled to these areas.
Infrastructure risks also intersect with high risk economic indicators including relatively high levels of urban unemployment, informal economic activity, and low-income levels. Informal housing settlements are expanding, which is the result of unemployment, poverty, and a lack of alternative housing. This is further exacerbated by residents needing to be closer to urban work opportunities.143David Williams, María Máñez Costa, Catherine Sutherland, Louis Celliers, and Jürgen Scheffran, “Vulnerability of Informal Settlements in the Context of Rapid Urbanization and Climate Change,” Environment and Urbanization 31, no. 1 (January 28, 2019): 157–76. In response, the Jamaican Government has sought to invest in low-income housing developments in Kingston.144Alecia Smith, “Informal Settlements to Be Regularised,” Jamaica Information Service, (February 24, 2017), accessed October 2, 2019, https://jis.gov.jm/informal-settlements-regularised/. However, syncing these development measures with ecological considerations such as watershed management, identified in the ecological risk section, remains a challenge.
Due to data gaps, the research team was unable to quantify the resilience of freshwater infrastructure, seaports, and the airport. However, expert interviews were used to provide a broad assessment of risks in these areas. Norman Manley International Airport, located on Palisadoes, and the Kingston Container Terminal are both critical to the economic success of Kingston. The container terminal is the largest in the Caribbean and contributes significantly to the city’s economy.
However, they are both at risk from flooding, a phenomenon made worse by climate change and ecosystem degradation. The Norman Manley International Airport sits on average, three meters above sea level, making it vulnerable to flooding. This risk has increased with the degradation of coastal ecosystems including coral reefs and mangroves, which can mitigate the impact of storms.145Maria Fernanda Zermoglio and Owen Scott, “Vulnerability Assessment of Jamaica’s Transportation Sector,” ATLAS Task Order: Chemonics International, March 2018. Similarly, while access to the Kingston Container Terminal is less at risk of flooding, the terminal itself, particularly the storage area in the south terminal, sits less than one meter above sea level and is susceptible to storm surge.146Maria Fernanda Zermoglio and Owen Scott, “Vulnerability Assessment of Jamaica’s Transportation Sector,” ATLAS Task Order: Chemonics International, March 2018.
Kingston: Political Risk
Like many small island developing states in the Caribbean, Jamaica has a democratically elected government. Jamaica has also been recognized as a leader in climate change adaptation in the Caribbean. Since the establishment of a Climate Change Unit in 2012, Jamaica has viewed climate change as an integral component of its development strategy, which was outlined in its national development plan and Vision 2030 development goals.147USAID, “Progress Toward Climate Resilience in Jamaica,” ATLAS Task Order: USAID, June 2018. Jamaica’s National Development Plan and National Climate Change Policy Framework created coordination mechanisms through the establishment of Climate Change Focal Points in key national government ministries, departments, and agencies.148Government of Jamaica, “Intended Nationally Determined Contribution of Jamaica Communicated to the UNFCCC, (November 25, 2015), accessed October 20, 2019: 7. However, there is still a need for greater mainstreaming of climate change considerations in national policy, planning, and implementation, particularly as it relates to land and natural resource use.149Government of Jamaica, Climate Change Policy Framework for Jamaica, 2015.
- In the SOCIAL/DEMOGRAPHICS category (expert weighted avg 5.46) a large (8.20) and young (7.60) urban population were highlighted as high risk areas.
- The GOVERNANCE category (expert weighted avg 5.38) highlighted concerns related to access to healthcare (6.73), and a lack of perceived transparency (5.64) as key issues which could undermine trust in government institutions.
- The STABILITY category (expert weighted avg 4.43) was the lowest scoring category, reflecting Jamaica’s diverse employment across multiple industries. The only one medium-high score was incidences of instability (6.00) which reflects higher levels of crime in certain city neighborhoods.150One indicator in the stability category did not pass the quality threshold. This indicator is S3 Percent of People Employed in Port and Shipping Industries.
Jamaica’s vulnerability to multiple natural and human-induced hazards, such as hurricanes and floods, and the negative impact of these hazards to social and economic systems, has posed a significant impediment to sustainable development.151PAHO, “Jamaica: Health in the Americas 2017,” Pan American Health Organization, (2017), accessed December 4, 2019, https://www.paho.org/salud-en-las-americas-2017/?p=2457.

Demographic shifts in Kingston have impacted its ability to build capacity against climate and ocean risks. Coastal migration continues to compound ecological and financial risks, such as informal building construction and flood risk, which reduces the capacity of individuals to adequately respond to extreme weather events. This is reflected in high CORVI risk scores for urban population (8.20) and a medium-high urbanization score (6.60). Moreover, a high dependency ratio (7.00) increases social vulnerability to extreme weather events.152Dependency ratio is defined as the ratio of dependents (people younger than 15 or older than 64) to the working-age population (those ages 15-64). World Bank. https://datacatalog.worldbank.org/age-dependency-ratio-working-age-population The population over the age of 65 is the fastest growing age group in the country. This raises concerns about access to healthcare which will need to be factored into future climate adaptation planning as this population cannot respond as easily to extreme weather events and will need greater medical attention.153PIOJ, “Vision 2030 Jamaica: National Development Plan,” Planning Institute of Jamaica, 2009: 40.
Medium-high and high scores in other social indicators such as urban population below the age of 30 (7.60), rule of law (5.82), and incidences of civil unrest (6.00) are exacerbated by relatively high levels of crime in certain neighborhoods in Kingston.154Overseas Security Advisory Council, “Jamaica 2019 Crime & Safety Report,” U.S. Department of State, (2019), accessed January 12, 2020, https://www.osac.gov/Country/Jamaica/Content/Detail/Report/1d98b2df-fd4b-485f-aa62-15f4aed245ef. Fears of crime led the Jamaican Government to enact a state of emergency in 2019, which included parts of Kingston.155Caribbean National Weekly, “State of Emergency Declared in Kingston, Jamaica,” (July 7, 2019), accessed January 12, 2020, https://www.caribbeannationalweekly.com/uncategorized/state-of-emergency-declared-in-kingston-jamaica/. In an event of extreme weather such as a hurricane, overstretched law enforcement and disaster officials might not be able to continue these operations to combat crime, which could increase the risk of social tension. While to date this has not been seen in Kingston, evidence from Puerto Rico and Saint Martin suggests that such a scenario should be contemplated and integrated into climate resilience planning.156Azam Ahmed and Kirk Semple, “Desperation Mounts in Caribbean Islands: ‘All the Food Is Gone’,” New York Times, (September 10, 2017), accessed January 5, https://www.nytimes.com/2017/09/10/world/americas/irma-caribbean-st-martin.html?mcubz=0.
Ultimately, there needs to be greater appreciation of the interrelationship between environmental protection and management, and economic development to ensure that climate fragility risks are effectively addressed.
Recommended Action Areas
CORVI results show that Kingston has had success in building resilience to climate and ocean risks. The incorporation of adaptation planning into Jamaica’s national development goals and its economic diversity are both important aspects of its resilience strategy. The CORVI risk profile shows that risk is spread across multiple medium-high category scores.
However, high risk scores in indicators such as sea grass (8.13) and mangrove (7.91) coverage, informal settlements construction (8.25), and a large urban population (8.20) have the potential to stress current adaptation strategies.
Based on the CORVI assessment of three cross-cutting areas: ecosystem resilience, city planning and reducing social vulnerability were identified from the highest scoring categories and indicators.
Building Resilience in Marine Ecosystems
Declining ecosystem health was identified both through CORVI risk results and expert interviews as a key risk factor contributing to increased climate and ocean risk.
Ecosystem services were among the highest scoring indicators in the CORVI assessment. Limited nature-based coastal defenses increase storm surge risk across the study area. Specific risks were prevalent in Portmore and Norman Manley International Airport. Despite recent attempts to restore ecosystems across the study area, these efforts are comparatively small-scale and pollution continues to pose a significant threat. Reducing urban pollution through improved waste management, especially in housing and informal settlements that border key watersheds, would improve ecosystem health across the study area. The protection and promotion of these natural defenses would not only improve the resilience of Kingston to extreme weather events, but also provide marine ecosystem benefits to Kingston Harbour.
Building ecosystem resilience will also benefit nearshore fisheries. However, such efforts should be matched by adequate funding resources to implement the new Fisheries Act. In particular, capacity to monitor and protect areas from IUU fishing should be prioritized.
Improved Urban Planning
Coastal expansion has led to the degradation of mangroves and wetlands in and around the Kingston and Portmore metropolitan area. This has in turn increased the vulnerability of informal housing, commercial, and public infrastructure to flooding as water can no longer drain effectively or benefit sufficiently from the protective capacity provided by mangrove forests. With flood risks from increased precipitation, storm surge, and hurricanes, improved urban planning which incorporates the sustainable management of watersheds and ecosystems should be prioritized.
One barrier to improved urban planning, noted by several expert interviews, is a lack of accessible and comparable data. Data is needed to inform resilience planning and ensure that such investment is integrated across the different areas of risk. Significant data is being collected on climate risks to physical infrastructure, such as the airport and seaport, and ecosystems, such as coral reefs and mangroves. However, these efforts are often dispersed and uncoordinated, and are often only available within the ministry or agency that developed them. Harmonizing dissemination mechanisms into a central database, that integrates climatic geophysical, social, and infrastructure data is vital to ensure investments are climate sensitive.157Maria Fernanda Zermoglio and Owen Scott, “Vulnerability Assessment of Jamaica’s Transportation Sector,” ATLAS Task Order: Chemonics International, March 2018: 8.
Addressing the Social Component
For Kingston, social and demographic changes underpin many of the risk dynamics highlighted in the CORVI assessment. The physical risk that climate change poses to the city is compounded by social and demographic dynamics such as urbanization and the construction of informal settlements on unstable land, which increases the study area’s vulnerability to flood risk and freshwater pollution, as well as contributes to degraded ecosystems.
Moreover, social vulnerability stemming from crime and youth unemployment places an additional burden on government ministries, which are often at the forefront of disaster response. Working to lower crime levels and expand employment opportunities will decrease the risk of social tension in the aftermath of an extreme weather event. Continuing to address these risks should be prioritized if resilience gains in other areas are to be sustained.
Enhancing access to social protection schemes for vulnerable populations, to include skills education and reducing urban poverty, can improve the capacity of these residents to respond to extreme weather events. Further investment in the social components of climate change resilience can help Kingston build and integrate resilience across these three areas.
CORVI: A Decision Tool for the Future
The CORVI Response
As the risks from climate change continue to grow, business leaders, financial institutions, and government policy makers need tools that can help them incorporate climate risk and its uncertainties into future planning decisions. Climate change is accelerating in pace and scale and so too are the devastating consequences to the businesses and people living in coastal cities. Increased drought, heat, sea level rise, storm intensity, and flooding, when coupled with social and economic factors, intensifies the risk of food, economic, and environmental insecurity. The result is that decision makers are being forced to adapt now to the uncertain future impacts of climate change.
Adapting to Uncertainties
Mitigation is the first line of defense against climate change, but it remains increasingly unlikely that governments will meet the 1.5oC emissions target. While these efforts must continue, it is critical that individuals, communities, and the private sector continue to adapt and build resilience against this fast-changing climate. How decision makers incorporate such uncertainties into their management choices will depend on their appetite for risk, overall-risk management approach, and the tools at their disposal to understand the risks they face.
Building Resilience into Future Decisions
Implementing effective adaptation measures is challenging for many reasons. The economic cost of adaptation is high. Adaptation measures have technical limitations. Successful adaptation measures must consider important economic, ecological, and social trade-offs, including which communities, people and businesses to protect. CORVI is a tool designed to assist decision makers as they contemplate priority actions needed to build climate risk into their future operations. This includes helping to inform adaptation choices related to capital lending, urban planning, infrastructure development, service delivery, and supply chain management. CORVI will also assist the insurance industry as they develop cost effective risk management solutions.
Without integrated, forward planning, there is a high potential for suboptimal investments, wasted resources, and reactive rather than proactive decision making.
Meeting the Need for Integrated Urban Planning
Coastal cities are at the forefront of these changes. Rapidly growing coastal urban populations will account for 40 percent of the global population by 2040. Climate change will cause people in coastal cities to become more vulnerable to rising sea levels, heat emergencies, and the other climate related concerns. As both case studies in this report demonstrate, coastal urbanization can be a vicious cycle, concentrating people and property in areas that are vulnerable to increased climate and ocean risks. The destruction of nature-based defenses, such as mangroves, weakens the resilience of a city to coastal flooding and harmful storm impacts. These impacts have a disproportionate effect on poorer neighborhoods and businesses. To support integrated urban planning, CORVI that combines ecological, financial, and political risk factors to aid overall adaptation efforts. Without addressing cascading risks in a holistic manner, decisions may be made in a vacuum, building resilience in one area while exacerbating risk in another.
Highlighting Cascading Risks on the Ground
Both of the CORVI case studies in Castries and Kingston illustrate cascading risks. In Castries, financial risk due to high reliance on the tourism sector has also increased ecological risk as the industry’s expansion degraded ecosystems. In addition, high employment and dependence on the tourism sector has increased the vulnerability of people employed in that sector to the many risks associated with climate change. In Kingston, the intersection between degraded ecosystems and watershed management, and its impact on infrastructure, are exacerbated by social issues such as informal housing construction. This in turn increases individual vulnerability because the poorest and most exposed city residents often inhabit informal housing settlements which are susceptible to the devastating effects of extreme storms such as landslides and flooding.
A Decision Tool for the Future

By identifying key risk areas, CORVI enables government policy makers, public and private investors, and the insurance industry to better understand the linkages and drive funding into areas of greatest concern. The first two city risk profiles in Castries and Kingston demonstrate how the CORVI tool can aid decision makers by providing evidence to effectively prioritize investment for risk reduction in coastal cities. In 2020, CORVI will expand to cities in East Africa and the Pacific region and build new regional datasets. The CORVI project will conduct detailed city assessments in Mombasa, Kenya and Dar es Salaam, Tanzania, as well as in cities in Bangladesh, Fiji, and the Philippines. As more cities are added to the CORVI matrix, a comparative body of city level data will emerge, providing greater insights into the risks these cities face. Decision makers need to act now in the face of climate uncertainty. With this data and information, the CORVI tool is designed to help coastal cities build resilience against climate fragility risks before it is too late.
Appendix
CORVI Weighting
The final score for each category depends on how much each indicator contributes to the overall score. The weighting procedure incorporates three different elements: a minimum data threshold, data confidence, and indicator importance.
- Indicators must reach a minimum data threshold to be included in the final risk category score. To meet the criteria an indicator must have at least one of the following: empirical data source or at least 3 expert surveys. If an indicator does not meet this minimum criterion, it is excluded. However, it is important to note that these data gaps are still noted in the final report and expert interviews are used to describe risks where CORVI scores are not available. Highlighting these data gaps also acts as a signpost for future data collection.
- Indicators that contain more robust data are weighted more heavily. Robust data is measured by the quality of the empirical data source and by the number of expert surveys.
- Indicators are weighted within each risk category using subject matter expert responses. Survey respondents are asked to identify the two most important and the two least important indicators for understanding risk in each. These two criteria are combined into an overall weight for each indicator.
Data Sources
Empirical data sources were used to construct the 1-10 scales which is then used to weight expert surveys through the coherence check.
| Category | Data Sources |
|---|---|
| Geology/Water | Individual Country Statistic Offices; Global Fatal Landslide Database; World Bank; UN Environment; |
| Climate | EM-DAT International Disaster Dataset; National Aeronautics and Space Administration; National Oceanic and Atmospheric Administration; Pan American Health Organization |
| Ecosystems | Global Fatal Landslide Database; Ocean Health Index; Coral Reef Health Index; World Resources Institute |
| Social/Demographics | CIA World Factbook; Individual Country Statistic Offices; UN Population Division; World Bank |
| Economics | Individual Country Statistic Offices; International Labor Organization; UN Development Programme; World Bank |
| Major Industries | World Bank; Caribbean Regional Fisheries Mechanism Statistics; World Travel and Tourism Council |
| Fisheries | Individual Country Statistic Offices; Ocean Health Index; Environmental Performance Index; UN Food and Agriculture Organization; Sea Around Us Dataset |
| Infrastructure | Environmental Performance Index; International Energy Agency; Notre Dame Global Adaptation Initiative; United Nations Human Settlements Programme; World Bank; World Health Organization |
| Governance | Corruption Perceptions Index (Transparency International); INFORM Index for Risk Management; International Institute for Democracy and Electoral Assistance; Notre Dame Global Adaptation Initiative; Rule of Law Index (World Justice Project); World Bank |
| Stability | Caribbean Regional Fisheries Mechanism; International Labor Organization; Sea Around Us Dataset; UN Food and Agriculture Organization; World Travel and Tourism Council |
List of Organizations which provided expert surveys
Expert surveys were submitted by individuals from these organizations. In addition, some organizations opted to complete surveys as an institution. 22 surveys were collected for the Kingston assessment. 40 surveys were collected for the Castries assessment.
| Kingston, Jamaica | Castries, Saint Lucia |
|---|---|
| Caribbean Coastal Area Management Foundation | The Central Statistical Office of Saint Lucia |
| George Mason University, Center for Ocean-Land-Atmosphere Studies | George Mason University, Center for Ocean-Land-Atmosphere Studies |
| Ministry of Economic Growth and Job Creation | Ministry of Agriculture, Fisheries, Physical Planning, Natural Resources and Cooperatives |
| National Environment and Planning Agency | Organization of East Caribbean States |
| Office of Disaster Preparedness and Emergency Management | Saint Lucia Air and Sea Port Authority |
| Rutgers University, Department of Geography | Saint Lucia Chamber of Commerce, Industry, and Agriculture |
| Jamaica’s South East Regional Health Authority | Saint Lucia Department for Sustainable Development |
| The Nature Conservancy in Jamaica | Saint Lucia Electricity Services Limited |
| University of West Indies, Centre for Marine Sciences | Saint Lucia National Trust |
| Saint Lucia Tourism Authority | |
| United Nations Office for Project Services | |
| Saint Lucia Water Resources Management Agency |


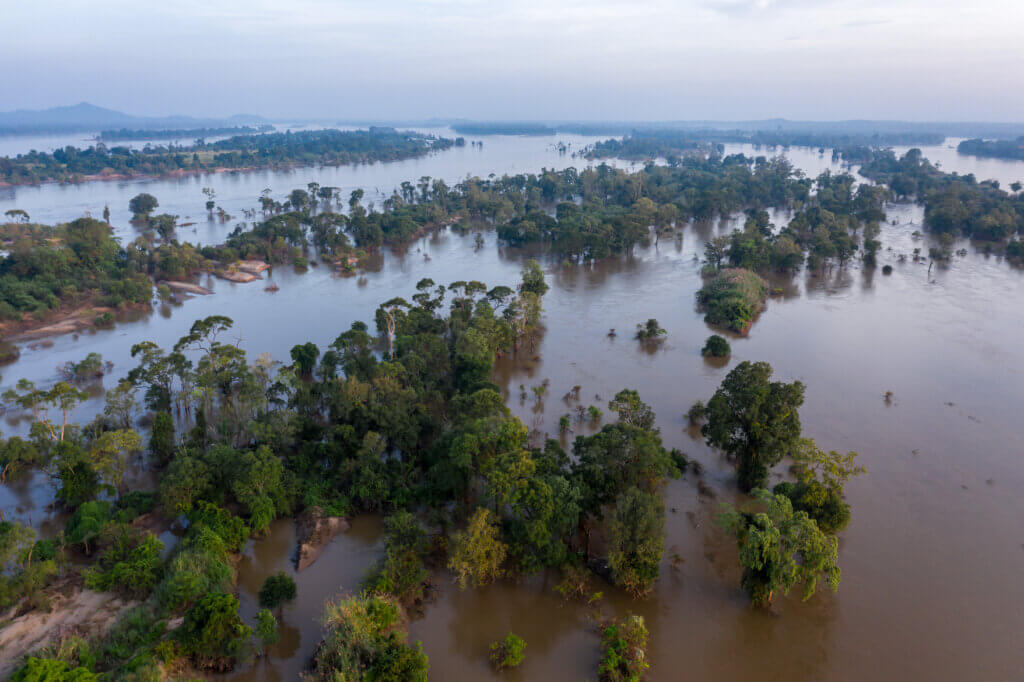


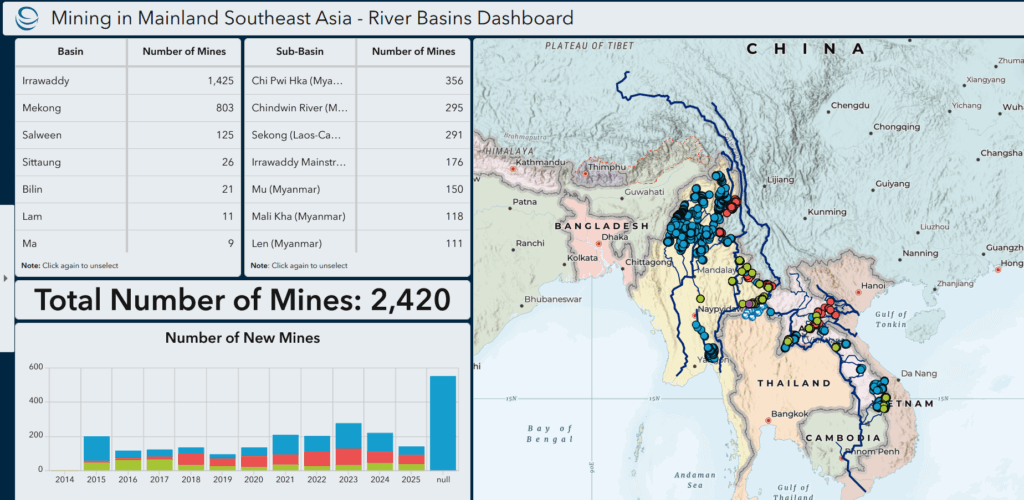


Community Adaptation for a Water Festival Without Clean Water