
Summary Findings
Mauritius is a small subtropical island country located in the Western Indian Ocean, just over 1,130 kilometers east of Madagascar. The country has one of the largest exclusive economic zones (EEZ) in the world, approximately 2.3 million square kilometers. The main island is home to approximately 1.2 million people, who are facing growing threats from rising sea levels, increasing ocean temperatures, and degraded and destroyed coastal and marine ecosystems. In addition, tropical cyclones, flash flooding, and stressed freshwater resources coupled with a high population density are causing Mauritius and its citizens to become increasingly vulnerable to climate change. The government has established the goal of becoming “an inclusive, high income, and green Mauritius,” with ambitious decarbonization and climate resilience targets.
In spring 2024, the Stimson Center, Commonwealth Blue Charter and the Mauritius Ministry of Blue Economy, Marine Resources, Fisheries, and Shipping conducted a CORVI Rapid Assessment on the main island of Mauritius. The assessment identified three major areas of climate risk and vulnerability: compounding threats in the coastal area, the tourism-based economy, and the fisheries sector.1For more detail about the CORVI methodology, please see Appendix 3.
The first cluster of risks and vulnerabilities relates to compounding threats to the island’s coastal zone. Sea level rise (SLR) of approximately 8 mm per year, which floods coastal communities and cause saltwater intrusion in Mauritius’ freshwater aquifers. The United Nations (UN) forecasts that freshwater will be stressed by 2025.2UNEP. “Mauritius Sets Goals to Curb the Triple Planetary Crisis,” January 24, 2023. http://www.unep.org/news-and-stories/story/mauritius-sets-goals-curb-triple-planetary-crisis. The Projected Change in Sea Level Rise is as the highest vulnerability indicator in the assessment (score of 9.5 out of 10.0).3All indicators are scored on a 1 (lowest vulnerability) to 10 (highest vulnerability) scale relative to other countries in East Africa. The impacts of SLR are further exacerbated by the loss of coverage of protective coastal ecosystems, such as mangroves. Damage from high winds from tropical cyclones and inland flooding due to heavy rainfall from the country’s mountainous interior which pours into the coastal area also threaten the coastal zone. Together, flooding and tropical cyclones cause an average of $113 million in direct damages4 Direct disaster losses refer to directly quantifiable losses such as the number of people killed and the damage to buildings, infrastructure and natural resources. Indirect disaster losses include declines in output or revenue, and impact on wellbeing of people, and generally arise from disruptions to the flow of goods and services as a result of a disaster. each year.5Global Facility for Disaster Reduction and Recovery. “Disaster Risk Profile: Mauritius.” Southwest Indian Ocean Risk Assessment and Financing Initiative, February 23, 2017. https://www.gfdrr.org/sites/default/files/publication/drp_mauritius.pdf. Much of Mauritius’ critical infrastructure – including Port Louis Harbor, major roadways, fishing infrastructure, and the capital of Port Louis – is located in the country’s coastal zone, battered by rising seas on one side and frequent inland flooding on the other.
The second cluster of risks and vulnerabilities identified through this assessment surrounds Mauritius’ tourism sector, which accounts for around 20 percent of its economy6Richardson, Katy, Roger Calow, Leigh Mayhew, Guy Jobbins, Gabrielle Daoust, Amy Waterson, Hannah Griffith, et al. “Climate Risk Report for the Southern Africa Region.” Met Office, ODI, FCDO, February 2023, 3. https://www.metoffice.gov.uk/binaries/content/assets/metofficegovuk/pdf/services/government/southern-africa-climate-risk-report-final-.pdf. and employs up to 22 percent of its workforce.7UNDP. “Re-Imagining the Future of Work Towards Building Back Better and Leaving No One Behind.” Accessed May 21, 2024. https://www.undp.org/mauritius-seychelles/re-imagining-future-work-towards-building-back-better-and-leaving-no-one-behind. The Percent of National Economy Based in the Tourism Industry (score of 7.6 out of 10.0) which is the sixth highest vulnerability indicator score in the assessment. The importance of the tourism industry to Mauritius’ overall economic health was underscored in 2020, when tourist arrivals plummeted, from 1.4 million in the prior year to 316,00 due to COVID 19 as a result of travel restrictions,8The World Bank. “International Tourism, Number of Arrivals – Mauritius.” World Tourism Organization, Yearbook of Tourism Statistics, Compendium of Tourism Statistics and data files, https://data.worldbank.org/indicator/ST.INT.ARVL?locations=MU. with the economy suffering a 14.5 percent contraction. Mauritius’ tourism sector is principally based on the sun-sand-sea model of tourism, with 90 percent of hotels located along the beachfront.9United Nations Capacity for Disaster Reduction Initiative (CADRI Partnership). “Disaster Risk Management: A Capacity Diagnosis – The Republic of Mauritius.” National Risk Reduction and Management Centre, Office of the United Nations Resident Coordinator, United Nations Country Team in Mauritius, CADRI Partnership, 2020. https://mauritius.un.org/sites/default/files/2021-10/Mauritius-Capacity-Diagnosis-Report_09102020.pdf. Those same beaches have lost over 10 meters in width over the past decade due to rising seas and coastal erosion,10Ibid. and key attractions like coral reefs are increasingly threatened by marine heatwaves. Extreme weather events, including tropical cyclones and flash flooding, also disrupt operations and damage critical assets, particularly roads and houses. The privatization of much of Mauritius’ coastline has resulted in a protest campaign against the loss of public access to the country’s beaches, showcasing dissatisfaction by some citizens from local coastal communities.
The third cluster of risks and vulnerabilities surrounds Mauritius’ fisheries sector. Fish and fish products make up approximately 15-19 percent of the country’s exports, and the government has identified the sector as a growth target.11SeafoodSource. “Mauritius Charts Growth Path for Fisheries and Aquaculture Sectors.” Accessed May 22, 2024. https://www.seafoodsource.com/news/supply-trade/mauritius-charts-fisheries-and-aquaculture-growth-path. In addition, 4,000 households located on or near the coast rely on coastal and offshore artisanal fishing and rely on it as an important source of protein.12Appadoo, C., Sultan, R., Simier, M. et al. Artisanal fishers in small island developing states and their perception of environmental change: the case study of Mauritius. Rev Fish Biol Fisheries 33, 611–628 (2023). https://doi.org/10.1007/s11160-022-09735-6. Respondents identified Nearshore Fish Stock Status (7.2 out of 10.0) and Percent of Fisheries Managed Sustainably (6.6 out of 10.0) as medium-high risks. Warming ocean temperatures, including marine heatwaves, may lead to reductions of fish populations and/or drive them to higher latitudes outside of Mauritius’ EEZ.13Cervigni, Raffaello, and Pasquale Lucio Scandizzo. The Ocean Economy in Mauritius. World Bank, Washington, DC, 2017. https://doi.org/10.1596/28562. Over 80 percent of artisanal fishers in Mauritius have reported reductions in fish quantity and diversity over the past 10-15 years.14Ibid. This loss of fish biomass threatens Mauritius’ economic and food security, especially for its most vulnerable populations.
Priority Recommendations
Based on the above risks and vulnerabilities three priority areas of action to build climate resilience in Mauritius were identified.
Develop and implement a sustainable and inclusive coastal zone management plan. Building on the 2020-2030 Environment Master Plan, add a new sustainable and inclusive coastal zone management plan. This could help Mauritius focus its adaptation and resilience strategies in its coastal zone. For example, by sharpening the focus to be more specific on activities and science in the coastal zone, it would help the Ministry of Environment, Solid Waste Management, and Climate Change identify specific actionable projects and policies and help access funding for implementation. A new coastal zone management plan could:
- Identify gray or hybrid15Hybrid approaches to coastal protection combine natural solutions with built infrastructure to effectively double-down on coastal protection benefits while affording additional co-benefits such as habitat creation and carbon sequestration. coastal protection options for certain areas due to high levels of maritime traffic, high population density and/or limited historical protective coastal ecosystems. Undertake multi-stakeholder consultations to manage the negative impacts of such options.
- Identify locations suitable for mangrove restoration and engage local communities in site-specific restoration processes. Design regulations and financial incentives to protect existing mangroves and other coastal ecosystems.
- Monitor the health of existing and restored mangroves through tools like the Mangrove Restoration Tracker Tool and develop strategies to help existing and restored mangroves keep up with rising sea levels.
- Begin conversations around “managed retreat” with communities that are unlikely to be sufficiently protected by nature-based solutions or hybrid coastal protection infrastructure.
- Integrate green stormwater management infrastructure – such as inland wetlands, bioswales, parks, and permeable pavement – into the Land Drainage Master Plan of 2022 to improve water retention, water filtration, and aquifer replenishment.
- Increase monitoring of groundwater levels, identify areas at high risk of saltwater intrusion, and establish a flexible water use regulation framework that is responsive to rainfall and groundwater levels.
Develop a climate adaptation plan for the tourism sector with the private sector. The tourism sector is uniquely vulnerable to Mauritius’ highest priority climate risks identified through this assessment. SLR and coral bleaching are threatening major tourist attractions. Tropical cyclones and flash flooding damage hotels and other key tourism assets. Stressed freshwater resources and overburdened solid waste management will also adversely impact daily tourism operations. A tourism specific adaptation plan that addresses the impacts from these compounding risks would help the tourism sector become more sustainable and resilient by focusing on the sector’s greatest risks and vulnerabilities. The following recommendations co-designed by the tourism sector and government could be part of tourism sector specific climate plan:
- Continue active outreach and engagement with all participants in the tourism sector, including hotels as well as guest houses, restaurants, tour companies, and others, to help identify how climate change will affect their operations and the specific steps businesses can take to build resilience.
- Work with the tourism sector businesses to draft business continuity plans for faster and more effective post-disaster recovery.
- Provide government recovery loans to small tourist businesses in the immediate aftermath of a tropical cyclone or other extreme weather event.
- Use parametric insurance to improve rapid recovery for coral reefs and other natural ecosystems that are important tourist attractions. Expand coral reef restoration and monitoring.
- Integrate hotels and other tourist sector actors into solid waste diversion efforts.
- Diversify Mauritius’ tourism model towards higher-value, lower-impact types of tourism, such as eco-tourism, and away from highly vulnerable, low-value “sun-sand-sea” tourism.
Co-develop a climate adaptation plan for the fisheries sector with the private sector. The fisheries sector is critical to the economic and food security of Mauritius, and fishers have already observed a reduction in the quantity and diversity of fish available in Mauritian waters. The following recommendations can help the government of Mauritius improve its management of artisanal and commercial fisheries in a way that is responsive to both a changing environment and the needs of the country’s fishing communities.
- Conduct baseline stock assessments of fish species important for Mauritius’ commercial and artisanal fishing sectors. Continue regular monitoring of changes to fish stocks and of invasive species, such as lionfish and crown-of-thorns starfish.
- Cooperate with neighboring countries to share data and information and provide early warning of likely future changes to fish stocks and environmental conditions, including marine heatwaves.
- Assess the level of effectiveness of existing regulations, including the country’s six fishing reserves and two marine parks.
- Establish a flexible regulatory framework that adjust fisheries effort limits to changes in fish stock health on a real-time, or at least seasonal, basis.
- Conduct robust, regular engagement between the Ministry of Blue Economy, Marine Resources, Fisheries, and Shipping, the fishing industry, and fishing communities to strengthen data collection, inform policy and regulation design, and increase buy-in.
A complete list of the risk indicators used for this rapid assessment is provided in Appendix 1, a list of organizations who responded to surveys is included in Appendix 2, and a detailed methodology is provided in Appendix 3.
CORVI Analysis
The following sections provide a more in-depth look at the climate vulnerabilities facing Mauritius delineated by 35 selected indicators across ecological, economic, and social risk categories.
Ecological Risk
Mauritius benefits from a unique and diverse ecosystem, including reefs, estuaries, mangroves, and saltwater wetlands that play a vital role in protecting its coastline and supporting its fisheries. The CORVI Ecological risk area contains four of the five highest risk indicator scores in this assessment, highlighting significant vulnerability from limited mangrove coverage together with worsening climate hazards, including sea level rise (SLR), more frequent flooding, and coral bleaching. All indicators are scored on a 1 (lowest vulnerability) to 10 (highest vulnerability) scale relative to other countries in the wider East Africa region.
- In the GEOLOGY/WATER category, there are high and medium-high risk scores for projected change in sea level rise (9.5) and degree of saltwater intrusion in coastal aquifers (6.4), highlighting the risks from rapidly rising seas to the country’s vulnerable coastline and already stressed freshwater supplies.
- The FISHERIES category is the only category under Ecological Risk to have no indicators scored as high risk. Medium-high risk scores for nearshore fish stock status (7.2) and percent of fisheries managed sustainably (6.7) reflect the risks to Mauritius’ economic and food security from inadequate fisheries management compounded by climate hazards.
- The ECOSYSTEMS category includes two indicators scored as high risk, the level of coral reefs coverage (9.3) and level of mangrove coverage (8.3), emphasizing how historic and ongoing threats to Mauritius’ coastal and marine ecosystems leave its shoreline vulnerable and undermine the ecological foundation of key blue economy sectors, including tourism and fisheries.
- In the CLIMATE CHANGE category, has a high risk score for the number of flood events (7.7), reflecting the impacts of floods from extreme weather events and heavy rainfall to lives, livelihoods, housing, and infrastructure. The number of tropical cyclones (5.8) and change in sea surface temperature (5.1) scored as medium-high risk highlighting the risks from unpredictable extreme weather events, including marine heatwaves, that can be difficult to plan for.
Projected change in sea level rise (high risk, score of 9.5) is the indicator with the highest risk score of the entire risk profile. Between 1987 and 2000, in Mauritius sea levels rose by an average rate of 5.6 millimeters (mm) per year, which is 65 percent faster than the global average of 3.4 mm/year.16Republic of Mauritius. “First Biennial Update Report (BUR1) to the United Nations Framework Convention on Climate Change.” Ministry of Environment, Solid Waste Management and Climate Change, December 2021. https://unfccc.int/sites/default/files/resource/First%20Biennial%20Update%20Report%20-%20Republic%20of%20Mauritius.pdf. From 2011 to 2020, SLR has increased to 8 mm per year according to gauges in Port Louis.17Office of the United Nations High Commissioner for Human Rights. “Questionnaire in Relation to Human Rights Council Resolution 47/24 on Human Rights and Climate Change.” Ministry of Foreign Affairs, Regional Integration and International Trade (Human Rights Division), 2021. https://www.ohchr.org/sites/default/files/2022-03/mauritius.docx. Rising sea levels can lead to saltwater intrusions and the contamination of aquifers, reflected in degree of saltwater intrusion in coastal aquifers (medium-high risk, score of 6.4).18United States Department of Agriculture. “Saltwater Intrusion: A Growing Threat to Coastal Agriculture | USDA Climate Hubs.” Accessed May 21, 2024. https://www.climatehubs.usda.gov/hubs/northeast/topic/saltwater-intrusion-growing-threat-coastal-agriculture#:~:text=As%20sea%20levels%20rise%20along,table%20below%20the%20soil%20surface. Mauritius relies on groundwater as the main source of water19Richardson, Calow, Mayhew et al. Climate Risk Report for the Southern Africa Region (2023), 43. and gets 50%-60% of its domestic water supply from the Northern Aquifer.20Republic of Mauritius. “Third National Communication Report to the United Nations Framework Convention on Climate Change,” October 2016. 12. https://unfccc.int/sites/default/files/resource/NC3_Republic%20of%20Mauritius_20Jan17.pdf. Some projections of the Northern Aquifer under conditions of low recharge rate, high SLR, and an with an increase in population predict that 50% of the wells in the aquifer will be unusable due to saltwater intrusion by the year 2100.21Kowlesser A. (2018) “Sustainable Aquifer Management in Small Island Developing States” TRITA-ABE-MBT-18111, 87 pp. Department of Sustainable Development, Environmental Science and Engineering, KTH Royal Institute of Technology, Stockholm. http://www.diva-portal.org/smash/get/diva2:1205424/FULLTEXT01.pdf. Furthermore, United Nations (UN) estimates suggest that Mauritius will become a water-stressed country by 2025,22United Nations. “Small Island Developing States In Numbers: Biodiversity & Oceans.” Office of the High Representative for the Least Developed Countries, Landlocked Developing Countries and Small Island Developing States, 2017. https://www.un.org/ohrlls/sites/www.un.org.ohrlls/files/sids_biodiversity_and_oceans_2017.pdf. which is defined as withdrawing 25 percent or more of the country’s renewable freshwater resources. Total rainfall has declined by nearly eight percent between the 1950s and 2010s,23Republic of Mauritius. BUR1 to the UNFCCC (2021). and the decline is projected to reach 13 percent by 2050,24Ibid. punctuated by episodes of prolonged drought.25UNEP. “Mauritius Sets Goals to Curb the Triple Planetary Crisis,” (2023).
In 2020 the country established a detailed monitoring system of the Northern Aquifer to better understand the risks of contamination and saltwater intrusion.26UNDP Nature. “The Life Aquatic: Small Islands in the Atlantic & Indian Oceans Working Together to Fight Tough Water Challenges,” 2024. https://undp-nature.exposure.co/the-life-aquatic. Saltwater intrusion has already been observed on farms in the southeastern and southern coastal belts where farmers have had to adopt with saline-tolerant crops such as eggplant, tomatoes, and chili, and have had to plant in raised beds to increase drainage efficiency.27Ragoonaden, Sachooda, Jogeeswar Seewoobaduth, and Iven Cheenacunnan. “Recent Acceleration of Sea Level Rise in Mauritius and Rodrigues.” Western Indian Ocean Journal of Marine Science, Special Issue 1 (2017): 51–65. https://unfccc.int/sites/default/files/resource/Recent%20acceleration%20of%20sea%20level%20rise%20in%20Mauritius%20and%20Rodrigues.pdf. Some stakeholders noted that there is a longer history of planting these types of crops in the southeastern and southern coastal belts due to their sandy soils.
The accelerated rate and duration of saltwater inundation is exceeding the tolerance levels of mangrove roots. This increase in salinity can both lead to shifts in species composition but also mangrove mortality which will cause a reduction in important ecosystem benefits to coastal communities.28Ward, Raymond D., Daniel A. Friess, Richard H. Day, and Richard A. Mackenzie. “Impacts of Climate Change on Mangrove Ecosystems: A Region by Region Overview.” Ecosystem Health and Sustainability 2, no. 4 (April 2016): e01211. https://doi.org/10.1002/ehs2.1211. Mangroves provide crucial environmental services such as serving as nursery grounds for fish, a filter for sediment, and protection against flooding.29Tibor Vegh, Kenichi Shono. “Sustainable Mangrove Management Offers Tangible Benefits to SIDS.” IISD SDG Knowledge Hub, July 26, 2021. http://sdg.iisd.org/commentary/guest-articles/sustainable-mangrove-management-offers-tangible-benefits-to-sids/. Additionally, they help stabilize coastlines, thus fighting coastal erosion and mitigating the effects of SLR. Between the years of 1987 and 1994, Mauritius lost 30% of its mangrove coverage, mostly due to illegal logging for construction and firewood as well as to clear passage for boats.30Ministry of Environment, National Development Unit, UNEP, and GEF. “Convention on Biological Diversity: Third National Report for the Republic of Mauritius,” October 2006. https://www.cbd.int/doc/world/mu/mu-nr-03-en.doc. As of 2020 only 2% of the island’s native forests remain,31UN CADRI Partnership, “Disaster Risk Management: A Capacity Diagnosis – The Republic of Mauritius.” 24. reflected in Level of Mangrove Coverage (high risk, score of 8.3).
Although the Fisheries Marine Resources Act of 1998 prohibited the removal of mangroves, deforestation continued until 2008 when the government implemented a coastal zone management policy and enforced these laws.32Sunkur, Reshma, Komali Kantamaneni, Chandradeo Bokhoree, and Shirish Ravan. “Mangroves’ Role in Supporting Ecosystem-Based Techniques to Reduce Disaster Risk and Adapt to Climate Change: A Review.” Journal of Sea Research 196 (December 2023): 102449. https://doi.org/10.1016/j.seares.2023.102449. There have been several successful initiatives, beginning in 2009, to plant mangrove seedlings at locations such as Le Morne and Ferney, adding over ten hectares of mangrove coverage across the two sites.33Sunkur, Reshma, Komali Kantamaneni, Chandradeo Bokhoree, Upaka Rathnayake, and Michael Fernando. “Mangrove Mapping and Monitoring Using Remote Sensing Techniques towards Climate Change Resilience.” Scientific Reports 14, no. 1 (March 23, 2024): 6949. https://doi.org/10.1038/s41598-024-57563-4. Local stakeholders noted that other mangrove protection and restoration efforts began in 1995.34Interview with representative of Ministry of Blue Economy, Marine Resources, Fisheries and Shipping. More than 400,000 seedlings have been planted along the entire coastline, covering an area of more than 25 hectares. These efforts have increased the total area of mangrove coverage to 243 hectares.35Ibid. Despite the loss of mangroves, respondents also did not rate the health of existing mangroves (medium risk, score of 3.68) as highly, suggesting that restoration and protection efforts may be seen as a success in ensuring the health of current mangrove stands. Nonetheless, mangroves still face threats from coastal erosion, pollution, and extreme weather events.36UNDRR. “Loss of Mangroves | PreventionWeb,” June 7, 2023. https://www.preventionweb.net/understanding-disaster-risk/terminology/hips/en0015.
SLR can also negatively affect the health of coral reefs. Mauritius’ 300 km2 of coral reefs play several important roles for the island, protecting coastal communities against storm surges and waves, serving as nurseries for fisheries, and attracting tourists.37UN CADRI Partnership, “Disaster Risk Management: A Capacity Diagnosis – The Republic of Mauritius.” 92. However, an increase in coastal sedimentation from erosion is smothering reefs, while an increase in ocean turbidity, is blocking out necessary sunlight for photosynthesis, particularly after heavy rainfall and flash flooding.38Reef Resilience Network, “Sea-Level Rise | Reef Resilience.” Accessed May 28, 2024. https://reefresilience.org/stressors/climate-and-ocean-change/sea-level-rise/. These impacts are compounded by rising ocean temperatures and marine heatwaves, which bleach corals, and is reflected in change in sea surface temperature (medium-high risk, score of 5.1). In Mauritius, coral bleaching has increased from 10 percent in 1998 to over 50 percent in 2009 and 75 percent in 2020.39UN CADRI Partnership, “Disaster Risk Management: A Capacity Diagnosis – The Republic of Mauritius.” 75. These bleaching events continue to increase in both intensity and severity,40Obura, David, Gudka, Mishal, Rabi, Fouad Abdou, Gian, Suraj Bacha, Bijoux, Jude, Freed, Sarah, Maharavo, Jean, Mwaura, Jelvas, Porter, Sean, Sola, Erwan, Wickel, Julien, Yahya, Saleh and Ahamada, Said. 2017. Coral Reef Status Report for the Western Indian Ocean (2017), 78. http://hdl.handle.net/20.500.11822/28371. including the 2023-2024 global mass bleaching event, which is currently affecting Mauritius’ reefs.41Dickie, Gloria, Alison Withers, and Gloria Dickie. “Coral Reefs Suffer Fourth Global Bleaching Event, NOAA Says.” Reuters, April 16, 2024, sec. Environment. https://www.reuters.com/business/environment/coral-reefs-suffer-fourth-global-bleaching-event-noaa-says-2024-04-15/. Stakeholders also identified invasive species, particularly the crown-of-thorns starfish, and ocean acidification as threats to Mauritius’ coral reefs. These threats are reflected in levels of coral reef coverage (high risk, score of 9.3).
With fewer coral reefs, natural mitigation from storms is reduced causing erosion from severe waves, particularly damaging wave structures that take place when a cyclone hits the Indian ocean island nation.42Doorga, Jay R.S., Murughen Sadien, Nikhil A. Bheeroo, Olivier Pasnin, Oomarsing Gooroochurn, Khishma Modoosoodun-Nicolas, Vimal Ramchandur, and Deepsheekha Ramharai. “Assessment and Management of Coastal Erosion: Insights from Two Tropical Sandy Shores in Mauritius Island.” Ocean & Coastal Management 212 (October 2021): 105823. https://doi.org/10.1016/j.ocecoaman.2021.105823. The rate of coastal erosion (medium risk, score of 4.4) has led to the erosion of 13 kilometers of Mauritius’ coastline between 1967 and 2012, representing 17% of the total coastline.43Republic of Mauritius. BUR1 to the UNFCCC (2021). One of the major causes of coastal erosion is the buildup of hard structures on the coast.44Interview with representative of Ministry of Blue Economy, Marine Resources, Fisheries and Shipping. With 90 percent of hotels in Mauritius located on a beachfront,45Ramjeawon, T., and R. Beedassy. “Evaluation of the EIA System on the Island of Mauritius and Development of an Environmental Monitoring Plan Framework.” Environmental Impact Assessment Review 24, no. 5 (July 2004): 537–49. https://doi.org/10.1016/j.eiar.2004.01.001. corals provide essential economic benefits for the community by drawing visitors from around the world.
Coral reefs and mangroves also provide essential habitat for the fish that play a critical role for food and economic security in Mauritians.46Richardson, Calow, Mayhew et al. Climate Risk Report for the Southern Africa Region (2023). Over 2,000 registered artisanal fishers provide animal-source protein to about 4,000 households.47Appadoo, Chandani, Riad Sultan, Monique Simier, Verena Tandrayen-Ragoobur, and Manuela Capello. “Artisanal Fishers in Small Island Developing States and Their Perception of Environmental Change: The Case Study of Mauritius.” Reviews in Fish Biology and Fisheries 33, no. 3 (September 2023): 611–28. https://doi.org/10.1007/s11160-022-09735-6. About 4 percent of the fishers operate exclusively in the nearshore waters, with nearly 40 percent operating primarily offshore, and the majority fish in both areas.48Ibid. Respondents highlighted shortcomings in the management of the country’s fisheries, reflected in sustainably managed fisheries (medium-high risk, score of 6.7). Since the introduction of fish aggregating devices (FADs) in the 1980s,49Beverly, Steve, Don Griffiths, Robert Lee, and Fisheries Group. Anchored Fish Aggregating Devices for Artisanal Fisheries in Southeast Asia: Benefits and Risks. 1st ed. RAP Publication 1020-6221|1014-2789|18194591|0428-9560-RAP. FAO, 2011. http://www.fao.org/3/a-i3087e.pdf. fish catch in nearshore lagoon waters increased substantially, leading the Food and Agriculture Organization to warn the lagoon is “overexploited”,50FAO 2024. Fishery and Aquaculture Country Profiles. Mauritius, 2018. Country Profile Fact Sheets. In: Fisheries and Aquaculture. Rome. Updated Mar 8, 2021, accessed Tuesday, May 28, 2024. https://www.fao.org/fishery/en/facp/mus?lang=en. which is reflected in nearshore fish stock status (medium-high risk, score of 7.2). Artisanal fishers have shifted more towards deeper waters, in part encouraged by policy to shift them towards the Advanced Coastal Fishery, which is outside the lagoon but within 15 nautical miles of the Mauritian coastline.51Interview with representative of Ministry of Blue Economy, Marine Resources, Fisheries and Shipping. Stakeholders scored the offshore fish stock status (medium risk, score of 4.9) as notably lower risk. In 2020, the total marine capture has declined by 11 percent,52SeafoodSource. “Mauritius Charts Growth Path for Fisheries and Aquaculture Sectors,” (2024). due in part to cooperation with a tuna catch limit imposed by the Indian Ocean Tuna Commission. Local stakeholders identified invasive species, such as lionfish, as an important threat to both nearshore and offshore fish stock health.
Tropical cyclone season occurs annually from late October through May.53“Tropical Cyclone Belal.” NASA Earth Observatory, January 14, 2024. https://earthobservatory.nasa.gov/images/152328/tropical-cyclone-belal. Mauritius receives strong winds, heavy rainfall, and storm surge from cyclones passing near the island almost every year, but direct hits on the island are less frequent.54GFDRR “Disaster Risk Profile: Mauritius,” (2017). This is reflected in number of tropical cyclones (medium-high risk, score of 5.8). Yet, tropical cyclones account for approximately 80% of the island’s annual direct losses from extreme weather events in an average year, amounting to approximately $91 million in direct losses.55Ibid. In 2018, flooding, and high winds resulting from Tropical Cyclone Berguitta passing just south of Mauritius left 6,800 homes without power,56lexpress.mu. “Post-Berguitta: moins de 400 foyers privés d’électricité, 4 routes impraticables,” January 19, 2018. https://lexpress.mu/node/325002. destroyed approximately 80 percent of crops on the island,57Jilani, Ahmad Fakuddeen. “Pénurie Des Légumes : Des Importations s’avèrent Nécessaires.” Star (blog), January 23, 2018. https://starpress.info/penurie-legumes-importations-saverent-necessaires-3549/. and left two people dead. In January 2024, Tropical Cyclone Belal passed south and west of Mauritius and brought sustained winds of 105 miles per hour, torrential rain, and storm surge, leading to one casualty and 8,400 people without power in the capital of Port Louis.58Yasine Mohabuth, Oliver Slow. “Cyclone Belal: Mauritius Assesses Damage after Flash Flooding,” January 16, 2024. https://www.bbc.com/news/world-africa-67990946. Some models project a 20 percent decrease in the frequency of cyclones,59Cattiaux, Julien, Fabrice Chauvin, Olivier Bousquet, Sylvie Malardel, and Chia-Lun Tsai. “Projected Changes in the Southern Indian Ocean Cyclone Activity Assessed from High-Resolution Experiments and CMIP5 Models.” Journal of Climate 33, no. 12 (June 15, 2020): 4975–91. https://doi.org/10.1175/JCLI-D-19-0591.1. but these storms are projected to be 6.5 percent more intense with a 34 percent increase in rainfall rate and 5 percent increase in wave height.60Thompson, Callum, Christelle Barthe, Soline Bielli, Pierre Tulet, and Joris Pianezze. 2021. “Projected Characteristic Changes of a Typical Tropical Cyclone under Climate Change in the South West Indian Ocean” Atmosphere 12, no. 2: 232. https://doi.org/10.3390/atmos12020232.
In addition to tropical cyclones, Mauritius has experienced major damage from flash flooding caused by intense rainfall,61GFDRR “Disaster Risk Profile: Mauritius,” (2017). reflected in number of flood events (high risk, score of 7.7) Flash flooding accounted for 33% of nationally reported losses in terms of mortality due to natural hazards between 1990 and 2014.62UN CADRI Partnership, “Disaster Risk Management: A Capacity Diagnosis – The Republic of Mauritius.” 21. In 2013, eleven people died in the capital of Port Louis after the island received 152 mm of rain in less than an hour,63BBC News. “Deadly Floods Hit Mauritius Capital Port Louis.” March 31, 2013, sec. Africa. https://www.bbc.com/news/world-africa-21989070. the equivalent of 69 percent of the monthly average rainfall. The storm left hundreds homeless, rendered roads unpassable, and flooded the area with sewage, which polluted drinking water.64“Flash Floods in Mauritius – FloodList.” Accessed May 22, 2024. https://floodlist.com/africa/flash-floods-mauritius. This type of flash flooding, from both heavy rainfall and storms like Cyclone Belal in 2024, has affected more areas of Mauritius, with a 225 percent increase in the number of areas identified as flood prone between 2002 and 2019,65UN CADRI Partnership, “Disaster Risk Management: A Capacity Diagnosis – The Republic of Mauritius.” 21. which is reflected in percent of study area at risk of flooding (medium risk, score of 4.7). The widening vulnerability to flooding is largely attributable to rapid urbanization and decreased vegetation cover in areas previously used for sugarcane cultivation. The lack of proper residential planning and the growth of informal housing compacts soil and disrupts natural drainage systems.66Ibid., 20.
Flood events can cause sewage systems to overflow, especially for the 79 percent of the population who rely on private septic tanks.67Ibid., 23. Effluent overflow can increase the risk of vector-borne disease infections (medium risk, score of 3.9). The country has experienced recurrent outbreaks of dengue fever in 2016, 2019, 2020, 2023 and 2024.68WHO | Regional Office for Africa. “WHO Supports Mauritius as It Grapples with First Dengue Outbreak,” March 21, 2024. https://www.afro.who.int/countries/mauritius/news/who-supports-mauritius-it-grapples-first-dengue-outbreak. Flooding and rain can create a breeding ground for mosquitos, which accumulate in standing waters and transmit Dengue fever to humans.69Jacqueline Houtman, Lindsey Shultz, Rebecca Glassman, Jonathan Gilmour, Jessica Malaty Rivera, Sam Scarpino. “The Increasing Burden of Dengue Fever in a Changing Climate.” The Rockefeller Foundation (blog), November 10, 2022. https://www.rockefellerfoundation.org/insights/perspective/the-increasing-burden-of-dengue-fever-in-a-changing-climate/. Mauritius has also experienced a recent increase in leptospirosis in the first half of 2024.70“Minister Jagutpal Calls on Citizens to Keep the Environment Clean and Avoid Proliferation of Mosquitoes.” Accessed May 28, 2024. https://www.govmu.org/EN/newsgov/SitePages/Minister-Jagutpal-calls-on-citizens-to-keep-the-environment-clean-and-avoid-proliferation-of-mosquitoes.aspx.
The impacts by humans on coral reefs and other fragile marine ecosystems have also occurred off the coasts of the island. In 2020, a Japanese bulk carrier ran aground on a coral reef off the southern coast of Mauritius, spilling almost 1,000 tons of oil,71Bruneau Laurette, Rama Valayden, Melita Steele, Hisayo Takada. “Remembering Mauritius’s Worst Environmental Disaster.” Al Jazeera, August 4, 2021. https://www.aljazeera.com/opinions/2021/8/4/remembering-the-mauritius-worst-environmental-disaster. and leading to what scientists have called the country’s worst ecological disaster.72Mohammed, Omar. “Japanese Ship Involved in Mauritius Oil Spill Breaks Apart.” Reuters, August 15, 2020, sec. Environment. https://www.reuters.com/article/idUSKCN25B09J/. In the weeks following the event over 50 whale and dolphin carcasses washed ashore,73Al Jazeera. “Remembering Mauritius’s Worst Environmental Disaster,” (2021). although no formal link has been established between the two events. Fishing revenue also declined by 72 percent,74Appadoo, Sultan, Simier et al. Artisanal fishers in SIDS (2023). in part due to fishery closures in the aftermath of the spill. Seagrasses, mangroves, and corals cover around 50 percent of the lagoon in which the spill occurred, making it a very ecologically sensitive area.75Reuters. “Counting the Environmental Cost of the Mauritius Oil Spill,” August 13, 2020. https://www.yahoo.com/news/counting-environmental-cost-mauritius-oil-161858633.html?
Economic Risk
Tourism is a key driver of Mauritius’ economic growth, with the country attracting more tourists annually – 1.4 million – than the total number of residents – 1.3 million. The sector is primarily based around coastal and marine tourism, leaving it vulnerable to the climate hazards described above, including SLR, tropical cyclones, loss of ecosystems, and flooding. All risk indicators are scored on a 1 (lowest vulnerability) to 10 (highest vulnerability) scale relative to other countries in East Africa.
- The ECONOMICS category highlights the vulnerability of Mauritius’ economy to extreme weather events, reflected in a medium-high risk score for Market Losses from Extreme Weather Events (6.0). There are risks around the unequal benefits of Mauritius’ economy and Mauritius’ dependence on imported food through a single port. This is reflected in medium risk scores for Income Inequality (4.8) and Percent of Population Experiencing Moderate or Severe Food Insecurity (4.0), respectively.
- The INFRASTRUCTURE category underscores the damage that climate hazards can do to the ground transportation and the residential sector, reflected in the medium-high risk score for Level of Resilience for Roads (5.8) and the medium risk score for Level of Housing Damage from Extreme Weather Events (4.6). The medium-high risk score for Effectiveness of Solid Waste Management Procedures (5.4) highlights the risks posed by unsustainably rising levels of solid waste to human and ecosystem health, potentially increasing the damage from extreme weather events in the future.
- In the MAJOR INDUSTRIES category, the high risk score for Percent of National Economy Based in Tourism Industry (7.6) emphasizes the centrality and vulnerability of Mauritius’ tourism sector. Medium-high risk scores for Percent of National Economy Based in Port and Shipping Industries (6.0) and Percent of National Economy Based in Offshore Fisheries (5.8) reflect the importance of these two sectors to the Mauritian economy. It further highlights how risks from climate impacts beyond Mauritius’ borders can affect the country, including through shifting trade routes and fish stocks.
In 2018 and 2019, around 1.4 million tourists visited Mauritius, and the government projects that this number will rise to over 2 million by 2030,76UN CADRI Partnership, “Disaster Risk Management: A Capacity Diagnosis – The Republic of Mauritius.” representing over 150 percent of Mauritius’ population of approximately 1.3 million. The sector is “one of the principal drivers of growth” in Mauritius,77Ibid. and accounts for between 8.5 percent78Ibid. and 19.5 percent of the economy,79Richardson, Calow, Mayhew et al. Climate Risk Report for the Southern Africa Region (2023). reflected in the Percent of National Economy Based in Tourism (high risk, score of 7.6). The centrality of the tourist sector was highlighted in 2020 when travel restrictions associated with COVID-19 caused tourist arrivals to fall to 316,000, resulting in Mauritius’ economy shrinking by 14.5 percent, one of the sharpest contractions in the world.80International Monetary Fund. “Real GDP Growth: Mauritius,” 2024. https://www.imf.org/external/datamapper/NGDP_RPCH@WEO/MUS?zoom=MUS&highlight=MUS.
Tourism in Mauritius is principally centered around coastal and marine tourism, with 90 percent of hotels in the country located on the beach.81UN CADRI Partnership, “Disaster Risk Management: A Capacity Diagnosis – The Republic of Mauritius.” This sun-sand-sea model of tourism is highly vulnerable to the climate risks described in the previous section. SLR, coastal erosion, and flooding can damage and undermine critical tourism infrastructure, including beachside hotels, and restaurants. Beaches in Mauritius have already lost over 10 meters in width over the past decade.82Ibid. The deterioration of key ecosystems such as mangroves and coral reefs can increase the damage caused by storm surge and the rate of coastal erosion, as well as cause a decline in the marine biodiversity that is a key tourist attraction.
In addition, the current tourism model in Mauritius is characterized by low engagement by tourists outside of their hotels. Average expenditure per tourist “outside of accommodation remains low and is growing very slowly.”83Sustainable Island Mauritius. “Making Mauritius a Leading and Sustainable Island Destination.” https://www.cscp.org/wp-content/uploads/2018/10/01_newsitem_01_brochure_.pdf. This represents a lost opportunity to gain value from the tourists that visit Mauritius and makes the country dependent on a high quantity of tourist arrivals, putting pressure on coastal and marine ecosystems, waste management systems, and freshwater resources. It also concentrates the economic gains from tourism among a smaller share of the population, contributing to Income Inequality (medium risk, score of 4.8) and public dissatisfaction, as demonstrated in the Stop Stealing Our Beaches campaign in 2019.84Bertelsmann Stiftung, BTI 2024 Country Report — Mauritius. Gütersloh: Bertelsmann Stiftung, 2024. https://bti-project.org/en/reports/country-report/MUS
The Port Louis Harbor and shipping industries also play an important role in the Mauritian economy, reflected in the Percent of National Economy Based in Port and Shipping Industries (medium-high risk, score of 6.0). In addition to handling 99 percent of Mauritius’ external trade, the Harbor is one of the deepest ports in the southwest Indian Ocean and a major transshipment hub for the region. The Harbor handles approximately 8 million tons of cargo annually and has undergone significant renovations in recent years to accommodate increased levels of traffic.85United States International Trade Administration. “Mauritius – Port Expansion and Bunkering,” April 10, 2023. https://www.trade.gov/country-commercial-guides/mauritius-port-expansion-and-bunkering. The Harbor and Mauritius’ role as a transshipment hub faces two principal risks from climate change. The first is disruptions to operations from extreme weather events – Harbor operations were stopped for a total of 24 days in 2018 due to cyclones and rough weather, causing $68 million in losses.86Ibid. In addition to direct losses, a prolonged closure of the Harbor could disrupt Mauritius’ food imports, which provide 95 percent of all staple food cereals – e.g., rice and wheat – consumed in the country.87Richardson, Calow, Mayhew et al. Climate Risk Report for the Southern Africa Region (2023). Storms and rough weather can also increase the risk of ships running aground and of oil spills.88Vel Moonien. “Three Taiwanese Fishing Trawlers Run Aground in Mauritius.” gCaptain, February 23, 2022. https://gcaptain.com/three-taiwanese-fishing-trawlers-run-aground-in-mauritius/. Such a disruption could drastically increase the Percent of Population Experiencing Moderate or Severe Food Insecurity (medium risk, score of 4.0). The African Development Bank funded a technical study and design for a breakwater at the Harbor, which was completed in January 2019.89“Design of Island Terminal and Breakwater Structure | Mauritius Ports Authority.” Accessed May 28, 2024. http://www.mauport.com/design-island-terminal-and-breakwater-structure. Some fear that as waters warm and sea ice melts in the Arctic new shipping routes between Europe and Asia could displace shipping through the Indian Ocean and reduce transshipment traffic through Mauritius.90Richardson, Calow, Mayhew et al. Climate Risk Report for the Southern Africa Region (2023).
With one of the largest Exclusive Economic Zones (EEZs) in the world covering nearly 2.3 million km2, Mauritius’ fisheries are an important economic resource. Mauritius has an export processing zone that integrates storage, processing, marketing, and distribution and has made the country a regional hub for commercial fishing in the Western Indian Ocean, reflected in the Percent of the National Economy Based in Offshore Fishing (medium-high risk, score of 5.8). Exports of fish and fish products make up approximately 15-19 percent of the country’s exports, and the government hopes to further expand exports to southern Africa and the United States.91SeafoodSource. “Mauritius Charts Growth Path for Fisheries and Aquaculture Sectors,” (2024). The expansion of the sector faces persistent challenges from illegal, unreported, and unregulated (IUU) fishing, though the country did sign the Port State Measures Agreement, designed to prevent illegally caught fish from entering the market, in 2016.92Long, Tony. “Mauritius Signs International Treaty to Protect Ports From Illegally Caught Fish.” Pew, January 7, 2016. http://pew.org/1ISYN7u. Mauritius is also part of the Indian Ocean Tuna Commission to help manage regional tuna stocks. In addition to commercial fishing, artisanal fishers are shifting towards deeper sea and off lagoon fishing, with nearly 60 percent registered to work only in the off-lagoon region.93Interview with representative of Ministry of Blue Economy, Marine Resources, Fisheries and Shipping. These fishers provide a critical source of protein, especially for households in marginal coastal regions.94Appadoo, Sultan, Simier et al. Artisanal fishers in SIDS (2023). Over 80 percent of artisanal fishers in Mauritius report a lower diversity and quantity of fish over the past 10-15 years, especially in the winter,95Ibid. which has negatively impacted economic and food security in some of the poorest areas of the country. Warming ocean temperatures may damage commercial and artisanal offshore fishing as they drive key species, such as tuna, to higher latitudes. Climate-driven changes to fish stocks may occur suddenly, as occurred in 1998 and 2007 in the Seychelles, when marine heatwaves devastated tuna harvests, causing substantial losses to the country.96Richardson, Calow, Mayhew et al. Climate Risk Report for the Southern Africa Region (2023). Such changes could benefit Mauritius, however, by driving the productive tuna stocks around Seychelles into Mauritius’ national waters.97Moustahfid, H., Marsac, F. and Gangopadhyay, A., (2019). Climate change impacts, vulnerabilities and adaptations: Western Indian Ocean marine fisheries. Chapter 12 in Barange, M., Bahri, T., Beveridge, M.C.M., Cochrane, K.L., Funge-Smith, S. and Poulain, F (eds) Impacts of climate change on fisheries and aquaculture. Synthesis of current knowledge, adaptation and mitigation options, (Rome: FAO).
Just as extreme weather events can damage specific economic sectors, they also inflict damages on the broader economy, reflected in Market Losses from Extreme Weather Events (medium-high risk, score of 6.0). The country experiences an average of $113 million in annual direct losses from tropical cyclones and flooding, though the actual losses in any given year can fluctuate substantially depending on whether Mauritius is directly affected by a tropical cyclone.98GFDRR “Disaster Risk Profile: Mauritius,” (2017). Direct losses from tropical cyclones and flooding are proportionally largest in the northern districts of Pamplemousses and Rivière du Rempart.99Only counting areas within the study area, i.e., the main island of Mauritius. Tropical cyclones account for $91 million in average annual losses, of which wind damage accounts for approximately 80 percent.100GFDRR “Disaster Risk Profile: Mauritius,” (2017). Total losses from tropical cyclones are highest in the districts of Plaines Wilhems and Pamplemousses. Flooding accounts for $22 million in average annual losses, with the districts of Plaines Wilhems, Pamplemousses, and Port Louis experiencing the highest losses.101Ibid. An assessment by the IMF found that total damages from extreme weather events averaged $160-245 million per year between 1960 and 2022 and that climate impacts “threaten the prospects for long-term economic resilience” in Mauritius.102Simione, Felix, Robert Clifton, and Isabel Rial. “Addressing Climate Change in Mauritius: Financing and Reform Options.” IMF Country Report No. 22/224. Mauritius: Selected Issues: International Monetary Fund, July 2022. https://www.elibrary.imf.org/downloadpdf/journals/002/2022/224/article-A002-en.xml.
This rapid assessment highlighted the vulnerability of two important sectors: the housing sector and the road network. Mauritius has over 2000 kilometers of road, and over 60 percent of the population takes a bus at least once per week.103Republic of Mauritius. BUR1 to the UNFCCC (2021). Local experts highlighted the vulnerability of the national road network, reflected in Level of Resilience for Roads (medium-high risk, score of 5.8), and a previous government report found that almost 20 percent of the country’s secondary roads are at risk of flooding,104Ibid. potentially cutting off smaller towns and communities from the rest of the country and workers from their jobs. For example, following a torrential rain warning, the public, and to a lesser extent private, sector employees are instructed to return home due to the risk of flooding of major road networks.105CADRI Partnership, “Disaster Risk Management: A Capacity Diagnosis – The Republic of Mauritius.”
The housing sector accounts for approximately 50 percent of the country’s total annual losses from tropical cyclones and 60 percent of its total annual losses from flooding, reflected in the Level of Housing Damages from Extreme Weather Events (medium risk, score of 4.6). The vulnerability of both the housing sector and road network highlights the importance of building climate resilience across Mauritius. A siloed approach to rebuilding resilience in high valued areas (hotels and resorts) after an extreme weather could leave service employees and other workers unable to reach their jobs.
Challenges around solid waste management could further increase the damages caused by extreme weather events. 650,000 tons of waste were added to the Mare Chicose landfill in 2023, an annual increase of 2.5 percent.106UNDP. “Developing a Comprehensive Strategy for Waste-to-Resource Transformation in Mauritius,” August 3, 2023. https://www.undp.org/mauritius-seychelles/news/developing-comprehensive-strategy-waste-resource-transformation-mauritius. The capacity of the landfill, which has already received over 10 million tons of waste since its establishment in 1997, is being stretched to the limits. With limited available land and a steady rise in waste production, Mauritius is facing a growing challenge, reflected in Effectiveness of Solid Waste Management Procedures (medium-high risk, score of 5.4). Uncollected or unmanaged waste could contaminate floodwaters and clog the drainage facilities established under the Land Drainage Master Plan of 2022,107UNDRR – Regional Office for Africa. “In Mauritius, Land Drainage and Weather Radar Help against Natural Hazards,” November 22, 2022. http://www.undrr.org/news/mauritius-land-drainage-and-weather-radar-help-against-natural-hazards. exacerbating flood damages. The Ministry of Environment, Solid Waste, and Climate Change has set a target of diverting 70 percent of waste away from Mauritius’ landfill by 2030 by increasing rates of compost, reuse, and recycling.108UNDP. “New Steps towards Waste Segregation in Mauritius,” August 28, 2023. https://www.undp.org/mauritius-seychelles/news/new-steps-towards-waste-segregation-mauritius. As part of its efforts towards this goal, the government passed major new legislation in 2023 that provided for a regulatory framework to support the transition towards a circular economy.109The Waste Management and Resource Recovery Act of 2023, Government Gazette of Mauritius No. 32 (2023). https://www.fao.org/faolex/results/details/en/c/LEX-FAOC220114/.
Social Risk
The high population density of Mauritius and limited availability of land is a consistent challenge for the country, constraining its responses to the growth of the tourism industry, challenging solid waste and wastewater management, and ecosystem protection. Mauritius also faces risks around high employment levels in climate vulnerable industries, especially tourism. All risk indicators are scored on a 1 (lowest vulnerability) to 10 (highest vulnerability) scale relative to other countries in East Africa.
- In the GOVERNANCE category, a medium-high risk score for Capacity of Current Disaster Response (5.5) and medium risk score for National Climate Adaptation Plan (5.0) reflect concerns that the government is not sufficiently prepared to respond to the stronger storms that Mauritius will experience as a result of climate change. Medium risk scores for Level of Perceived Transparency (4.8) and Investment in Climate Resiliency Development Projects (3.7) highlight lower-level risks around information availability and access to climate finance.
- The SOCIAL/DEMOGRAPHICS category includes the third-highest risk score in this rapid assessment, National Population Density (9.2), emphasizing Mauritius’ high population density, which is higher than Nigeria and India.
- The STABILITY category highlights high employment in climate vulnerable industries with medium-high risk scores for Percent of People Employed in Tourism (6.9) and Percent of People Employed in the Commercial Fishing Industry (5.9) and a medium risk score for Percent of People Employed in Agriculture (3.6). A medium-high risk score for Level of Social Tension (5.4) reflects tensions around the growing footprint of the tourism industry, as well as inequalities between communal groups and genders.
With a population density of 634 people per square kilometer, Mauritius’ population density is higher than that of Nigeria (234 people per square kilometer), India (473), and the Netherlands (521).110The World Bank, FAO. “Population density (people per sq. km of land area) – Mauritius, Nigeria, India, Netherlands.” https://data.worldbank.org/indicator/EN.POP.DNST?locations=MU-NG-IN-NL. Some of the densest parts of Mauritius, such as the town of Beau Bassin-Rose Hill, have a higher population density than Tokyo.111Statistics Mauritius, Ministry of Finance and Economic Development. “Digest of Demographic Statistics – 2018.” Republic of Mauritius, October 2019. https://statsmauritius.govmu.org/Documents/Statistics/Digests/Population/Digest_Demo_Yr18.pdf. The country’s high population density is a result of the limited available land given the mountainous nature of much of the island’s interior, which means that both the coast and the interior plateau are densely populated. This limited available land imposes difficult tradeoffs in land use and climate adaptation strategies, reflected in National Population Density (high risk, score of 9.2). One such challenge is dealing with solid waste, as described in the previous section, since there is limited scope for expanding the Mare Chicose landfill, which is nearing capacity, or building another landfill.
High population density also limits the land available for water retention measures that can reduce the damages from flooding and replenish Mauritius’ aquifers, alleviating pressure on the island’s freshwater resources. The Land Drainage Master Plan, completed in May 2022, should help the government use the land that is available more effectively to achieve the two goals of flood damage reduction and aquifer replenishment.112UNDRR, “In Mauritius, Land Drainage and Weather Radar Help against Natural Hazards,” (2022). Increasing population density in previously coastal rural areas, especially around the northern coast,113Kaudeer, Bibi Najiah, and Santaram Venkannah. “REVISITING THE URBAN DEFINITION FOR THE ISLAND OF MAURITIUS,” 11–20, 2020. https://doi.org/10.2495/SC200021. may also increase the population exposed to the impacts of SLR, coastal storm surge, and erosion and put pressure on important coastal ecosystems, such as mangroves.
Although Mauritius has a strong reputation for “investment in cyclone preparedness and its community-based disaster response teams” according to a 2020 assessment from the United Nations (UN) Capacity for Disaster Reduction Initiative (CADRI),114CADRI Partnership, “Disaster Risk Management: A Capacity Diagnosis – The Republic of Mauritius.” recent events have revealed weaknesses in its Capacity of Current Disaster Response (medium-high risk, score of 5.5). Torrential rains from Cyclone Belal combined with storm surge caused severe flash flooding in Port Louis and left around 8,400 people without power in 2024.115BBC, “Cyclone Belal,” (2024). The waters rushing through the streets of the capital submerged cars, around 100 of which were damaged and abandoned by their owners, and caused “widespread destruction” along the city’s waterfront.116Ibid. Stakeholders highlighted potential concerns around a lack of clarity and transparency around decision-making and potential confusion around conflicting response guidelines for different sectors (e.g., between public and private sector employees).
The UN CADRI assessment, although broadly positive, also identified several key shortcomings in Mauritius’ disaster response.117CADRI Partnership, “Disaster Risk Management: A Capacity Diagnosis – The Republic of Mauritius.” First, risk information is not centralized and is often in inaccessible formats. The result is that decisionmakers and policymakers often have limited understanding of what data is available and, when they are aware of relevant data, may not be able to understand it. Second, the assessment of disaster risk does not integrate multiple hazards, especially those beyond tropical cyclones and flooding. While these two hazards cause the most damages in Mauritius, other hazards can cause cascading and compounding impacts. Heavy rainfall can trigger landslides; droughts can cause soil to become less absorbent increasing flood damages; and flooding can cause outbreaks of disease, such as dengue fever. Third, local councils have been assigned disaster risk responsibilities but have not been allocated sufficient resources to fulfill them. This challenge may be particularly acute in urban areas, such as those along the northern coast.
The siloed approach that characterizes Mauritius’ disaster risk assessment extends to the country’s climate adaptation planning, reflected in National Climate Adaptation Plan (medium risk, score of 5.0). Although the country established a National Climate Change Adaptation Policy Framework in 2012,118Republic of Mauritius. “National Climate Change Adaptation Policy Framework for The Republic of Mauritius,” December 2012. https://www.greenpolicyplatform.org/sites/default/files/downloads/policy-database/MAURITIUS)%20National%20Climate%20Change%20Adaptation%20Policy%20Framework%20for%20the%20Republic%20of%20Mauritius.pdf. as of 2024 it has not submitted a National Adaptation Plan to the UN Framework Convention on Climate Change (UNFCCC).119United Nations Climate Change. “Submitted NAPs from Developing Country Parties | NAP Central.” Accessed May 28, 2024. https://napcentral.org/submitted-naps. The lack of an updated plan means that Mauritius’ climate adaptation planning is guided by its commitments in its Nationally Determined Contributions (NDC) under the Paris Agreement which are designed to reduce greenhouse gas emissions. The result is that the government’s climate policy is more ambitious around reducing greenhouse gas emissions and deploying renewable energy than focusing on building climate adaptation.120Independent Evaluation Unit (2023). Second Performance Review of the Green Climate Fund: Mauritius country case study report (January). Songdo, South Korea: Independent Evaluation Unit, Green Climate Fund. https://ieu.greenclimate.fund/sites/default/files/evaluation/03-mauritius-country-case-study-report-top-web.pdf Second, without a National Adaptation Plan there has been little coordination between international climate finance funders,121Ibid. which may limit the effectiveness and efficiency of available funds. Mauritius is currently developing a national adaptation plan with support from the GCF.
Tourism accounts for up to 22 percent of employment in the country,122UNDP. “Re-Imagining the Future of Work Towards Building Back Better and Leaving No One Behind.” and its indirect employment impacts are even greater, as reflected in Percent of Population Employed in Tourism (medium-high risk, score of 6.9) affecting the country’s stability. During the COVID-19 pandemic, even after the first lockdown was lifted in June 2020, approximately one of every three households “continued to endure an income deficit due to job losses and reduced working hours.”123Ibid. The Government Wage Assistance Scheme was critical to avoid a large economic and social crisis during the pandemic.124Ibid. Since Mauritius’ tourism sector is overwhelmingly coastal, with 90 percent of hotels located on the coast,125CADRI Partnership, “Disaster Risk Management: A Capacity Diagnosis – The Republic of Mauritius.” climate impacts such as SLR, coastal erosion, tropical cyclones, and flash flooding could cause similar types of disruptions to the sector and to Mauritius’ labor force. These impacts, as well as others such as marine heatwaves, may disrupt other industries, such as the commercial fishing industry, reflected in the Percent of the Population Employed in the Commercial Fishing Industry (medium-high risk, score of 5.9). The government already provides a bad weather allowance for fishers, which it increased at least three times between 2019 and 2023, more than doubling the daily rate.126SeafoodSource. “Mauritius Charts Growth Path for Fisheries and Aquaculture Sectors,” (2024).
The tourism sector in Mauritius also faces other economic security challenges, including a limited pool of skilled workers and a lack of community participation in tourism development.127Sustainable Island Mauritius. “Making Mauritius a Leading and Sustainable Island Destination”. Public dissatisfaction with the growth of the tourism industry and its impacts on coastal communities led to the Stop Stealing Our Beaches campaign, which has fought against the privatization of beaches and destruction of ecosystems since 2015.128Plessis, Carien du. “Beach Grabs: Protests in the Mauritian Paradise.” Daily Maverick, December 13, 2016. https://www.dailymaverick.co.za/article/2016-12-13-beach-grabs-protests-in-the-mauritian-paradise/. By the end of 2016, just 10 percent of the Mauritian coastline remained classified as public beaches.129Ibid. This perception that the government is prioritizing the interests of foreign investors over local communities could contribute to increased Levels of Social Tension (medium-high risk, score of 5.4). Another potential area of social unrest is the perceptions of “tacit discrimination faced by sections of the Creole community”.130BTI Mauritius Country Report (2024). The government will need to ensure that its strategies for building climate resilience and responding to disasters are inclusive and take into account these potential risks.
Priority Recommendations to Build Resilience
Over the past decade, Mauritius has taken important steps to strengthen its disaster risk management and climate adaptation capabilities. In October 2013, after deadly flash flooding struck Port Louis, it established the National Disaster Risk Reduction and Management Center (NDRRMC) to plan, organize, coordinate, and monitor disaster risk reduction and management efforts. The NDRRMC also has an advisory role for large development projects and some land use planning decisions.131CADRI Partnership, “Disaster Risk Management: A Capacity Diagnosis – The Republic of Mauritius.” To support the NDRRMC and the incorporation of disaster risk into the work of other agencies, the government produces “a wealth of disaster risk data”, especially around tropical cyclone and flooding risk.132Ibid. The Mauritius Meteorological Services is responsible for providing climate data, and in 2019, the government invested in improving the zoning and accuracy of flooding and coastal inundation risk data.133Ibid.
In 2020, Mauritius passed the Climate Change Act, which lays out the legal framework for reducing greenhouse gas emissions and strengthening climate resilience in the country.134Republic of Mauritius. The Climate Change Act 2020, Pub. L. No. 11 of 2020 (2020). https://faolex.fao.org/docs/pdf/mat204415.pdf. The Act establishes an Interministerial Council on Climate Change, headed by the Prime Minister, and the Department of Climate Change within the Ministry of Ministry of Environment, Solid Waste Management, and Climate Change. The following year, the government submitted its Nationally Determined Contributions (NDC) to the UNFCCC, which established ambitious targets to reduce greenhouse gas emissions and increase renewable energy production. The NDC also included a description of Mauritius’ adaptation priorities, including measures to enhance resilience in seven sectors: Infrastructure & Disaster Risk Reduction, Water, Agriculture, Tourism and Coastal Zone Management, Climate Smart Fisheries and Blue Economy, Marine and Terrestrial Biodiversity, and the Health Sector.135The Republic of Mauritius. “Update of the Nationally Determined Contributions of The Republic of Mauritius .” UNFCCC, October 1, 2021. https://unfccc.int/documents/497765. In 2024, the government of Mauritius is considering passing a new Environment Bill to replace the Environment Protection Act.136Ramano, K. The Environmental Bill, Pub. L. No. 1 of 2024 (2024). https://mauritiusassembly.govmu.org/mauritiusassembly/wp-content/uploads/2024/03/bill0124.pdf. The bill aims to update and strengthen the country’s environmental management framework. It will:
- Establish an Environmental Observatory;
- Improve management of environmentally sensitive areas;
- Strengthen environmental impact assessment mechanisms;
- Establish a National Oil Spill Coordination Committee;
- Introduce a framework for plastic management.
Develop and Implement a Sustainable and Inclusive Coastal Zone Management Plan
The coastal zone of Mauritius is critical to the economic, cultural, and social health of the country. It is home to 90 percent of the country’s hotels, its beaches and coral reefs, Port Louis Harbor, fishing infrastructure, and numerous coastal communities with deep cultural ties to their land. Yet this area faces numerous compounding threats. Tropical cyclones and flash flooding are damaging lives, livelihoods, and infrastructure, while sea level rise (SLR) and coastal erosion wipe away beachfront and undermine the structural integrity of Mauritius’ waterfront. Finally, saltwater intrusion threatens the country’s already limited freshwater supplies. A sustainable and inclusive coastal zone management plan that brings together government, the private sector, and coastal residents will help manage these risks in a cohesive way, promote economic growth, and protect Mauritius’ fragile and unique biodiversity. Both grey (built) and green (natural) infrastructure should be considered together and aligned as the country seeks to develop land use and coastal zone management plans designed to safeguard its blue economy and the citizens who reside in coastal communities. These plans should look to the future and account for climate change projections, the longevity and the costs of the projects.
Mauritius did develop a national coastal adaptation strategy as part of a UN Development Programme (UNDP) project supported by the Adaptation Fund from 2012 to 2019,137Adaptation Fund. “Climate Change Adaptation Programme in the Coastal Zone of Mauritius.” Accessed May 28, 2024. https://www.adaptation-fund.org/project/climate-change-adaptation-programme-in-the-coastal-zone-of-mauritius/. and included a commitment in its 2021 NDC to implement “Integrated Coastal Zone Management as part of the Draft Master Plan on Environment”.138Mauritius Nationally Determined Commitment – 2021 Update. However, there are limited available details on the specific measures and implementation of either plan, though the UNDP project did plant 20,000 mangroves in eastern Mauritius in the region of Grand Sable. These mangroves will help stabilize the coastline, reduce damage from high winds, reduce storm surge, as well as sequester large amounts of carbon dioxide.
Mangrove Restoration
The CORVI research suggests additional restoration efforts, particularly in areas where mangroves have historically been located, would help safeguard communities and add value to the next coastal zone management plan. To ensure the success of newly planted mangroves, restoration efforts will require regular monitoring through tools like the Mangrove Restoration Tracker Tool.139“Global Mangrove Alliance launches the Mangrove Restoration Tracker Tool (MRTT)”. Wetlands International. July 25, 2023. https://www.wetlands.org/global-mangrove-alliance-launches-the-mangrove-restoration-tracker-tool-mrtt/. Protecting existing mangroves is generally less expensive than restoring degraded or destroyed forests, and therefore should be prioritized through the use of regulation, financial incentives, and community engagement, which have proven successful in the past.140Chacowry, A. (2023). Meeting the challenges to climate change adaptation: an NGO community-based successful projects in Mauritius. GeoJournal, 88(4), 4081–4094. https://doi.org/10.1007/s10708-023-10850-5 The rapid and accelerating rate of SLR in Mauritius may, however, threaten the survival of the country’s mangroves. Research suggests that when SLR exceeds seven millimeters per year, mangrove ecosystems “fail to keep up with the change”.141Saintilan, N., N. S. Khan, E. Ashe, J. J. Kelleway, K. Rogers, C. D. Woodroffe, and B. P. Horton. “Thresholds of Mangrove Survival under Rapid Sea Level Rise.” Science 368, no. 6495 (June 5, 2020): 1118–21. https://doi.org/10.1126/science.aba2656. To help preserve its mangroves, the government of Mauritius should work to assist the inland migration of mangroves and incorporate projected requirements for mangrove migration into coastal land use planning. Mauritius can catalyze on previous community-based coastal adaptation projects to replicate in other parts of the island. Two such cases are Le Morne mangrove restoration and the coastline rehabilitation in Poudre d’Or, in which a process-based approach involving participatory learning and ‘learning by doing’ resulted in increased local subsistence and financial benefits from the mangrove restoration as well as increased awareness.142Chacowry, A. (2023). Meeting the challenges to climate change adaptation: an NGO community-based successful projects in Mauritius. GeoJournal, 88(4), 4081–4094. https://doi.org/10.1007/s10708-023-10850-5
Integrate Gray/Green Infrastructure
In some areas, elevated levels of maritime traffic, high population density, and/or a lack of historical mangroves suggest that mangrove restoration is not a feasible solution for coastal protection. In those areas, like Port Louis Harbor, gray infrastructure or hybrid approaches may be necessary. Even in such cases, however, coastal planners must be mindful of the negative impacts of hardened infrastructure, including increased erosion outside of the directly protected areas, disruption of marine habitats, reduction of coastal accretion, and reduced attractiveness of the coastal zone.143Climate ADAPT. “Adaptation Option: Seawalls and Jetties,” 2023. https://climate-adapt.eea.europa.eu/en/metadata/adaptation-options/seawalls-and-jetties. In addition, seawalls and breakwaters can have high upfront costs, and may have limited usefulness if climate impacts exceed design specifications. Robust and inclusive engagement with coastal communities and the private sector will be critical to the success of all coastal protection efforts. In addition, previous projects have showcased successful public-private partnerships. In St-Felix, for the managed retreat of a coastal road reduced exposure to flooding and created a new public beach area, though it underscored the need for better coordination mechanisms to leverage private sector expertise in coastal risk management.144Anisimov, A., Magnan, A. K., & Duvat, V. K. E. (2020). Learning from risk reduction pilot projects for enhancing long-term adaptation governance: the case of Mauritius Island (Indian ocean). Environmental Science and Policy, 108, 93–103. In some areas, however, relocation planning may need to begin in certain coastal communities, such as around the northwestern coast. Given Mauritius’ high population density and limited available land, it will be challenging to identify appropriate space without further ecosystem degradation and loss of lives and livelihoods, so it would be beneficial for planning to begin early.
Coordinate Land to Sea Planning
To manage the impacts of high rainfall and flash flooding in the coastal zone, the government of Mauritius should fully implement and maintain the Land Drainage Master Plan of 2022. Blending green infrastructure into existing retention areas and into Mauritius’ urban areas can also improve stormwater management. Green stormwater management infrastructure – such as inland wetlands, bioswales, parks, and permeable pavement – can improve water retention, clean and filter stormwater, reduce sewage overflow, and reduce erosion.145Melissa Denchak. “Green Infrastructure: How to Manage Water in a Sustainable Way”. NRDC. July 25, 2022. https://www.nrdc.org/stories/green-infrastructure-how-manage-water-sustainable-way. It also offers other co-benefits such as mitigating the urban heat island effect and improving air quality.146Ibid. Finally, improved water retention capacity increases the amount of water that can be used to refill Mauritius’ aquifers, which would increase available freshwater resources and reduce the risk of saltwater intrusion. In addition to new bioswales, parks, and other green absorptive infrastructure, the government should support the conservation and protection of existing wetlands, including by restricting or prohibiting development on them. Given the rapid rate of SLR, however, the government could also consider increased monitoring of groundwater levels, identifying areas at particularly high risk of saltwater intrusion, and regulating the use of freshwater resources, especially during periods of below average rainfall.
Co-develop Sector-Specific Climate Adaptation Plans with the Private Sector for the Tourism and Fisheries Sectors
Tourism Sector
The tourism sector is an important part of Mauritian economy, accounting for up to 20 percent of the economy, and is central to planned economic growth in the future. At present, the sector is predominantly founded on a sun-sand-sea model of tourism that generates low levels of revenue from each tourist and is highly vulnerable to the impacts of climate change. Rising seas wipe away beaches; tropical cyclones and flash flooding damage hotels, restaurants, and other critical infrastructure. Tropical cyclones and marine heatwaves damage coral reefs. The combination of its economic importance and climate vulnerability suggest the need for a sector specific resilience plan that identifies the specific needs of Mauritius’ tourism sector and makes detailed recommendations for its future.
Strengthening climate resilience in Mauritius’ tourism sector begins with outreach to participants in the tourism sector – hotels, guest houses, restaurants, tour companies, and others. This engagement will help them understand the risks that climate change may pose to their operations, how their operations shape climate vulnerability in the broader coastal zone, and what actions they can take to strengthen resilience, especially around stabilizing the shoreline. In addition to active outreach and collaboration, the Ministry of Tourism and the Ministry of Environment, Solid Waste, and Climate Change could create a resource center of best practices to help actors in the tourism sector assess and address climate risk.
The government of Mauritius also has an opportunity to build on its investment in cyclone preparedness and disaster response and extend it to the specific needs of the tourism sector. This includes ensuring that all the businesses operating in the tourism sector have a continuity plan, which increases the proportion of businesses which survive and remain in operation in the years following a disaster.147Ready Business. “Hurricane Toolkit,” 2020. https://www.ready.gov/sites/default/files/2020-04/ready_business_hurricane-toolkit.pdf. In addition to direct aid, such as the one provided to individuals and households post-Belal, providing government recovery loans to small tourist businesses also help reduce post-disaster business failure, increase employment and revenue, and incentivizes additional lending from the private sector.148Collier, Benjamin, Sabrina T. Howell, and Lea Rendell. “After the Storm: How Emergency Liquidity Helps Small Businesses Following Natural Disasters.” Center for Economic Studies (CES) Working Paper Series. United States Census Bureau, April 2024. https://www.census.gov/library/working-papers/2024/adrm/CES-WP-24-20.html. Ensuring a rapid recovery of the tourism sector from a disaster does not only depend on the survival of the businesses and infrastructure, but also on the recovery of the natural maritime ecosystems that help attract tourists to the island. To facilitate this recovery, the government may want to consider parametric insurance for coral reefs, which can provide immediate funds for rapid response and restoration.149 Mesoamerican Reef Rescue Initiative (RRI). “Parametric Insurance Model for Reefs: An Innovative Financial Mechanism for Reef Conservation and Risk Resilience.” Mesoamerican Reef Fund (MAR Fund), 2021. https://marfund.org/en/wp-content/uploads/2021/01/Fact-Sheet-Insurance-Model-for-Reefs.pdf.
This type of insurance has been deployed previously in Central America, Mexico, Hawaii,150The Nature Conservancy. “The Nature Conservancy Announces First-Ever Coral Reef Insurance Policy in the U.S.,” November 21, 2022. https://www.nature.org/en-us/newsroom/first-ever-us-coral-reef-insurance-policy/. and Fiji.151WTW. “WTW Launches First Ever Coral Reef Insurance Policy in Fiji,” February 5, 2024. https://www.wtwco.com/en-gb/news/2024/02/wtw-launches-first-ever-coral-reef-insurance-policy-in-fiji.
Longer-term structural changes to Mauritius’ tourism model could also help enhance the sector’s climate resilience. Designing and implementing regulations and incentives to reduce the destruction of coastal ecosystems that provide services that reduce climate impacts, including mangroves and other coastal wetlands, would improve shoreline protection, reduce wind damage, and provide habitat for key marine species. Some stakeholders mentioned that the private sector is interested in collaboration around conservation and restoration of coral reefs and mangroves. Hotels and other large tourism businesses could serve as a useful starting point for the Ministry of Environment, Solid Waste, and Climate Change’s ambitious solid waste diversion targets, with predictable operations at sufficient scale for the investments that will need to be made in non-landfill waste management operations. Addressing solid waste, along with other potential marine contaminants such as untreated wastewater and agricultural runoff, will also improve the sustainability of the coral reef restoration efforts currently being undertaken with the support of the UNDP and the Adaptation Fund.152Adaptation Fund. “Restoring Marine Ecosystem Services by Rehabilitating Coral Reefs to Meet a Changing Climate Future (Mauritius, Seychelles).” Adaptation Fund (blog). Accessed May 29, 2024. https://www.adaptation-fund.org/project/restoring-marine-ecosystem-services-restoring-coral-reefs-meet-changing-climate-future-mauritius-seychelles/. Expanding these restoration efforts, and monitoring current and restored reefs, will help Mauritius continue to attract tourists. Ensuring healthier corals and improved biodiversity could also help Mauritius shift towards a model of tourism that generates more earnings per tourist through initiatives like eco-tourism, reducing the pressure on the country’s resources, increasing the sector’s climate resilience, and continuing to drive economic growth. Finally in the wake of increased heat, the government should include the potential for diversification in its tourism resilience plan that could offer additional tourism activities beyond the sun and sea model.
Fisheries Sector
As the source of almost 20 percent of its exports, a key source of protein for many of its coastal communities, Mauritius’ fisheries are important for the country’s economic and food security and are part and parcel of its social and cultural fabric. The commercial fisheries sector is also one of the government’s target areas for future economic development. Yet the sector also faces key challenges identified in this assessment, including around unsustainable fisheries management, rising ocean acidification, and marine heatwaves. Given the importance of the fisheries sector, Mauritius may find it valuable to strengthen its robust management framework. That framework has recently been updated through the Fisheries Act 2023. The Ministry of Blue Economy, Marine Resources, Fisheries and Shipping also manages Mauritius’ fisheries in response to changing conditions and in cooperation with regional partners.
An accurate and detailed understanding of the state of its fish stocks should be the foundation of sustainable and climate resilient management of Mauritius’ fisheries. Baseline stock assessments, accompanied by consistent monitoring of seasonal and annual changes, are key. This monitoring should be sure to include an assessment of threats such as invasive species, such as lionfish and crown-of-thorns starfish. It could also include regular assessments of the level of enforcement in the country’s six fishing reserves and two marine parks.153Marine Protection Atlas. “MPA Guide – Mauritius.” Marine Conservation Institute. Accessed May 29, 2024. https://mpatlas.org/countries/MUS. The government of Mauritius already collects data on the state of the country’s fisheries, but some stakeholders raised concerns about the accessibility and transparency of that data to all stakeholders. In addition to continuing and expanding data collection, the Ministry of Blue Economy should ensure that the data is easily accessible to the private sector and civil society.
This type of accessibility could help increase the buy-in and effectiveness of the Ministry’s management efforts. Stakeholders highlighted seasonal closures along with adjustments of catch limits and quotas for fisheries that are overfished as key elements of the Ministry’s management framework. Maintaining this flexible approach that is responsive to real-time, or at least seasonal, changes to fish stock health is critical. The Ministry of Blue Economy could strengthen its work by extending its flexible and transparent management to a wider range of species and incorporating projective modeling and scenario planning into its decision-making.
Mauritius already shares fisheries and scientific data with several regional fisheries management organizations (RFMOs) and cooperates on the management of regional fisheries, especially with the Indian Ocean Tuna Commission. Continuing this type of data sharing and coordination with regional partners and expanding the coordination of fisheries regulation and management measures can help ensure that fisheries in the Western Indian Ocean are resilient to rising climate threats.
Robust, ongoing engagement by the Ministry of Blue Economy, Marine Resources, Fisheries, and Shipping with the fishing industry, and fishing communities will help strengthen all stages of Mauritius’ fisheries management. The Fisheries Act 2023 established consultative committees designed for this type of engagement, and these committees should be adequately resourced, prioritized, and incorporated into fisheries management decision-making processes.
A continued dialogue and thorough understanding of the structure of the operations of both commercial and the artisanal fishers will help ministry staff better understand the likely impacts that their policies and regulations may have on the industry. By building trust and communicating regularly across the sector and the government it can also inform and strengthen monitoring efforts, as the perspective from those operating in the sector and on the water on a daily basis are likely to notice changes that are difficult to observe by the government. Frequent government communication with the fishing sector will help improve the government’s understanding of the status of fish stocks and health of Mauritius’ fisheries, while also helping the fishing sector understand the reason for changes in policy or regulation This type of regular exchange of information and ideas can build trust, lead to buy-in in management and improve management effectiveness.
Appendices
Appendix 1: Full list of indicators for CORVI Mauritius
The 35 indicators used for this CORVI Rapid Assessment were selected from the full list of CORVI indicators in a collaborative process between the Stimson Center, Commonwealth Blue Charter, the Mauritius Ministry of Blue Economy, Marine Affairs, Fisheries, and Shipping, and other stakeholders from government, the private sector, and civil society.
Ecological Risk Categories and Indicators
[table “80” not found /]Economic Risk Categories and Indicators
[table “81” not found /]Social Risk Categories and Indicators
[table “82” not found /]Appendix 2: Surveyed Organizations
| AFD |
| Albion Fisheries Research centre, Mauritius |
| Attitude Hospitality Management Ltd |
| Beach Authority |
| Business Mauritius |
| Central Electricity Board |
| Eco-Sud |
| ENL Limited |
| EU Delegation Mauritius |
| IBL Seafood |
| Mauritian Wildlife Foundation |
| Mauritius Oceanography Institute |
| Ministry of Blue Economy, Marine Resources, Fisheries and Shipping |
| Ministry of Energy and Public Utilities |
| Ministry of Environment, Solid Waste Management and Climate Change |
| Ministry of Financial Services and Good Governance |
| Ministry of Housing and Land Use Planning |
| Ministry of Industrial Development |
| Ministry of National Infrastructure and Community Development |
| Municipal City Council of Port Louis |
| National Disaster Risk Reduction & Management Centre |
| National Human Rights Commission |
| SAFIRE |
| Statistics Mauritius |
| Sun Limited |
| UN Resident Coordinator’s Office |
| University of Mauritius |
Appendix 3: The Climate and Ocean Risk Vulnerability Initiative
It is clear that island states and urban coastal areas are likely to experience the earliest onset and potentially most severe impacts from climate change. The risks associated with climate change for specific island states and coastal cities, however, are much more difficult to untangle. In order for coastal cities to efficiently allocate resources and enact effective adaptation strategies, it is critical that they understand their multidimensional climate risk. However, these efforts are impeded by poor and incomplete data.154Hunt, Alistair, and Paul Watkiss. “Climate change impacts and adaptation in cities: a review of the literature.” Climatic change 104, no. 1 (2011): 13-49. https://doi.org/10.1007/s10584-010-9975-6. Data on climate risks is rarely available at the city level, and when it does exist, it is often poorly managed and stored in silos that make it difficult to access and use, even for city government officials.
155Hardoy, Jorgelina, and GustavoPandiella. “Urban poverty and vulnerability to climate change
in
Latin America.” Environment and Urbanization 21, no. 1 (2009): 203-224.
https://doi.org/10.1177/0956247809103019.
This issue is compounded by technical, financial, and capacity gaps, trapping coastal cities in a vicious cycle where they cannot develop holistic strategies to prioritize investment and access the funds needed to implement resilience actions.
Without data at the appropriate geographic scale, decision-makers are often left with the choice of either waiting for greater data availability, or attempting to downscale national level data, neither of which are ideal solutions for effective climate change adaptation. This problem is particularly acute in small and intermediate cities, which along with absorbing the bulk of East Africa’s future urban population growth, often lack the resources to gather and maintain necessary data.156“Demographic Trends and Urbanization,” World Bank, last modified May 19, 2021. Accessed August 16, 2021. https://www.worldbank.org/en/topic/urbandevelopment/publication/demographic-trends-and-urbanization.
Despite these challenges, decision makers need to act now in the face of uncertainty to build resilience to the climate crisis. To do this, they need tools that will enable them to consider multidimensional climate risks, develop cohesive strategies, and utilize this information to unlock additional climate finance and implement resilience actions.
In response, the Stimson Center developed the Climate and Ocean Risk Vulnerability Initiative (CORVI). CORVI is a decision support tool which compares a diverse range of climate-related risks across the land-seascape to produce a coastal city risk profile.157Stuart, J and Sally Yozell, 2020, CORVI: Understanding
and measuring climate risk, A guide to the Climate and Ocean Risk Vulnerability Index, The Stimson Center, Environmental Security Program. Accessed August 16, https://stimson.org/2020/corvi-understanding-and-measuring-climate-risk/. These risks are displayed across 10 categories, grouped under three risk areas: ecological, financial, and political (see figure 2). The 10 categories are in turn made up of close to 100 indicators, covering a range of issues including the vulnerability of vital infrastructure, the health of marine ecosystems, and urbanization dynamics in the chosen coastal city. Each indicator and category are scored using a 1-10 risk scale relative to other cities in the region, offering a simple reference point for decision-makers looking to pinpoint and categorize climate risks. The CORVI risk scores, which form the basis of a coastal city risk profile, are augmented with existing academic and grey literature, government documents, and key informant interviews to develop a comprehensive narrative and understanding of the island states’ or coastal city’s climate risks and identify priority policy recommendations.
The Stimson Center has also developed CORVI rapid assessments in partnership with the Commonwealth Blue Charter. Rapid assessments use 30-35 of the CORVI risk indicators across the 10 risk categories. The rapid assessments substitute stakeholder workshops for key informant interviews, and take place over an accelerated timeframe of five to six months.

How CORVI is Different
CORVI builds on the work of previous indices but is distinct in three ways.
- Locally Based: Unlike many other indices which tend to focus on the national or regional level, CORVI is city or small island based, providing sub-national level detail on the nature and impact of climate and ocean risks. This focus is based on extensive interviews with potential issuers of the CORVI tool, who noted that climate change is local and the difficulty of down-scaling national level risk and vulnerability data to inform policy action to build climate resilience in specific communities.
- Holistic: CORVI looks across a broad set of ecological, economic, social and political risk factors connected to climate change impacts and that influence vulnerability of coastal cities and their residents. As part of the category and indicator selection process, indicator inclusion was primary based on its ability to capture and explain climate change risks in coastal cities, and not if data was available. This approach promotes a holistic understanding of climate change impacts to coastal cities.
- Data Driven: Through using Structured Expert Judgment (SEJ), CORVI is suited to producing actionable insights in data sparse environments. By combining empirical and survey data across a wide range of indicators, CORVI fill data gaps to provide a holistic assessment, while reducing data availability bias. This approach provides a contextual and data driven assessment of climate and ocean risk vulnerability.

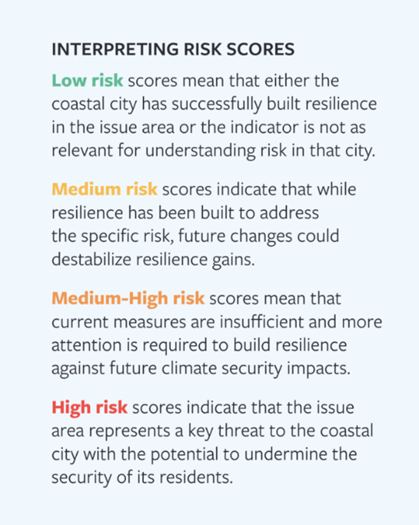
CORVI began in 2018, with the first two assessments – of Castries, Saint Lucia, and Kingston, Jamaica – completed and published in 2020. CORVI is now operating in 16 countries around the world, from the Caribbean to the South Pacific. The project now includes both full assessments, which incorporate around 100 risk indicators distributed across the 10 risk categories, along with rapid assessments, which incorporate 30-35 risk indicators across the same 10 risk categories.
Advancing the Sustainable Development Goals
CORVI also aims to contribute to the delivery of the SDGs – an essential framework to guide lasting, positive change. By providing data and information to measure climate risks in coastal cities, this project supports the delivery of the following SDGs:
CORVI operates in collaboration with national government authorities for every assessment. As a locally driven, comprehensive assessment of ocean and climate risk and vulnerability, the CORVI team engages with a wide range of partners on the ground, including national and local government, the private sector, civil society, and academia.
CORVI Rapid Assessments Completed
- Western Province, Sri Lanka
- Southwestern Urban Corridor, Barbados
- Tarawa, Kiribati
CORVI Full Assessments Completed
- Basseterre, St. Kitts and Nevis
- Castries, St. Lucia
- Chattogram, Bangladesh
- Dagupan, Philippines
- Dar es Salaam, Tanzania
- Kingston, Jamaica
- Mombasa, Kenya
- Suva, Fiji
CORVI Assessments Underway
- Aruba
- Belize City, Belize
- Dominica
- Mauritius
- Toamasina, Madagascar
Indicators
To ensure that the CORVI indicator scores provide a holistic risk rating, each is made up of five factors: current, past, and expected trends, the rate of change of the risk, and the impact of this risk on the coastal city.
- The BASELINE measures the current level of risk for each indicator relative to other coastal cities in the region. Baseline data for economic and social indicators is derived from the most recent year of complete data. Climate indicators use a longer time period of 15 years.15830-year time horizons are traditionally used to calculate the seasonal cycle and other long-term averages of climate variables. However, as the climate changes, current conditions are more dissimilar to those from 30 years ago than they are from 10 years ago. In this environment, the optimum climate normals (OCN) method can be used to calculate the minimum number of years required to accurately produce the climatological average for climate variables. The National Oceanic and Atmospheric Administration suggests that a 10-year time series for temperature and a 15-year time series for precipitation are acceptable minimum limits to produce an accurate climatology within a non-stationary period. CORVI follows the same limits that NOAA uses in their experimental seasonal forecast product by using a similar 15-year time horizon to measure climate indicators. For more information on OCN, see Wilks 2013.
- PAST TREND assesses the trend of risk for the past 10 years, measured from the baseline year. The only exception to the 10-year trend measure are the climate indicators, which use a 15-year trend horizon to account for slow onset changes.
- EXPECTED TREND assesses the anticipated trend of risk in the next 10 years, measured from the baseline year. The only exception to the 10-year trend measure are the climate indicators, which use a 15-year trend horizon to account for slow onset changes.
- MAGNITUDE assesses the degree of expected future trend change relative to other cities in the region. Change that happens quicker than expected is assumed to increase risk when compared to changes that take place over a longer time scale. This assumes that longer time periods of change contribute to less risk, as decision makers have more time to adapt and build resilience.
- Finally, IMPACT assesses the importance of change for each indicator in describing future risk in the coastal city.
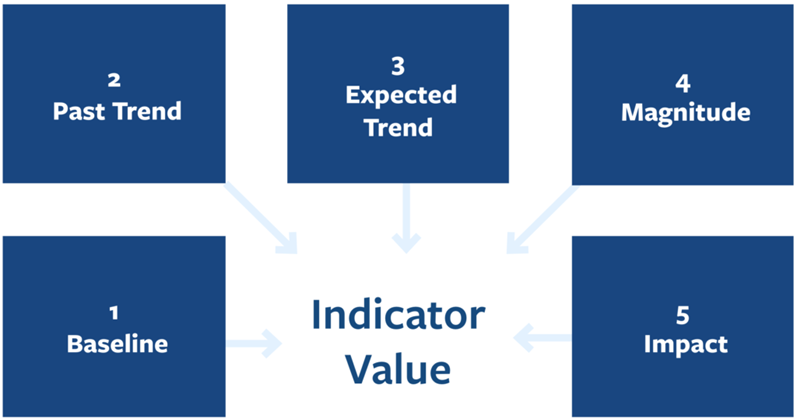
Data Collection and Structured Expert Judgement
To overcome data gaps, CORVI employs structured expert surveys to collect data that is otherwise unavailable. This primary data is combined with secondary data using the approach of structured expert judgement (SEJ) to produce a comparative score for each indicator in the assessment.159For an introduction to structured expert judgement, see Cherie Maestas, “Expert Surveys as a Measurement Tool: Challenges and New Frontiers,” in Lonna Rae Atkeson and R. Michael Alvarez (eds) The Oxford Handbook of Polling and Survey Methods (Oxford: Oxford University Press, 2018). SEJ is well-established social science technique that seeks to quantify risk when pre-existing secondary data is inadequate. Through interviews and surveys, as well as a series of weighting procedures to ensure data is representative, SEJ allows researchers to quantify topics that might otherwise be challenging to study in such a systematic fashion.
To apply SEJ to CORVI, subject matter experts across academia, government, civil society, and the private sector are identified through research and extensive outreach to stakeholders in the target coastal cities. These experts then refer the project team to other experts and stakeholders with appropriate expertise using “snowball sampling.”160Snowball sampling or chain-referral sampling is a non-probability sampling technique used when samples have traits that are difficult to find. In this sampling technique, existing subjects provide referrals to recruit additional subjects required for a research study. To guard against confirmation bias, survey answers are compared to a regional secondary empirical dataset to weigh the expert responses by utilizing a coherence check.161Abigail Colson and Roger Cooke, “Expert Elicitation: Using the Classical Model to Validate Experts’ Judgements,” Review of Environmental Economics and Policy 12, no. 1 (2018): 113-132. This ensures that experts whose answers do not match secondary data are not weighed as highly as those who do.
This approach has several strengths. First, CORVI incorporates the views of subject matter experts and local stakeholders at each stage of its implementation. This allows the final product to better reflect the specific context which it is seeking to measure and provide more focused information for end users. Second, pairing primary survey data with secondary data through SEJ also allows CORVI to provide insight into risks relating to urban coastal environments that existing secondary datasets do not cover. While the use of SEJ allows CORVI to assess a diverse range of risks, it should not be regarded as a substitute for empirical data collection. Rather, SEJ is best viewed as an alternative research technique specialized to analyzing topics with significant data gaps.
Appendix 4: Research Team and Acknowledgements
Research Team
Stimson Center
Natalie Fiertz, Tracy Rouleau, Sally Yozell, Noah Fritzhand
Commonwealth Blue Charter
Heidi Prislan, Dr. Jeff Ardron, Subaskar Sitsabeshan, Hilary Enos-Edu, Jonathan McCue
Emilie Wiehe (In-country Coordinator)
Acknowledgements
The research team wishes to express its appreciation for the support provided by the following organizations.
We are grateful to all of the individuals and organizations that participated in the surveys and workshops, including many offices of the Government of Mauritius.
Thanks to the Commonwealth Blue Charter for its invaluable partnership and support in advancing this project.
Thanks to the Mauritius Ministry of Blue Economy, Marine Resources, Fisheries, and Shipping for its vital partnership on this project.
This project was supported by the Ocean Risk and Resilience Action Alliance (ORRAA).
This project was undertaken with the financial support of the Government of Canada through the federal Department of Environment and Climate Change. Ce projet a été réalisé avec l’appui financier du gouvernement du Canada agissant par l’entremise du ministère fédéral de l’Environnement et du Changement climatique.


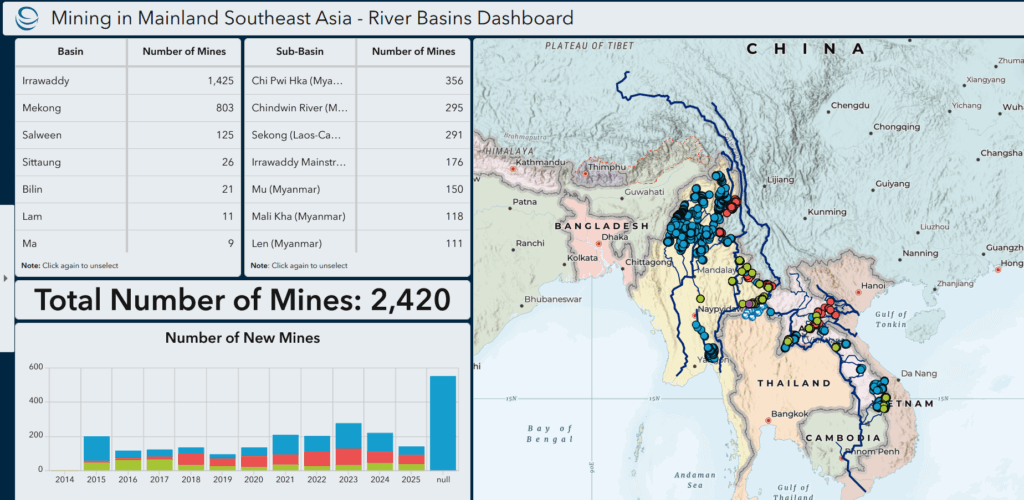


Community Adaptation for a Water Festival Without Clean Water