
This draft report presents the CORVI Climate Risk Summary Report for the island of Tarawa, Kiribati (see map below).
As risks from climate change to coastal cities continue to increase, governments, public and private investors, and the insurance industry need targeted risk information to prioritize action and build resilience where it matters most. In response, the Stimson Center developed the Climate and Ocean Risk Vulnerability Index (CORVI). CORVI is a decision support tool which compares a diverse range of ecological, economic, and social risks across 10 categories and nearly 100 indicators to produce a holistic coastal urban risk profile. The full CORVI assessment provides a much more in-depth analysis, which requires 15-18 months, while a rapid assessment provides a higher level of analysis in a 6-month timeframe.
This Climate Risk Summary Report is one of three CORVI Rapid Assessment Protocol pilot projects taking place in Kiribati, Sri Lanka, and Barbados, developed in partnership by the Commonwealth Secretariat’s Blue Charter program and the Stimson Center, with cooperation and participation by government representatives from each pilot country.1 Note: The project partners would like to thank the Government of Kiribati for their support and cooperation as well as the project’s funders, the Ocean Risk and Resilience Action Alliance (ORRAA). This pilot CORVI Rapid Assessment is a condensed version of the CORVI methodology.2 Note: To read more about the CORVI methodology, please visit https://stimson.org/project/corvi/resources-research/methodology/ It assesses the 30 highest priority CORVI risk indicators across 10 categories, selected by local stakeholders. Each risk indicator and category are scored using a 1-10 risk scale relative to other locations in the region. The CORVI Climate Risk Summary Report combines these risk scores with information from stakeholder workshops, surveys, desk research including secondary data to analyze how climate and ocean risks are impacting the study area, in this case, the island of Tarawa. This information is used to develop high-level priority recommendations for the Government of Kiribati and other key stakeholders to reduce climate vulnerabilities and work to build a sustainable future.
Further, there is potential to build on the rapid assessment and undertake a future full CORVI risk analysis which offers a more comprehensive profile of the climate risks and more targeted recommendations. The purpose of the rapid assessment is to provide initial high-level findings or results for a country allowing for the development of further climate risk initiatives or progression to the full CORVI assessment.3 Note: For more information on the methodology, please see the section entitled CORVI Rapid Assessments. A complete list of the risk indicators used for the Tarawa rapid assessment is provided below. In addition, a list of organizations that responded to surveys is included in the appendix.
Summary Findings
The island of Tarawa is part of the Gilbert Group of islands and includes the capital of Kiribati, South Tarawa. South Tarawa has a land area of approximately 15 square kilometers and is home to just over half of the total population of Kiribati and is composed of three main urban centers – Betio, Bairiki, and Bikenibeu – across a ribbon of atolls linked by a narrow causeway 35 km in length and a maximum of 300 m wide.4 Note: Donovan Storey and Shawn Hunter, “Kiribati: An Environmental ‘Perfect Storm’,” Australian Geographer 41, no. 2 (June 1, 2010): 167–81, https://doi.org/10.1080/00049181003742294. The population of South Tarawa increased by 12.4 percent between 2010 and 2015. It now has more than 56,000 people and a population density of nearly 3,200 people per square kilometer.5 Note: “Joint Implementation Plan for Climate Change and Disaster Risk Management (KJIP) 2019-2028,” Government of Kiribati, September 26, 2019, accessed April 29, 2022, https://napglobalnetwork.org/resource/joint-implementation-plan-for-climate-change-and-disaster-risk-management-kjip-2019-2028/ The population of North Tarawa has increased to around 6,600 people. The geographic area of this report consists of the entire island, including both North Tarawa and South Tarawa.

The CORVI Rapid Assessment identified significant vulnerabilities in the areas of ecological and financial risk, highlighting Tarawa’s very high vulnerability to coastal flooding and the reliance of the Kiribati economy and the national government’s budget on revenue from offshore foreign-flagged purse seine tuna fishing. Three of the four highest indicator scores – Percent of People Living Below 5 Meters Above Sea Level (9.20), Percent of Island at Risk of Flooding (8.77), and Rate of Coastal Erosion (8.60) reflect the vulnerability of an island with a maximum height of 2-3 meters. Sea levels will rise by 0.44-0.76 meters by 2100 according to the Intergovernmental Panel on Climate Change (IPCC)6 Note: Gerd Masselink and Paul Simon Kench, “Coastal Flooding Could Save Atoll Islands from Rising Seas – but Only If Their Reefs Remain Healthy,” The Conversation, September 16, 2021, accessed April 29, 2022, https://theconversation.com/coastal-flooding-could-save-atoll-islands-from-rising-seas-but-only-if-their-reefs-remain-healthy-167964. and sea level rise may cover more than 50 percent of Tarawa’s land and pose a threat to over 60 percent of the island’s population.7 Note: Audrius Sabūnas et al., “Impact Assessment of Storm Surge and Climate Change-Enhanced Sea Level Rise on Atoll Nations: A Case Study of the Tarawa Atoll, Kiribati,” Frontiers in Built Environment 7 (2021), https://www.frontiersin.org/article/10.3389/fbuil.2021.752599. This flooding, together with inadequate solid waste management and sewage practices, puts the island’s limited freshwater resources at risk. Solid and human waste, together with habitat destruction, overexploitation of marine resources, and other drivers, have also damaged the island’s marine ecosystems.
The second highest indicator score, Percent of National Economy Based in Offshore Fisheries (8.87), reflects Kiribati’s economically dependence on offshore fishing. Growth in fisheries revenue provided 85 percent of Tarawa’s total revenue growth from 2011 to 2018.8 Note: James Webb, “Kiribati Economic Survey: Oceans of Opportunity,” Asia & the Pacific Policy Studies 7, no. 1 (2020): 5–26, https://doi.org/10.1002/app5.297. The Vessel Day Scheme (VDS), a regional agreement that regulates access to tuna fishing in national water, was introduced in 2012 and dramatically changed the economic growth rate of the country. That revenue, however, is largely based on fishing for a single species, skipjack tuna, and modeling suggests climate change is likely to further reduce overall stocks and shift the species distribution. Despite its recent economic growth, Kiribati remains one of the least developed countries in the world. As a major importer and exporter of commodities, Kiribati is highly exposed to external shocks and reliant on overseas aid and overseas remittances.9 Note: “United Nations Pacific Strategy 2018-2022,” United Nations in the Pacific, December 2019, accessed April 29, 2022, https://unsdg.un.org/sites/default/files/2019-12/UNDP_WS_FINAL_UNPS_2018-2022.pdf. The next three highest risk indicators – National GDP Per Capita (8.00), Percent of People Employed in Artisanal and Subsistence Fishing (7.80), and Percent of National Economy Based in Near Shore Fishing (7.68) – highlight a precarious economic situation across the country. With limited arable land, Kiribati is forced to import almost everything except nearshore marine species and some limited agricultural products, and its remoteness from major markets imposes high transportation costs for imports and exports. As a result, Kiribati is heavily dependent on subsistence and artisanal fishing for its food security, with one of the highest per capita consumptions of fish in the world.10 Note: “Fisheries and Aquaculture – Fishery and Aquaculture Country Profiles – Kiribati,” Food and Agriculture Organization, June 2018, accessed April 29, 2022, https://www.fao.org/fishery/en/facp/kir.
Conditions in Tarawa offer greater access to goods and services, including education, employment, and healthcare. This has driven in-migration from Kiribati’s outer islands to the capital. The rapid population growth has resulted in largely unchecked expansion of unplanned settlements, including onto the island’s water catchment systems. This has added pressure on freshwater resources and contributed to shortcomings in solid waste and wastewater management.11 Note: Storey and Hunter, “Kiribati: An Environmental ‘Perfect Storm’.”
In the face of these challenges, the government of Kiribati has embraced a holistic approach to strengthening climate resilience. Taking advantage of improved fiscal stability, in recent years, it has launched several major infrastructure projects with the aim of advancing climate resilience, supporting further economic growth and reducing the impact of flooding. It has also developed an integrated series of plans aimed specifically at climate resilience, including the Kiribati Joint Implementation Plan (KJIP), which is “a comprehensive plan for multi sectoral and multilevel action on climate change action and disaster risk management”. The KJIP is closely aligned with other government plans, including the Climate Change Policy (CCP), the Kiribati Development Plan 2016-2019, and the Kiribati 20-Year Vision 2016-2036.12 Note: “Kiribati Joint Implementation Plan for Climate Change and Disaster Risk Management (KJIP) 2019-2028.” Government of Kiribati The government of Kiribati has also supported some innovative adaption ideas, such as the Temaiku Land and Urban Development project, which planned to raise 300 hectares of low-lying land on Temaiku Bight by 2-5 meters with the goal of housing more than 35,000 people.13 Note: Samuel V. Watkin, Michael Foon, and S. Liddell, “Temaiku Land and Urban Development – Building Sustainable Climate Change Resilience for Kiribati,” Environmental Science, 2019, https://www.semanticscholar.org/paper/Temaiku-land-and-urban-development-building-climate-Watkin-Foon/40d2f4b6eee5f1bdd902aa714b83611760a5b6c7. Another project uses sand dredged from lagoon floors and redistribute it to island coasts, though the risks associated with this type of dredging will increase as more sand is removed from the lagoon floor.14 Note: “Environmental Impact Assessment Report for the ESAT Dredging Project,” Kiribati Environment Data Portal, June 25, 2021, accessed May 18, 2022, https://kiribati-data.sprep.org/dataset/eia-report-esat-dredging-project. A third project would also replace the existing causeway across South Tarawa with bridges which will increase the sediment exchange between the Tarawa Lagoon and the ocean, thereby hopefully facilitating the natural deposit of sand that can also grow the island.15 Note: Patrick D. Nunn and Roselyn Kumar, “Pacific People Have Been ‘Pummelled and Demeaned’ for Too Long – Now They’re Fighting Back,” The Conversation, August 13, 2020, accessed May 2, 2022, https://theconversation.com/pacific-people-have-been-pummelled-and-demeaned-for-too-long-now-theyre-fighting-back-144278.
Summary of High-Level Recommendations
To build on these efforts and address the key challenges identified by the CORVI rapid assessment, three priority areas for action have been identified based on an analysis of CORVI the risk scores, stakeholder workshops, and desktop research:
- Implement integrated flood management and mitigation. Tarawa’s extremely high level of vulnerability to flooding, especially as global sea levels rise, demands a diversified approach to mitigating and managing flood risk and reducing coastal erosion. This should include a mix of both artificial and natural infrastructure, such as building seawalls and restoring key marine ecosystems, especially coral reefs. Monitoring of site-specific land accretion and erosion can further inform necessary adjustments to the plans. Land changes should also be part of the solution, especially for land that is not protected by hard or natural infrastructure. This can include raising low-lying land and making improvements to land-based infrastructure, such as raising houses. These kinds of strategies form a key part of both the KJIP and the CCP.
- Move towards a circular economy. Improving solid and human waste management and reducing marine debris will help strengthen natural coastal defenses and reduce the impact of flooding. Given Tarawa’s remoteness and its dependence on the blue economy, both exporting and dumping waste are unviable. Kiribati should therefore encourage a move towards a circular economy, employing the three R’s, –reduce, reuse, and recycle all forms of waste. For example, reuse could include utilizing waste in hard infrastructure or land reclamation projects. Waste collection processes should also be improved through a combination of community education, and increased public and private collection services. Lessons learned in Tarawa could be shared with other islands in the archipelago.
- Diversify Kiribati’s economy. Increased revenue from offshore purse seine fishery licenses to foreign-flagged fleets fishing for tuna—especially skipjack tuna—has driven Kiribati’s rapid economic growth in recent years. Management steps like the VDS have been taken to improve the sustainability of this sector and should continue, however, benefits can also be gained by further diversifying the economy, and using Kiribati’s natural and human capital more effectively. Developing sustainable coastal tourism would leverage Kiribati’s wealth of natural resources, reduce unemployment, and increase tax revenues while preserving and enhancing Kiribati’s natural and cultural heritage. Kiribati can also better harness its human capital by investing in green innovation and entrepreneurs with a focus on climate adaptation planning, renewable energy technology, and solid waste management, identified as high-risk areas in this assessment. Diversifying Kiribati’s economy would also reduce the risk related to the percentage of the national economy based in near shore and offshore fishing industries both of which ranked as high risk in this assessment.
By implementing these proposed recommendations, Kiribati can continue to strengthen climate resilience to ensure a safe and sustainable future while serving as a leader in climate adaptation, both for other small island developing states and the rest of the world.
Pilot CORVI Rapid Assessments
Island states and coastal cities are at the forefront of the climate crisis. Rising sea levels, extreme storms, and heat events are amplifying the vulnerability of citizens. At the same time, island states and coastal cities face underlying economic and social concerns, such as expanding populations, limited resources, and aging infrastructure, at times compounded by poor governance. These interconnected pressures threaten ocean and land-based ecosystems, which are critical for economic and food security. To combat these systemic risks, decision makers need information to help them prioritize actions to build resilience through climate-smart policies, including increased use of nature-based solutions. However, rigorous data collection and subsequent integrated analysis necessary for the development of successful solutions are resource intensive and out of reach for many Small Island Developing States (SIDS) and developing coastal states.
The Stimson Center and the Commonwealth Secretariat partnered to pilot a rapid climate risk assessment methodology in three Commonwealth countries (Barbados, Kiribati, and Sri Lanka) under the Commonwealth Blue Charter program. The project is based on the cross-cutting methodology of the Climate and Ocean Risk Vulnerability Index (CORVI). Developed by the Stimson Center, CORVI produces comprehensive risk profiles for coastal cities and island states and helps leaders make climate-smart investments designed to build cross cutting climate resilience in their country. The Commonwealth Secretariat led country engagement, review, and advisory support, while the Stimson Center led the research and conducted the analytical work. An in-country engagement officer was contracted to support the project. She assisted in the selection of diverse experts from the national government along with private sector and NGO stakeholders, who helped identify priority areas of climate risk.
To adapt the CORVI methodology for a rapid assessment, the 97 indicators used in a full CORVI assessment were reduced to thirty, three risk indicators for each of the ten risk categories (see Figure 1 below), in consultation with national stakeholders.

Sixty-six expert surveys were collected from 29 subject matter experts in Kiribati.16 Note: Experts are defined broadly, as described in USAID’s Climate Vulnerability Assessment: An Annex to the USAID Climate-resilient Development Framework. Experts include key donors, responsible ministries, NGOs, universities, research institutions, local planning and other departments, private sector, sector/livelihood organizations, vulnerable populations, etc. Risk scores for each of the 30 indicators were calculated using expert surveys and pre-existing secondary data collected for the Pacific Islands during prior full CORVI assessments (See Figure 2).

A complete list of the indicators used for the Tarawa rapid assessment is provided below. In addition, a list of organizations that provided surveys is included in the appendix.
CORVI Analysis
The following sections provide a greater level of detail on the climate risks faced by the island of Tarawa delineated by the 30 selected risk indicators across ecological, financial, and political risk areas.
Ecological Risk
Ecological risks in Tarawa are concentrated in the categories of Geology/Water and Climate, though there are medium-high risks across all four categories. This concentration is driven primarily by Tarawa’s extremely low-lying topography and reliance on blue economy sectors that are vulnerable to changing ocean conditions.
- In the CLIMATE category, Change in Sea Surface Temperature (7.67) reflects the negative impacts increasing ocean temperatures have on ecosystems. Ocean temperatures have been rising since the 1970s and are projected to continue to rise in the coming decades. Cases of Vector-Borne Disease Infections (7.00) is scored as medium-high risk while the Number of People Affected by Extreme Weather Events (3.64) is scored as medium risk.
- The indicators in the ECOSYSTEMS category have similar scores, all scored as medium-high risk, showing comparable levels of importance and vulnerability for marine ecosystems in Tarawa, including mangroves (5.80), seagrasses (5.57), and coral reefs (5.30).
- In the FISHERIES category, the indicator with the highest level of risk is the Number of Incidents of Foreign Vessels Fishing in EEZ (7.12), which affects Kiribati’s major export. The Capacity of Fisheries Enforcement (5.36) is also scored as medium-high. Near Shore Fish Stock Status (4.90) is scored as medium risk.
- GEOLOGY/WATER contains the two highest-risk indicators in the Ecological Risk Area, Percent of Island at Risk of Flooding (8.77) and Rate of Coastal Erosion (8.60), starkly illustrating the high level of vulnerability of Tarawa to rising global sea levels. Piped Water Supply Continuity (6.53) is rated as medium-high risk.
Tarawa has an extremely high level of vulnerability to coastal flooding. Sea levels will rise by 0.44-0.76 meters by 2100 according to the Intergovernmental Panel on Climate Change (IPCC)17 Note: Masselink and Kench, “Coastal Flooding Could Save Atoll Islands from Rising Seas – but Only If Their Reefs Remain Healthy.” and sea level rise may cover more than 50 percent of Tarawa’s land and pose a threat to over 60 percent of the island’s population.18 Note: Sabūnas et al., “Impact Assessment of Storm Surge and Climate Change-Enhanced Sea Level Rise on Atoll Nations.” Experts highlighted that certain populations, particularly those living with disabilities, are at greater risk from flooding. A 2018 study found that most atolls will experience annual wave-driven overwash by the mid-21st century, which will damage freshwater sources and infrastructure.19 Note: Curt D. Storlazzi et al., “Most Atolls Will Be Uninhabitable by the Mid-21st Century Because of Sea-Level Rise Exacerbating Wave-Driven Flooding,” Science Advances 4, no. 4 (n.d.): eaap9741, April 25, 2018, https://doi.org/10.1126/sciadv.aap9741. The consequent flooding and loss of land, buildings, and infrastructure are exacerbated by severe coastal erosion driven by the mining of sand and aggregates and the removal of mangroves.20 Note: “Kiribati Joint Implementation Plan for Climate Change and Disaster Risk Management (KJIP) 2019-2028.” Government of Kiribati
There is also some research to suggest that as little as a 0.1-meter rise in sea levels could reduce the thickness of Tarawa’s freshwater lenses (the layer of fresh water that sits above denser saltwater) by 60 percent. These lenses are the source of freshwater supply for most of the island.21 Note: Storey and Hunter, “Kiribati: An Environmental ‘Perfect Storm’.” The recharge of these lenses, and therefore the continuity of the islands water supply, is entirely dependent on rainfall.22 Note: Ibid. Annual rainfall already ranges from a low of 150 mm to a high of 4000 mm,23 Note: “Kiribati Joint Implementation Plan for Climate Change and Disaster Risk Management (KJIP) 2019-2028.” Government of Kiribati and such variability is expected to increase due to climate change.24 Note: Storey and Hunter, “Kiribati: An Environmental ‘Perfect Storm’.” Most households only have piped fresh water for one hour every second day through a communal pipe system and rely on wells and limited rainwater harvesting. Experts suggested that this limited piped water supply system may be one reason why Piped Water Supply Continuity was only rated as a medium-high risk, as freshwater challenges on Tarawa often lay outside the piped system specifically.
The water supply is further affected by shortcomings in sanitation and waste management, exacerbated by ineffective land-use planning and lack of enforcement of regulations, which has contaminated the Tarawa Lagoon and freshwater sources. Most surface water pollution comes from the lack of solid waste management which results in sewage directly flowing into the water. While the lack of waste management infrastructure is causing trash to be dumped onto the reefs or the edge of the lagoon.25 Note: Ibid. Common sources of groundwater contamination include swamp taro pits, pit latrines, failing septic tanks, and leaching from solid waste sources on the surface.26 Note: Ibid. Experts highlighted that broken-down vehicles, household waste, and non-recyclable plastics, especially from imported goods, are major sources of solid waste, none of which is recycled. Informal housing has occurred on water catchment systems due to a combination of population growth and ineffective land management. Efforts to restrict housing on areas set aside to protect freshwater sources have seen limited community support and a failure to enforce restrictions.27 Note: Ibid.
Although Kiribati is not often hit by tropical cyclones, the country is not exempt from other natural disasters. Most notably, the country was hit by a severe drought which affected the entire population in 1999.28 Note: Dongyeol Lee, Huan Zhang, and Chau Nguyen, “The Economic Impact of Natural Disasters in Pacific Island Countries: Adaptation and Preparedness,” International Monetary Fund, May 10, 2018, accessed April 29, 2022, https://www.imf.org/en/Publications/WP/Issues/2018/05/10/The-Economic-Impact-of-Natural-Disasters-in-Pacific-Island-Countries-Adaptation-and-45826. Given the limited availability of freshwater even in normal years and a constrained ability to store water outside of the underground lenses, Kiribati remains vulnerable to another such event. Desalination has been proposed to increase the availability of freshwater in Tarawa but is both expensive and technically challenging.29 Note: “Kiribati Integrated Energy Roadmap: 2017-2015,” International Renewable Energy Agency, July 2017, accessed April 29, 2022, https://www.irena.org/publications/2017/Jul/Kiribati-Integrated-Energy-Roadmap#:~:text=In%202015%2C%20the%20Government%20of,in%20the%20years%20until%202025.
Together with periods of heavier rain and warmer temperatures, the shortcomings in managing waste also contribute to vector-borne diseases. Build-ups of waste provide a breeding ground for multiple potential disease vectors, including mosquitos, rats, and flies.30 Note: Storey and Hunter, “Kiribati: An Environmental ‘Perfect Storm’.” Kiribati has already observed increases in vector-borne diseases, especially dengue fever.31 Note: “Kiribati Joint Implementation Plan for Climate Change and Disaster Risk Management (KJIP) 2019-2028.” Government of Kiribati Heavy rains interacting with untreated waste can also cause an increase in waterborne diseases.32 Note: Ibid.
In many places, marine ecosystems such as coral reefs, seagrasses, and mangroves provide protective functions which help reduce the impact of flooding and wave impacts and provide habitat for nearshore marine wildlife. Healthy mangrove systems also help stabilize coastal erosion. Surveyed experts in this study suggest that all three types of ecosystems are facing a medium-high level of risk and while technical information is limited,33 Note: Iete Rouatu, et. al., “National Marine Ecosystem Valuation: Kiribati,” MACBIO, 2015, accessed April 29, 2022, https://macbio-pacific.info/wp-content/uploads/2017/08/Kiribati-MESV-Digital-LowRes.pdf. much of it supports the assessment findings. Coral reefs in Kiribati have faced numerous acute disturbances over the last fifteen years, including mass bleaching episodes in 2004-2005 and 2009-2010 along with an outbreak in 2014 of Crown-of-Thorns starfish, a predator of corals that can devastate a reef34 Note: Sara E. Cannon et al., “Coral Reefs in the Gilbert Islands of Kiribati: Resistance, Resilience, and Recovery after More than a Decade of Multiple Stressors,” PLOS ONE 16, no. 8 (August 11, 2021): e0255304, https://doi.org/10.1371/journal.pone.0255304. They have also faced more chronic threats, including nutrient pollution loading, sedimentation, and fishing practices harmful to the reef, especially in South Tarawa.35 Note: Ibid. Key pressures on seagrasses have included water pollution, eutrophication, overfishing (e.g., direct threats from propellors, dragging nets, and dredging, and indirect threats via the collapse of the food web), and coastal erosion along with the construction of the causeway linking the islets of South Tarawa, which causes sediment disturbances and turbidity plumes, harming seagrass ecosystems.36 Note: Paul L.A. Erftemeijer, “Seagrass Restoration Guidelines for Kiribati,” Secretariat of the Pacific Regional Environment Programme, March 2020, accessed April 29, 2022, https://www.sprep.org/sites/default/files/documents/publications/seagrass-restoration-guidelines-Kiribati.pdf. The main pressures on mangroves have been clearance for development, land-based pollution, and the unsustainable use of mangroves for construction materials.37 Note: Paul L.A. Erftemeijer, “Mangrove Planting Guidelines for Kiribati,” Secretariat of the Pacific Regional Environment Programme, March 2020, accessed April 29, 2022, https://www.sprep.org/sites/default/files/documents/publications/mangrove-planting-guidelines-Kiribati.pdf.
Water temperatures in the Gilbert Islands have already risen by approximately 0.15oC since the 1970s, with further increases predicted due to climate change.38 Note: “Kiribati Joint Implementation Plan for Climate Change and Disaster Risk Management (KJIP) 2019-2028.” Government of Kiribati Warming waters and increasing ocean acidification can inhibit the growth of key marine species grown for local consumption and export, including seaweed, giant clams, pearl oysters, and sea cucumbers.39 Note: Ibid. Further, warmer waters are known to increase the risk of harmful algal blooms and ciguatera poisoning which can harm human health.40 Note: Ibid. Due to several climate change-driven factors, including increase in sea surface temperature, the productivity of coral reef fish and invertebrates is projected to fall by 20 percent by 2050.41 Note: Ibid. The healthier a marine resource is, the more likely it can withstand climate shocks including warmer waters. Sustainable management of these existing resources is important to prevent loss. Protection will continue to play a key role in avoiding repeats of the near collapse of ark shell (red clam) production, which fell by over 90 percent since the early 1990s due to overexploitation, and as of 2017 has not shown any sign of revival.42 Note: “Fisheries and Aquaculture – Fishery and Aquaculture Country Profiles – Kiribati,” Food and Agriculture Organization
Kiribati has seen significant challenges with illegal, unreported, and unregulated (IUU) fishing by foreign vessels in its extensive EEZ, especially by Chinese and Taiwanese fleets.43 Note: Joseph Hammond, “Chinese Fishing Fleet Poses Threat to Pacific Island Economies,” Indo-Pacific Defense Forum, June 21, 2021, accessed April 29, 2022, https://ipdefenseforum.com/2021/06/chinese-fishing-fleet-poses-threat-to-pacific-island-economies/. Over the past decade, there has been a sharp increase of foreign vessels fishing in the Kiribati exclusive economic zone (EEZ), particularly an increase from China and Taiwan. The Kiribati government relies on foreign fish licenses for important government revenues. In March 2020, a Kiribati fishery observer died aboard a Taiwanese-flagged vessel under suspicious circumstances and there have been concerns that Kiribati’s observer program does not meet all the minimum standards established by the Western and Central Pacific Fisheries Commission and updated in 2015.44 Note: Aaron Orlowski, “Kiribati Fishery Observer Dies at Sea in the South Pacific,” SeafoodSource, April 14, 2020, accessed April 29, 2022, https://www.seafoodsource.com/news/supply-trade/kiribati-fishery-observer-dies-at-sea-in-the-south-pacific. In December 2020, however, the European Union lifted its “yellow card”, the official IUU fishing warning it had issued in April 2016 after the country worked with the EU to implement a series of IUU fishing reforms to bring its fisheries control legislation in line with international law, including establishing a sanctioning system and improving supply chain traceability.45 Note: Jason Holland, “EU Lifts Kiribati’s Fisheries Yellow Card,” SeafoodSource, December 7, 2020, accessed April 29, 2022, https://www.seafoodsource.com/news/supply-trade/eu-lifts-kiribati-s-fisheries-yellow-card. More broadly, Kiribati reduced overfishing through the establishment of the Vessel Day Scheme in 2012 together with the other members of the Parties to Nauru Agreement and Tokelau Islands.46 Note: Christopher Pala, “How Eight Pacific Island States Are Saving the World’s Tuna,” Foreign Policy, March 5, 2021, accessed April 29, 2022, https://foreignpolicy.com/2021/03/05/tuna-fishing-overfishing-conservation-pacific-islands-skipjack-pna/.
Both the Kiribati government and international partners have undertaken several efforts to address the country’s key areas of ecological vulnerability. Most notably, the government developed the Kiribati Joint Implementation Plan (KJIP), the NAP Global Network, and the Kiribati National Expert Group on Climate Change and Disaster Risk Management. The KJIP identifies 12 major strategies, including promoting healthy and resilient ecosystems, strengthening health service delivery to address climate change impacts, and promoting sound and reliable infrastructure development and land management. The latter includes goals around protecting water reserves, ensuring sufficient fresh water even during extreme weather events, and improving sanitation facilities.47 Note: “Kiribati Joint Implementation Plan for Climate Change and Disaster Risk Management (KJIP) 2019-2028.” Government of Kiribati Work on two desalination plants commenced in April 2022 to provide additional freshwater, supported by the Asian Development Bank, World Bank, Green Climate Fund, and Global Environment Facility.48 Note: “Biggest Water Project in Kiribati Commences,” Islands Business, April 21, 2022, accessed April 29, 2022, https://islandsbusiness.com/news-break/biggest-water-project-in-kiribati-commences/. Two other notable efforts include the South Tarawa Sanitation Improvement Sector Project and the Temaiku Land and Urban Development project, which aim to reclaim 300 hectares of low-lying land, raise the land by approximately two to five meters, and use it to house 35,000 people.49 Note: Samuel V. Watkin, Michael Foon, and S. Liddell, “Temaiku Land and Urban Development – Building Sustainable Climate Change Resilience for Kiribati.”
Financial Risk
Tarawa has a very high level of vulnerability in the Financial Risk Area; five of the ten indicators are scored as high risk. The island’s very low-lying topography is a key factor in the highest risk indicator, while Kiribati’s status as a Least Developed Country (LDC) and its reliance on a small number of key industries are also key drivers of these vulnerabilities.
- In the ECONOMICS category, both National GDP Per Capita (8.00) and National Youth Unemployment Rate (7.67) are scored as high risk, indicating ongoing economic challenges in spite of fairly rapid economic growth in the years before the pandemic. National Unemployment Rate (6.80) is scored as medium-high risk.
- The INFRASTRUCTURE category includes the indicator of highest risk in this study, Percent of People Living Below 5 Meters Above Sea Level (9.20). Both Renewable Energy Share in Total Energy Consumption (6.91) and Percent of Population with Adequate Access to Electricity (5.56) are scored as medium-high risk.
- In the MAJOR INDUSTRIES category, both Percent of National Economy Based in Offshore Fisheries (8.87) and Percent of National Economy Based in Near Shore Fishing (7.68) are scored as high risk. The Percent of National Economy Based in Agriculture (7.07) is scored as medium-high risk.
According to the World Bank, Kiribati is one of the least developed countries in the world, having the 20th smallest GDP per capita as of 2020.50 Note: “GDP per Capita, PPP (Current International $),” The World Bank, accessed April 29, 2022, https://data.worldbank.org/indicator/NY.GDP.PCAP.PP.CD. Kiribati has little fertile land for agriculture and is too remote from other nations to be integrated into global industry value chains, (Tarawa is over 5000 km from Australia and Japan), all of which severely limits available economic opportunities.51 Note: James Webb, “Preparing to Graduate Issues Challenges and Strategies for Kiribati’s LDC Graduation,” United Nations Economic and Social Commission for Asia and the Pacific, April 2019, accessed April 29, 2022, https://repository.unescap.org/bitstream/handle/20.500.12870/1217/ESCAP-2019-WP-Preparing-to-graduate-issues-challenges-and-strategies-for-Kiribati%27s-LDC-graduation.pdf?sequence=2&isAllowed=y. The country’s main exports are composed of just three products: fish, crude coconut oil, and unprocessed copra (coconut) and its major revenues come from selling fishing rights in its EEZ to foreign-flagged vessels.52 Note: James Webb. “Preparing to Graduate Issues Challenges and Strategies for Kiribati’s LDC Graduation.” Almost every other consumption good is imported,53 Note: James Webb, “Kiribati Economic Survey.” as well as fuel and capital goods, such as vehicles and machinery.54 Note: James Webb, “Preparing to Graduate Issues Challenges and Strategies for Kiribati’s LDC Graduation.” Extremely high transportation costs, due to Kiribati’s remote location, increase the prices of all imports including construction materials, as well as exports.55 Note: “Kiribati Joint Implementation Plan for Climate Change and Disaster Risk Management (KJIP) 2019-2028.” Government of Kiribati These high costs hinder economic development.56 Note: Wawan Juswanto and Zulfiqar Ali, “Economic Growth and Sustainable Development in the Pacific Island Countries,” Asian Development Bank Institute, no. 2016 (n.d.): 8., December 2016, https://www.adb.org/sites/default/files/publication/219266/adbi-pb2016-6.pdf As a result, Kiribati’s economy is highly exposed to external shocks, especially surges in food and fuel commodity prices,57 Note: “Kiribati Joint Implementation Plan for Climate Change and Disaster Risk Management (KJIP) 2019-2028.” Government of Kiribati which they are currently seeing around the globe. Overseas aid and remittances are major sources of income and are also vulnerable to changes in foreign economies.58 Note: “United Nations Pacific Strategy 2018-2022,” United Nations in the Pacific In addition, service costs are high; according to a 2019 UN study, most homes in Kiribati did not have water or sanitation.59 Note: James Webb, “Preparing to Graduate Issues Challenges and Strategies for Kiribati’s LDC Graduation.” Unemployment and especially youth unemployment is high; according to the World Bank was 22.5 percent in 2019.60 Note: “Unemployment, Youth Total (% of Total Labor Force Ages 15-24) (National Estimate) – Kiribati,” The World Bank, accessed April 29, 2022, https://data.worldbank.org/indicator/SL.UEM.1524.NE.ZS?locations=KI.
Despite the challenges it faces, in the years before the COVID-19 pandemic, economic growth in Kiribati was strong, with a peak of 9.9 percent real growth in the Gross Domestic Product (GDP) in 2015.61 Note: “World Economic Outlook (April 2022) – Real GDP Growth,” International Monetary Fund, accessed April 29, 2022, https://www.imf.org/external/datamapper/NGDP_RPCH@WEO. This expansion was driven by the rapid increase in revenues from foreign fishing licenses, which has made up roughly 60 to 90 percent of the GDP from 2014 and 2018.62 Note: James Webb. “Preparing to Graduate Issues Challenges and Strategies for Kiribati’s LDC Graduation.” The introduction of the Vessel Day Scheme (VDS) in 2012 was a major driver of these economic improvements. The VDS allows vessel owners to purchase and trade days in which they are allowed to fish in the waters of Kiribati and other Parties to the Nauru Agreement.63 Note: “Introduction” Pacific Islands Forum Fisheries Agency (FFA), accessed May 18, 2022, https://www.ffa.int/vds. The introduction of the VDS was a defining event for the Kiribati economy:
- In the five years leading up to VDS, GDP shrunk by 0.7 percent in real terms but after its implementation from 2012-2017 it saw real growth of 20.5 percent.64 Note: James Webb, “Kiribati Economic Survey.”
- Revenue from fishing license fees increased from $29 million in 2011 to $2017 million in 2015.65 Note: Ibid.
- Growth in fisheries revenue accounted for 85% of total revenue increase between 2011 and 2018.66 Note: Ibid.
- The value of a foreign-flagged purse seine fishing day increased from $1,350 in 2011 to $8,000 in 2016.67 Note: James Webb. “Preparing to Graduate Issues Challenges and Strategies for Kiribati’s LDC Graduation.”
- Fish catch almost tripled with an increase from 63,000 metric tons in 2011 to 173,000 metric tons in 2016 and tuna went from 30 percent of the catch in 2005 to 96 percent in 2016.68 Note: “Fisheries and Aquaculture – Fishery and Aquaculture Country Profiles – Kiribati,” Food and Agriculture Organization
Offshore commercial fishing is predominantly skipjack tuna, which accounts for over 78 percent of the total catch.69 Note: James Webb, “Kiribati Economic Survey.” The dependence on this one species is a key contributor to climate risk in Kiribati, as models suggest that climate change is likely to reduce the overall stocks of skipjack and change their habitat range, driving them into the eastern Pacific.70 Note: James Webb, “Preparing to Graduate Issues Challenges and Strategies for Kiribati’s LDC Graduation.” Furthermore, overfishing can limit the resilience of stocks that face climate impacts such as warming waters.
Almost all the skipjack caught in the EEZ is either transshipped through the country or transported directly to foreign ports. However, Kiribati has one of the highest per capita consumption of fish in the world,71 Note: “Fisheries and Aquaculture – Fishery and Aquaculture Country Profiles – Kiribati,” Food and Agriculture Organization which comes in large part from artisanal and subsistence fishing in lagoons, reefs, and other coastal areas.72 Note: Ibid. Some artisanal fishing also takes place for export markets, most notably of aquarium fish and sea cucumber.73 Note: Ibid. This highlights the importance of maintaining healthy marine ecosystems, especially coral reefs, for food security in Kiribati.
Agriculture, specifically coconut cultivation, is another key sector in the Kiribati economy. In addition to fish, copra – dried coconut flesh – and crude coconut oil are two of the country’s main exports. Government subsidies to copra growers, which doubled in 2016,74 Note: Webb, “Kiribati Economic Survey.” are a major part of the government’s budget. While the copra subsidy is higher than the international price of copra, it serves as a social protection scheme and a way to transfer revenues to the outer islands and reduce migration pressures on Tarawa.75 Note: Ibid.
Infrastructure in Tarawa faces three principal threats. The first is inundation; sea level rise may cover more than 50 percent of Tarawa’s land and pose a threat to over 60 percent of the island’s population.76 Note: Sabūnas et al., “Impact Assessment of Storm Surge and Climate Change-Enhanced Sea Level Rise on Atoll Nations.” The second is high capital costs; the country’s remoteness means that transportation costs are extremely high, and all capital goods and most construction materials need to be imported.77 Note: “Kiribati Joint Implementation Plan for Climate Change and Disaster Risk Management (KJIP) 2019-2028.” Government of Kiribati The third challenge is maintenance; infrastructure maintenance has been identified as a “key institutional gap”,78 Note: James Webb, “Kiribati Economic Survey.” hobbled by limited dedicated funding and a shortage of trained personnel.
Despite these challenges, Kiribati has successfully extended access to electricity to over 90 percent of its population.79 Note: “Access to Electricity (% of Population) – Kiribati,” The World Bank, accessed May 2, 2022, https://data.worldbank.org/indicator/EG.ELC.ACCS.ZS?locations=KI&view=chart. This is up from approximately 70 percent in the last 15 years. The current system primarily uses on fossil fuels, with 63 percent of the national energy supply coming from imported petroleum products as of 2014, and electricity represents one of the government’s highest expenditures.80 Note: Taibi et al., “Kiribati Integrated Energy Roadmap.” Approximately 30 percent of installed generation capacity in South Tarawa solar photovoltaic (PV).81 Note: Ibid. Further expansion of renewable electricity capacity will require increasing storage, likely in the form of battery storage, and greater technical expertise is needed to manage the dynamic loads that accompany high levels of renewable energy use due to changes in sunlight.82 Note: Ibid. These changes, can benefit Kiribati and have the potential to increase renewable energy generation, which could be particularly useful for water desalination, which requires lots of electricity.83 Note: Ibid.
In the face of these challenges, the government of Kiribati has taken several important steps to strengthen resilience. In recent years, the government has achieved fiscal stability due to development partner financing, fishing license revenues, and the country’s sovereign wealth fund.84 Note: “United Nations Pacific Strategy 2018-2022,” United Nations in the Pacific Historically, development grants have averaged 30 percent of GDP thanks to the country’s preferential access to financing as a least developed country (LDC).85 Note: “Kiribati: 2018 Article IV Consultation”. International Monetary Fund. January 24, 2019. Accessed May 18, 2022. https://www.imf.org/~/media/Files/Publications/CR/2019/cr1926-kiribati.ashx In addition to increasing its solar PV capacity since 2014, the government has undertaken other significant infrastructure projects. The three most notable projects are the Kiribati Road Rehabilitation Project (KRRP), the Kiribati Aviation Investment Program (KAIP), and the Betio harbor expansion.86 Note: James Webb, “Kiribati Economic Survey.” KRRP, for example, which was the single largest project ever undertaken in Kiribati, resealed the roads in South Tarawa and improved drainage, which will reduce flooding and damage from heavy rains.87 Note: Ibid. KRRP also led to the creation of a dedicated infrastructure maintenance fund.88 Note: Ibid.
One other initiative proposed by the government is related to the management of the Phoenix Islands Protected Area (PIPA) a major spawning ground for tuna species. Created in 2015, PIPA is a 408,250 square kilometer marine protected area with limited fishing within its boundaries. In late 2021, the government of Kiribati announced that they would change the management requirements and open PIPA to fishing. The government noted that the conservation contract (in partnership with a group of NGOs and research organizations) was to generate funds to offset the loss of revenue associated with PIPA fishing. According to the government it has thus far failed to do so, raising only $7 million against $60-140 million in lost revenue since 2015.89 Note: Bernadette Carreon, “Kiribati Moves to Open Phoenix Islands Protected Area to Fishing, Citing Lost Revenue,” SeafoodSource, November 19, 2021, accessed April 29, 2022, https://www.seafoodsource.com/news/environment-sustainability/kiribati-government-says-mpa-implementation-cost-country-millions-in-revenue. Some suggest that even without PIPA, the introduction of the VDS has helped reduce overfishing and stabilize fish stocks.90 Note: Christopher Pala, “How Eight Pacific Island States Are Saving the World’s Tuna.”
Political Risk
Political risks in Tarawa have two principal drivers, the high level of population density on the island, due in large part by in-migration from other parts of Kiribati, and the concentration of employment in a small number of key industries. In addition, to population and employment concerns, there are vulnerabilities in governance, especially around climate adaptation and disaster response planning.
- All three indicators in the GOVERNANCE category are scored as medium-high risk and all three have similar risk scores, led by Capacity of Current Disaster Response (6.17), and followed by National Climate Adaptation Plan (6.02) and Level of Perceived Transparency within Government (5.82).
- In SOCIAL AND DEMOGRAPHICS, Island Population Density (7.58) is rated as high risk, reflecting the widespread impacts of rapid population growth on the island’s very limited land area. Both Percent of Population Achieving Proficiency in Literacy and Numeracy (4.20) and Percent of Population Below Poverty Line (3.92) are rated medium risk, the lowest rating for any indicators in the political risk area.
- STABILITY includes the indicators with the highest risk in this area, Percent of People Employed in Artisanal and Subsistence Fishing (7.80), reflecting the key importance of that industry. Percent of People Employed in Commercial Fishing (6.20) and Percent of People Employed in Port and Shipping Industries (6.00) are both rated medium risk.
Tarawa faces two key vulnerabilities in the area of Political Risk, the large role of artisanal and subsistence fishing in the island’s employment and the island’s rapidly increasing population, primarily due to rapid urbanization in South Tarawa. Artisanal and subsistence fishing is a significant contributor to employment and food security in Tarawa and has played an increasing role in the island’s cash economy.91 Note: “Case Study: Community-Based Fisheries Management in Kiribati (on-Going),” Commonwealth Blue Charter, August 26, 2021, accessed May 2, 2022, https://thecommonwealth.org/case-study/case-study-community-based-fisheries-management-kiribati-going. Artisanal fisheries, however, have seen a decrease in production of tuna and other pelagic fish from boats based out of South Tarawa.92 Note: “Fisheries and Aquaculture – Fishery and Aquaculture Country Profiles – Kiribati,” Food and Agriculture Organization This may be due to the availability of rejected fish from tuna transshipment operations in Tarawa Lagoon, which decreases the demand for artisanal-caught fish,93 Note: Ibid. but may also be due to increasing pressure on coastal fisheries due to overharvesting along with pollution and habitat damage.94 Note: “Case Study: Community-Based Fisheries Management in Kiribati (on-Going),” Commonwealth Blue Charter In response, the government of Kiribati in recent years introduced Community Based Fisheries Management, including a pilot project in North Tarawa, which has seen some success.95 Note: Ibid. Employment in commercial fishing is also critical for Tarawa. While total employment in the sector is smaller and it plays a smaller role in national food security, a significant amount of national income comes from remittances from I-Kiribati employed as merchant seafarers abroad.96 Note: “Disaster Risk Reduction in the Republic of Kiribati,” United Nations Office for Disaster Risk Reduction – Regional Office for Asia and Pacific, 2020, accessed May 2, 2022, https://www.undrr.org/publication/disaster-risk-reduction-republic-kiribati-0.
Tarawa’s rapidly growing population is due to in-migration from the country’s outer islands.97 Note: “United Nations Pacific Strategy 2018-2022,” United Nations in the Pacific As a result, the population of South Tarawa increased by 12.4 percent between 2010 and 2015.98 Note: “Kiribati Joint Implementation Plan for Climate Change and Disaster Risk Management (KJIP) 2019-2028.” Government of Kiribati There are numerous pull factors driving in-migration, including greater employment and education opportunities in Tarawa compared to the outer islands, as well as more access to goods and services.99 Note: Storey and Hunter, “Kiribati: An Environmental ‘Perfect Storm’.” However, the rapid population growth has had unintended consequences such as widespread unplanned settlements, including on the island’s watersheds, outstripped the capacity of sanitation and waste management systems, and put pressure on Tarawa’s fragile freshwater supply.100 Note: Ibid. Gains made in the 1990s under the South Tarawa Urban Management Plan have been overwhelmed as formal and customary governance systems have been unable to adequately respond to population growth and changing patterns of development.101 Note: Ibid. Over the past forty years, the government has explored two principal avenues to limit in-migration and population growth on Tarawa. In the mid 1980s, they attempted a resettlement project that relocated around 1500 people to the islands of Teeraina and Tabuaeran but was later abandoned when the government decided to reserve those islands for future tourism development.102 Note: Ibid. The second type of response which is currently being employed is to use economic incentives to keep people in the outer islands; this has been cited as a key motivator for the copra subsidy.103 Note: James Webb, “Kiribati Economic Survey.”
In the face of high climate change and disaster risks, the government of Kiribati has adopted a holistic approach, drafting the Kiribati Joint Implementation Plan for Climate Change and Disaster Risk Management (KJIP) to support adaptation and disaster response planning across multiple sectors and at the national, sectoral, and island levels.104 Note: “Kiribati Joint Implementation Plan for Climate Change and Disaster Risk Management (KJIP) 2019-2028.” Government of Kiribati The KJIP prioritizes 104 climate adaptation and disaster risk reduction actions across a 2019 to 2028 timeframe and aims to improve coordination and access to financial and technical support.105 Note: Ibid. To inform planning and implementation and fill key data gaps, the Kiribati Integrated Vulnerability Assessment (KIVA) assesses both climate and non-climate factors in a multi-sectoral vulnerability framework.106 Note: “About the KIVA & KIVA Database,” Kiribati Integrated Vulnerability Assessment, accessed May 2, 2022, https://www.kiribatiiva.net/about-the-iva–kiva-database.html. Both the KJIP and KIVA build on a long history of disaster risk management planning, including the National Disaster Risk Management Plan of 2012.107 Note: “Disaster Risk Reduction in the Republic of Kiribati,” United Nations Office for Disaster Risk Reduction – Regional Office for Asia and Pacific, 2020 Starting the following year, Kiribati has increasingly shifted from disaster risk management as the responsibility of the National Disaster Council to an all of government, and even a whole-of-country108 Note: “Kiribati Joint Implementation Plan for Climate Change and Disaster Risk Management (KJIP) 2019-2028.” Government of Kiribati approach.109 Note: “Disaster Risk Reduction in the Republic of Kiribati,” United Nations Office for Disaster Risk Reduction – Regional Office for Asia and Pacific, 2020 Kiribati has, however, been reliant on foreign external partners for funding for disaster risk management and disaster risk reduction projects, which leaves it vulnerable to shifts in donor priorities.110 Note: Ibid.
Overall concern around transparency in the government scored as a medium-high risk, which roughly accords with a study released in late 2021 by Transparency International studying corruption in ten countries and territories in the South Pacific. The study found that a little over half of Kiribati citizens believe that corruption is a big problem in government, which falls below the average.111 Note: “Global Corruption Barometer Pacific: A First for People’s Voices on Corruption,” Transparency International, November 15, 2021, accessed May 2, 2022, https://www.transparency.org/en/news/gcb-pacific-2021-survey-people-voices-corruption-bribery. However, Kiribati reported the highest rate of bribery, with nearly two-thirds of respondents reporting that they had paid a bribe in the previous 12 months.112 Note: Ibid. The country also reported the third-highest rate of vote buying, with nearly half reporting that they had been offered a bribe for their votes.113 Note: Ibid. Kiribati developed a national anti-corruption plan in 2017, and despite the high rates of bribery and vote buying, 83 percent of respondents reported trust in the government to do a good job.114 Note: David Rising, “Survey: Majority of Pacific Islanders See Corruption Problem,” ABC News, November 15, 2021, accessed May 2, 2022, https://abcnews.go.com/International/wireStory/survey-majority-pacific-islanders-corruption-problem-81191670.
High-Level Recommendations to Build Resilience
In the face of very high and growing climate risks, Kiribati has embraced a holistic and integrated approach to resilience planning. The KJIP, which is “a comprehensive plan for multi sectoral and multilevel action on climate change action and disaster risk management” is closely aligned other government plans, including the Climate Change Policy (CCP), the Kiribati Development Plan 2016-2019, and the Kiribati 20-Year Vision 2016-2036.115 Note: “Kiribati Joint Implementation Plan for Climate Change and Disaster Risk Management (KJIP) 2019-2028.” Government of Kiribati Critically, in addition to a high-level alignment, specific CCP Key National Adaptation Priorities (KNAP) have been integrated into the KJIP’s 12 major strategies.116 Note: Ibid.
Maintaining the safety and habitability in the face of numerous climate risks, particularly the cascading risks associated with sea level rise, poses an enormous task to the government and people of Tarawa. Preserving the culture, heritage, and identity of its people when combined with the economic, human, and environmental security of the island will require balancing bold, persistent innovation with an integrated and coherent approach. Testing and scaling new ideas, improvements, and taking meaningful action, while proving the effectiveness over a short timeframe will need to be constant for Tarawa’s future success and security. Such an approach depends on detailed, locally specific information which CORVI is designed to deliver to decision makers. The rapid CORVI and full CORVI assessments are developed to provide an understanding of the environmental, economic, and social dimensions of climate risks in Tarawa. This rapid assessment provides a set of high-level recommendations for the government and people of Tarawa and a full CORVI assessment would provide more specific, and targeted recommendations.
Implement Integrated Flood Management and Mitigation
As confirmed by the CORVI risk scores, Kiribati’s principal climate risk is coastal flooding coupled with coastal erosion. Managing these risks will require a combination of hard and nature-based infrastructure, strengthening the management and health of living marine resources and habitats, monitoring changes to the land, coastal and ocean ecosystems and making infrastructure improvements across the island. Hard infrastructure, such as seawalls, may be needed where immediate action is necessary and where alternative solutions are not feasible. However, hard infrastructure has drawbacks, including increasing erosion in unprotected areas, and blocking sediment deposits. Given these concerns, preserving, and restoring marine ecosystems, especially coral reefs, is a priority. Coral reefs provide natural coastal protection, reduce the power of incoming waves,117 Note: Michael Beck, “Coral Reefs Work as Nature’s Sea Walls – It Pays to Look after Them,” The Conversation, May 13, 2014, accessed May 2, 2022, https://theconversation.com/coral-reefs-work-as-natures-sea-walls-it-pays-to-look-after-them-26655. and provide the sediment to grow coral atoll islands like Tarawa.118 Note: Masselink and Kench, “Coastal Flooding Could Save Atoll Islands from Rising Seas – but Only If Their Reefs Remain Healthy.” Hybrid approaches that combine built infrastructure such as seawalls with restored or existing natural infrastructure may offer the best protection for some areas.119 Note: Ariana E. Sutton-Grier, Kateryna Wowk, and Holly Bamford, “Future of Our Coasts: The Potential for Natural and Hybrid Infrastructure to Enhance the Resilience of Our Coastal Communities, Economies and Ecosystems,” Environmental Science & Policy 51 (August 1, 2015): 137–48, https://doi.org/10.1016/j.envsci.2015.04.006. Monitoring the rates of accretion and erosion of the coast, can help inform the successful balancing between hard and natural infrastructure.
Investing in natural and built barriers will not eliminate the full flooding risk, so raising the land in certain areas may also be required. Changes to South Tarawa’s causeway, which currently blocks sedimentation deposits into the lagoon, can be considered. The Temaiku Land and Urban Development project, cited earlier, is one such example and results from the project should be closely monitored. More generally, deposited sediment can be reworked from the shoreline to interior areas, increasing Tarawa’s height at the cost of reducing its width.120 Note: Masselink and Kench, “Coastal Flooding Could Save Atoll Islands from Rising Seas – but Only If Their Reefs Remain Healthy.” The administration of Taneti Maamau has also proposed deploying dredgers to suck up sand from lagoon floors and add it to exposed island coasts, which may provide a low-cost, albeit short-term, option.121 Note: Nunn and Kumar, “Pacific People Have Been ‘Pummelled and Demeaned’ for Too Long – Now They’re Fighting Back.” Some experts have raised concerns that the sediment inside the lagoon is not the same size as sediment on exposed coasts, thereby reducing the effectiveness of this plan.
Finally, infrastructure improvements can help reduce the impact of that flooding which does occur. For example, the Kiribati Road Rehabilitation Project improved drainage on Tarawa’s roads. Additional possibilities include putting homes on stilts, though this type of intervention must be done in conjunction with other types of flood mitigation, and experts noted that many homes in Tarawa are already elevated.122 Note: Masselink and Kench, “Coastal Flooding Could Save Atoll Islands from Rising Seas – but Only If Their Reefs Remain Healthy.” Finally, experts suggested that Kiribati could explore alternative ways of collecting rainwater to mitigate the impacts of saltwater intrusion into freshwater sources. One such proposal is to use the airport runway to collect rainwater, which can then be treated and diverted to a reservoir. This kind of approach is used in the Marshall Islands.123 Note: “Protecting Drinking Water from Drought and Sea Level Rise – Marshall Islands,” ReliefWeb, June 4, 2014, accessed June 8, 2022, https://reliefweb.int/report/marshall-islands/protecting-drinking-water-drought-and-sea-level-rise.
These kinds of strategies are a key part of the government-sponsored KJIP and CCP, especially KJIP Strategies 6.1-6.3 and CCP Coastal Protection and Infrastructure KNAPs 1-4.124 Note: “Kiribati Joint Implementation Plan for Climate Change and Disaster Risk Management (KJIP) 2019-2028.” Government of Kiribati
Move Towards a Circular Economy
Although Kiribati cannot stop the seas from rising and warming, it can address the shortcomings in waste management that worsen the impact of flooding, contaminate nearshore marine habitats, and inhibit the growth of the tourist industry. The importance of improving sanitation and pollution is recognized in the KJIP and CCP, with KJIP strategy 6.4 and CCP Water Security KNAP 5 calling for improved sanitation facilities.125 Note: Ibid. Given Kiribati’s remoteness, exporting waste is unlikely to ever be viable and its small size and dependence on the blue economy make dumping the waste likewise unviable. Therefore, Kiribati should move towards a circular economy which incorporates the three Rs, to reduce, reuse and recycle all forms of waste in some way.126 Note: “Circular Economy,” United Nations Conference on Trade and Development, accessed June 9, 2022, https://unctad.org/topic/trade-and-environment/circular-economy This could include strategies such as using waste in hard infrastructure like seawalls or using it in land reclamation projects, informed by the successful and less successful examples of Osaka, Japan,127 Note: Nakamura, Youichi, “Land Reclamation with Waste and Its Use in the Port of Osaka,” 1993. https://nsgl.gso.uri.edu/scu/scuw91003/scuw91003_part3d.pdf Jakarta, Indonesia,128 Note: N.F. Barry, “The Use of Waste as Fill Material in the Land Reclamation Projects of Jakarta,” Eindhoven University of Technology, March 13, 2013, accessed May 2, 2022, https://research.tue.nl/en/studentTheses/the-use-of-waste-as-fill-material-in-the-land-reclamation-project. and Singapore.129 Note: Lin Guo and Dong-Qing Wu, “Study of Recycling Singapore Solid Waste as Land Reclamation Filling Material,” Sustainable Environment Research 27, no. 1 (January 1, 2017): 1–6, https://doi.org/10.1016/j.serj.2016.10.003. In order to use waste products more efficiently – and to reduce environmental contamination – Tarawa must establish improved waste collection processes. This should include community education together with public and private waste collection services.130 Note: Chidi Nzeadibe et al., “Informal Waste Management in Lagos Is Big Business: Policies Need to Support the Trade,” The Conversation, January 13, 2021, accessed May 2, 2022, https://theconversation.com/informal-waste-management-in-lagos-is-big-business-policies-need-to-support-the-trade-151583. Efforts to improve waste management should also build on the work done under ISLANDS Pacific, a 14-nation initiative aiming to reduce the harms associated with marine debris, waste, and overall pollution and which is funded in part by the Global Environment Facility.131 Note: “Fourteen Pacific Island Nations Make Major Strides towards a Cleaner Pacific,” Global Environment Facility, March 9, 2022, accessed May 2, 2022, https://www.thegef.org/newsroom/press-releases/fourteen-pacific-island-nations-make-major-strides-towards-cleaner-pacific.
Diversify Kiribati’s Economy
Strengthening climate resilience in Tarawa is dependent on the material and technical resources that Kiribati can mobilize. While international partners can provide support, internal economic growth is also needed to improve the financial stability of the nation. Although Kiribati has seen faster economic growth, and rapid expansion of the government’s budget in recent years, this growth is almost entirely dependent on revenues from offshore foreign commercial fishing licenses for tuna fishing, particularly skipjack tuna, which faces significant risks from climate change. Taking further steps to improve the health of tuna fisheries is important to the future sustainability of the fishery and the revenues it generates. However, Kiribati can gain social and economic benefits by further diversifying the economy and using its natural and human capital more effectively.
Experts noted that Kiribati currently captures only a small part of the value chain for tuna, despite the success that the country has had in increasing revenue from that sector. One way to increase the value Kiribati earns from the sector is to increase fish processing on Tarawa, which is currently done almost entirely in other countries. However, fish processing plants are water intensive, and Kiribati currently has very limited freshwater supplies. The completion of the desalination facility currently under construction may partially alleviate this supply constraint. Kiribati could also explore alternative fish processing ideas, building on the trainings on manufacturing tuna products provided as part of the FishFAD project supported by the Food and Agriculture Organization.132 Note: “New initiative develops tuna products in Pacific Island countries,” FAO Regional Office for Asia and the Pacific, September 30, 2020, accessed on June 9, 2022. https://www.fao.org/asiapacific/news/detail-events/en/c/1310782/
Developing sustainable coastal tourism could leverage Kiribati’s wealth of natural resources, reduce unemployment, and increase tax revenues while preserving and enhancing Kiribati’s natural and cultural heritage. The coastal tourism industry comprised 5% of global GDP, and almost 7% of global employment in 2019.133 Note: Anowar Hossain Bhuiyan, Abud Darda, Wahidul Habib, and Belal Hossain, “Marine Tourism for Sustainable Development in Cox’s Bazar, Bangladesh,” Asian Development Bank Institute, June 2020, accessed May 12, 2022, https://www.adb.org/publications/marine-tourism-sustainable-development-cox-bazar-bangladesh The economic impacts of these tourism dollars reach far beyond the shoreline. For instance, direct spending on coral reef activities (i.e., snorkeling and diving) has been estimated at $19 billion per year and an additional $16 billion per year has been linked to “reef-adjacent” tourism, including ‘the role of reefs in generating clear calm waters and beach sand, outstanding views, fresh seafood and even their widespread use in advertising.134 Note: Mark Spalding, et. al., “Mapping the global value and distribution of coral reef tourism” Marine Policy, Volume 82, August 2017, https://doi.org/10.1016/j.marpol.2017.05.014 Kiribati could also leverage the central role of fisheries in its culture and environment to attract specific tourist niches. Recreational fishing is a major tourism activity,135 Note: C. Michael Hall, “Tourism and Fishing,” Scandinavian Journal of Hospitality and Tourism Volume 21, Issue 4, July 28, 2021, https://doi.org/10.1080/15022250.2021.1955739. and fishery-based ecotourism can provide a source of income while enhancing ecological resilience.
Sustainable coastal tourism, which features centrally in the 20-Year Vision, would require improvements to basic infrastructure, including waste, water, roads, energy, transportation, sanitation, and education, which will also have co-benefits for population health and climate resilience. These should occur ahead of, or alongside, industry-specific measures like investing in hotels, marketing campaigns, and a national airline, which otherwise may absorb large amounts of resources with little return.136 Note: James Webb, “Preparing to Graduate Issues Challenges and Strategies for Kiribati’s LDC Graduation.” Experts also emphasized that these kinds of improvements to basic infrastructure will facilitate the growth of other economic activity, including from the private sector.
The Kiribati government can also explore ways to earn income for the ecosystem services provided by its national waters. Although the government opened the Phoenix Islands Protected Area (PIPA) to fishing, payments for ecosystem services (PES) can still play a useful role. Updating the quantification of those ecosystem services could facilitate the process of finding a funder for a PES project. The government of Kiribati could also consider alternative funding structures, such as blue bonds.
Kiribati can also better harness its human capital by investing in green innovation and entrepreneurs with a focus on climate adaptation planning, renewable energy technology, and solid waste management, all identified as high-risk areas in this assessment. Experts highlighted ocean thermal energy conversion (OTEC) as one area Kiribati could explore. OTEC systems produce electricity by exploiting the temperature differences between ocean surface waters and deep ocean waters.137 Note: “Hydropower explained: Ocean thermal energy conversion,” U.S. Energy Information Association, accessed June 9, 2022, https://www.eia.gov/energyexplained/hydropower/ocean-thermal-energy-conversion.php. OTEC systems are in the planning and development stages in several countries, principally to supply electricity and desalinated water to island communities. OTEC could offer a way of increasing renewable energy without the intermittency challenges associated with solar energy. It could be a way to help mitigate Tarawa’s freshwater challenges, especially in conjunction with the new desalination facility currently under construction.138 Note: Mohammad Muslem Uddin et al., “Fishery-Based Ecotourism in Developing Countries Can Enhance the Social-Ecological Resilience of Coastal Fishers—A Case Study of Bangladesh,” Water 13, no. 3 (January 25, 2021), https://doi.org/10.3390/w13030292. Green innovation could build on efforts like the Pacific Green Entrepreneurs Network, which supports green and inclusive job growth through sustainable entrepreneurship (particularly focused on women and youth), and climate adaptation engineering concepts such as those identified in the Temaiku Land and Urban Development project. A focus on climate adaptation planning and renewable energy technology may also improve access to international climate finance vehicles such as the Green Climate Fund.
Gaps and Limitations
The key area of climate risk that requires further investigation, based on the conversations with experts that took place during this rapid assessment is public health. The rapid assessment did include an indicator related to vector-borne diseases, which was scored as a medium-high risk, and did briefly note the potential public health implications of rising sea surface temperatures. However, experts stressed that health challenges are cross-cutting on Tarawa and are linked to issues of water quality and quantity, infectious diseases, and food quantity, all of which are related to climate risk. A full CORVI assessment would provide the opportunity for a greater level of detail on public health vulnerability in Tarawa, including the CORVI indicator on access to healthcare.
Appendix 1: Surveyed Organizations
Expert surveys were submitted by individuals from these organizations. 66 surveys were collected for the Tarawa rapid assessment.
[table “” not found /]Appendix 2: The Climate and Ocean Risk Vulnerability Index
It is clear that urban coastal areas are likely to experience the earliest onset and potentially most severe impacts from climate change. The risks associated with climate change for specific coastal cities, however, are much more difficult to untangle. In order for coastal cities to efficiently allocate resources and enact effective adaptation strategies, it is critical that they understand their multidimensional climate risk. However, these efforts are impeded by poor and incomplete data.139 Note: Hunt, Alistair, and Paul Watkiss. “Climate change impacts and adaptation in cities: a review of the literature.” Climatic change 104, no. 1 (2011): 13-49. Data on climate risks is rarely available at the city level, and when it does exist, it is often poorly managed and stored in silos that make it difficult to access and use, even for city government officials.140 Note: Hardoy, Jorgelina, and Gustavo Pandiella. “Urban poverty and vulnerability to climate change in Latin America.” Environment and Urbanization 21, no. 1 (2009): 203-224. This issue is compounded by technical, financial, and capacity gaps, trapping coastal cities in a vicious cycle where they cannot develop holistic strategies to prioritize investment and access the funds needed to implement resilience actions.
Without data at the appropriate geographic scale, decision-makers are often left with the choice of either waiting for greater data availability, or attempting to downscale national level data, neither of which are ideal solutions for effective climate change adaptation. This problem is particularly acute in small and intermediate cities, which along with absorbing the bulk of East Africa’s future urban population growth, often lack the resources to gather and maintain necessary data.141 Note: “Demographic Trends and Urbanization,” World Bank, last modified May 19, 2021. Accessed August 16, 2021. https://www.worldbank.org/en/topic/urbandevelopment/publication/demographic-trends-and-urbanization.
Despite these challenges, decision makers need to act now in the face of uncertainty to build resilience to the climate crisis. To do this, they need tools that will enable them to consider multidimensional climate risks, develop cohesive strategies, and utilize this information to unlock additional climate finance and implement resilience actions.
In response, the Stimson Center developed the Climate and Ocean Risk Vulnerability Index (CORVI). CORVI is a decision support tool which compares a diverse range of climate-related risks across the land-seascape to produce a coastal city risk profile.142 Note: Stuart, J and Sally Yozell, 2020, CORVI: Understanding and measuring climate risk, A guide to the Climate and Ocean Risk Vulnerability Index, The Stimson Center, Environmental Security Program. Accessed August 16, 2021. https://stimson.org/2020/corvi-understanding-and-measuring-climate-risk/. These risks are displayed across 10 categories, grouped under three risk areas: ecological, financial, and political (see figure 2). The 10 categories are in turn made up of close to 100 indicators, covering a range of issues including the vulnerability of vital infrastructure, the health of marine ecosystems, and urbanization dynamics in the chosen coastal city. Each indicator and category are scored using a 1-10 risk scale relative to other cities in the region, offering a simple reference point for decision-makers looking to pinpoint and categorize climate risks. The CORVI risk scores, which form the basis of a coastal city risk profile, are augmented with existing academic and grey literature, government documents, and key informant interviews to develop a comprehensive narrative and understanding of the coastal city’s climate risks and identify priority policy recommendations.
CORVI was successfully piloted in the coastal cities of Castries, Saint Lucia and Kingston, Jamaica. These first two CORVI city assessments demonstrated the value of CORVI’s holistic approach in helping leaders and decision makers prioritize actions and smart investments for risk reduction in coastal cities. Despite the challenges posed by COVID0-19, data and recommendations from both risk profiles are beginning to be incorporated into urban resilience planning.
How CORVI is different
CORVI builds on the work of previous indices but is distinct in three ways.
- City-Based: Unlike many other indices which tend to focus on the national level, CORVI is city based, providing sub-national level detail on the nature and impact of climate and ocean risks. This focus is based on extensive interviews with potential issuers of the CORVI tool, who noted the difficulty of down-scaling national level risk and vulnerability data to inform policy action to build climate resilience in specific communities.
- Holistic: CORVI looks across a broad set of ecological, financial, and political risk factors connected to climate change impacts and that influence vulnerability of coastal cities and their residents. As part of the category and indicator selection process, indicator inclusion was primarily based on its ability to capture and explain climate change risks in coastal cities, and not if data was available. This approach promotes a holistic understanding of climate change impacts to coastal cities.
- Data Driven: Through utilising SEJ, CORVI is suited to producing actionable insights in data sparse environments. By combining empirical and survey data across a wide range of indicators, CORVI fills data gaps to provide a holistic assessment, while reducing data availability bias. This approach provides a contextual and data driven assessment of climate and ocean risk vulnerability.


Advancing the Sustainable Development Goals
CORVI also aims to contribute to the delivery of the SDGs – an essential framework to guide lasting, positive change. By providing data and information to measure climate risks in coastal cities, this project supports the delivery of the following SDGs:

Completed & Ongoing Assessments
In collaboration with a wide range of on-the-ground research institutions, with the support of different levels of governments, eight additional CORVI coastal city assessments are now underway across the globe. In addition to providing decision makers in the specific city with a complete risk picture, each risk profile is also added to a global database, to improve understanding of regional risk dynamics.
Rapid Assessments Completed
- Tarawa, Kiribati
- Southwestern Urban Corridor, Barbados
- Western Province, Sri Lanka
Assessments completed
- Castries, St. Lucia
- Dar es Salaam, Tanzania
- Kingston, Jamaica
- Mombasa, Kenya
- Suva, Fiji
Assessments underway
- Basseterre, St. Kitts and Nevis
- Chattogram, Bangladesh
- Dagupan, Philippines
Indicators
To ensure that the CORVI indicator scores provide a holistic risk rating, each is made up of five factors: current, past, and expected trends, the rate of change of the risk, and the impact of this risk on the coastal city.
- BASELINE measures the current level of risk for each indicator relative to other coastal cities in the region. Baseline data for economic and social indicators is derived from the most recent year of complete data. Climate indicators use a longer time period of 15 years.143 Note: 30-year time horizons are traditionally used to calculate the seasonal cycle and other long-term averages of climate variables. However, as the climate changes, current conditions are more dissimilar to those from 30 years ago than they are from 10 years ago. In this environment, the optimum climate normals (OCN) method can be used to calculate the minimum number of years required to accurately produce the climatological average for climate variables. The National Oceanic and Atmospheric Administration suggests that a 10-year time series for temperature and a 15-year time series for precipitation are acceptable minimum limits to produce accurate climatology within a non-stationary period. CORVI follows the same limits that NOAA uses in their experimental seasonal forecast product by using a similar 15-year time horizon to measure climate indicators. For more information on OCN, see Wilks 2013.
- PAST TREND assesses the trend of risk for the past 10 years, measured from the baseline year. The only exception to the 10-year trend measure are the climate indicators, which use a 15-year trend horizon to account for slow onset changes.
- EXPECTED TREND assesses the anticipated trend of risk in the next 10 years, measured from the baseline year. The only exception to the 10-year trend measure are the climate indicators, which use a 15-year trend horizon to account for slow onset changes.
- MAGNITUDE assesses the degree of expected future trend change relative to other cities in the region. Change that happens quicker than expected is assumed to increase risk when compared to changes that take place over a longer time scale. This assumes that longer time periods of change contribute to less risk, as decision makers have more time to adapt and build resilience.
- IMPACT assesses the importance of change for each indicator in describing future risk in the coastal city.

Data Collection and Structured Expert Judgement
To overcome data gaps, CORVI employs structured expert surveys to collect data that is otherwise unavailable. This primary data is combined with secondary data using the approach of structured expert judgement (SEJ) to produce a comparative score for each indicator in the assessment.144 Note: For an introduction to structured expert judgement, see Cherie Maestas, “Expert Surveys as a Measurement Tool: Challenges and New Frontiers,” in Lonna Rae Atkeson and R. Michael Alvarez (eds) The Oxford Handbook of Polling and Survey Methods (Oxford: Oxford University Press, 2018). SEJ is a well-established social science technique that seeks to quantify risk when pre-existing secondary data is inadequate. Through interviews and surveys, as well as a series of weighting procedures to ensure data is representative, SEJ allows researchers to quantify topics that might otherwise be challenging to study in such a systematic fashion.
To apply SEJ to CORVI, subject matter experts across academia, government, civil society, and the private sector are identified through research and extensive outreach to stakeholders in the target coastal cities. These experts then refer the project team to other experts and stakeholders with appropriate expertise using “snowball sampling.”145 Note: Snowball sampling or chain-referral sampling is a non-probability sampling technique used when samples have traits that are difficult to find. In this sampling technique, existing subjects provide referrals to recruit additional subjects required for a research study. To guard against confirmation bias, survey answers are compared to a regional secondary empirical dataset to weigh the expert responses by utilizing a coherence check.146 Note: Abigail Colson and Roger Cooke, “Expert Elicitation: Using the Classical Model to Validate Experts’ Judgements,” Review of Environmental Economics and Policy 12, no. 1 (2018): 113-132. This ensures that experts whose answers do not match secondary data are not weighed as highly as those who do.
This approach has several strengths. First, CORVI incorporates the views of subject matter experts and local stakeholders at each stage of its implementation. This allows the final product to better reflect the specific context which it is seeking to measure and provide more focused information for end users. Second, pairing primary survey data with secondary data through SEJ also allows CORVI to provide insight into risks relating to urban coastal environments that existing secondary datasets do not cover. While the use of SEJ allows CORVI to assess a diverse range of risks, it should not be regarded as a substitute for empirical data collection. Rather, SEJ is best viewed as an alternative research technique specialized to analyzing topics with significant data gaps.147 Note: 4 Kunreuther H., S. Gupta, V. Bosetti, R. Cooke, V. Dutt, M. Ha-Duong, H. Held, J. Llanes-Regueiro, A. Patt, E. Shittu, and E. Weber, 2014: Integrated Risk and Uncertainty Assessment of Climate Change Response Policies. In: Climate Change 2014: Mitigation of Climate Change. Contribution of Working Group III to the Fifth Assessment Report of the Intergovernmental Panel on Climate Change [Edenhofer, O., R. Pichs-Madruga, Y. Sokona, E. Farahani, S. Kadner, K. Seyboth, A. Adler, I. Baum, S. Brunner, P. Eickemeier, B. Kriemann, J. Savolainen, S. Schlömer, C. von Stechow, T. Zwickel and J.C. Minx (eds.)]. Cambridge University Press, Cambridge, United Kingdom and New York, NY, USA.
Acknowledgments
This project was supported by the Ocean Risk and Resilience Action Alliance (ORRAA) and was funded with UK aid from the UK government.


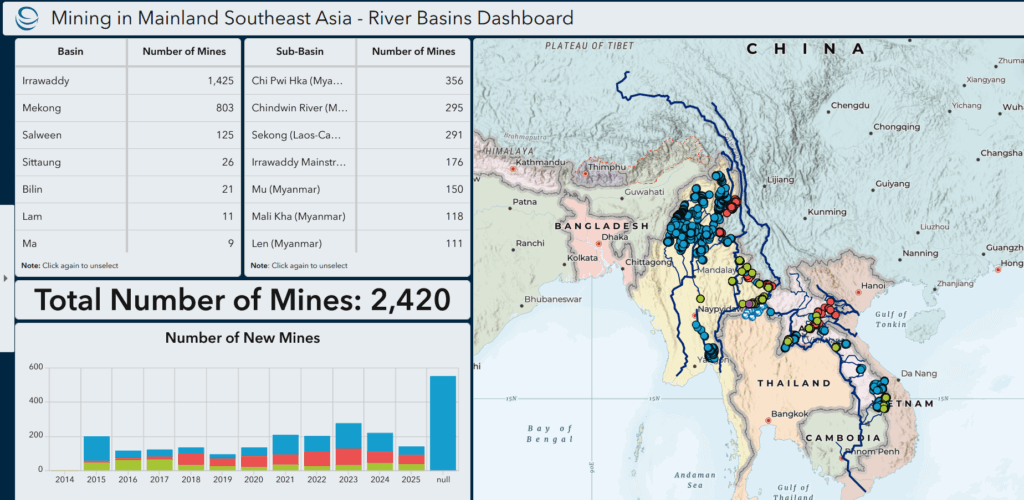


Community Adaptation for a Water Festival Without Clean Water