Introduction
The Mekong Deforestation App is a mapping and reporting tool that tracks forest loss in the Mekong region with focus on forest loss in relation to infrastructure projects catalogued in the Mekong Infrastructure Tracker’s infrastructure geodatabase. For example, users can select a hydropower plant’s reservoir and summarize its surroundings (in hectare) for forest loss and intact forest as far back as 2001. The App’s data is derived from the publicly available Global Forest Change dataset- a collaboration between the Global Land Analysis & Discover Lab at the University of Maryland, Google, USGS, and NASA- and has been cleaned and processed for the Mekong Deforestation App. Through this tool, the Stimson Center hopes to widen accessibility to GIS research methods and data transparency, provide robust analysis to strengthen ESG standards, and mitigate further risks from project developments.
Video Tutorial
Walkthrough
This document will provide a detailed walkthrough on how to use the Mekong Deforestation App. For additional information or questions, users may visit the FAQ page or contact the Mekong Infrastructure Tracker’s support team at [email protected].
Front page functionalities

Users access the Mekong Infrastructure Tracker’s Mekong Deforestation App and other interactive tools from the Mekong Infrastructure Tracker Project page. Clicking on the tool will launch the Mekong Deforestation App as shown above. The default view is focused on the Greater Mekong Subregion and the current state of intact forest cover and forest loss as of 2020. Users may interact with the tool by moving the map (left-clicking the map and dragging with your mouse) and zooming in and out (scrolling the mouse wheel or double left-clicking the map).

The Mekong Deforestation App’s widgets are broadly divided into three sections. The first section in the title bar allows users to toggle data layers on and off (which is required for selecting infrastructure projects) and display a legend of activated map layers. The second section contains widgets that interact with the data including data filters and the deforestation widget. The third section contains basic map functions like the zoom slider and a return-to-home view.

Users can toggle layers using the layer list widget in the title bar. Selecting the layer list icon will open a dropdown list of available layers. By default, the forest loss and tree cover layers are toggled on, and in the example above the power generation data layer is toggled on. Toggling on infrastructure layers is a mandatory step in using the Mekong Deforestation App.
Deforestation widgets

The first deforestation widget provides a shortened walkthrough on how to use the tool, with the order of steps to be taken to properly use it.

The second widget is the deforestation calculator widget. This is the main widget of the Mekong Deforestation App that calculates the area of forest change because of deforestation over the past twenty years at and/or near infrastructure project development.

The third widget is the infrastructure layer filter. Users can toggle filters on and off before running the deforestation widget to narrow the focus on the tool to one particular infrastructure project of interest or several projects based on certain indicators like project type or the country it belongs in.

The final deforestation widget is the forest layer filter. First, this widget allows users to visualize the extent of forest cover in 2000 based on percentage classes that are binned in intervals of five percent each. These layers show the area in which each 30 m² cell contains vegetation that is greater than 5 meters in height for at least the classified percentage of the cell. In other words, the 2000 forest cover layer with a percentage class of 90 means the layer will only show forested land if the cell contains at least 90% with vegetation greater than 5 meters in height. A percentage class of 5 means the layer will only show forested land if the cell contains at least 90% with vegetation greater than 5 meters in height. This means a layer set at 90% will have less forested land than a layer set at 5% because the threshold is higher at the 90% class.
The second filter allows users to select the year(s) forest loss was detected. Users may select one year by inputting the same year in the first and second fill-in boxes or the enter dataset by inputting 2001 for the beginning and 2020 for the end.
Deforestation Calculator Widget

The deforestation calculator is the main widget of the Mekong Deforestation App. It calculates the area of deforested land over the past twenty years and the area of intact forest as of 2020. There are several inputs users must include before the tool can run properly and to the user’s specifications.

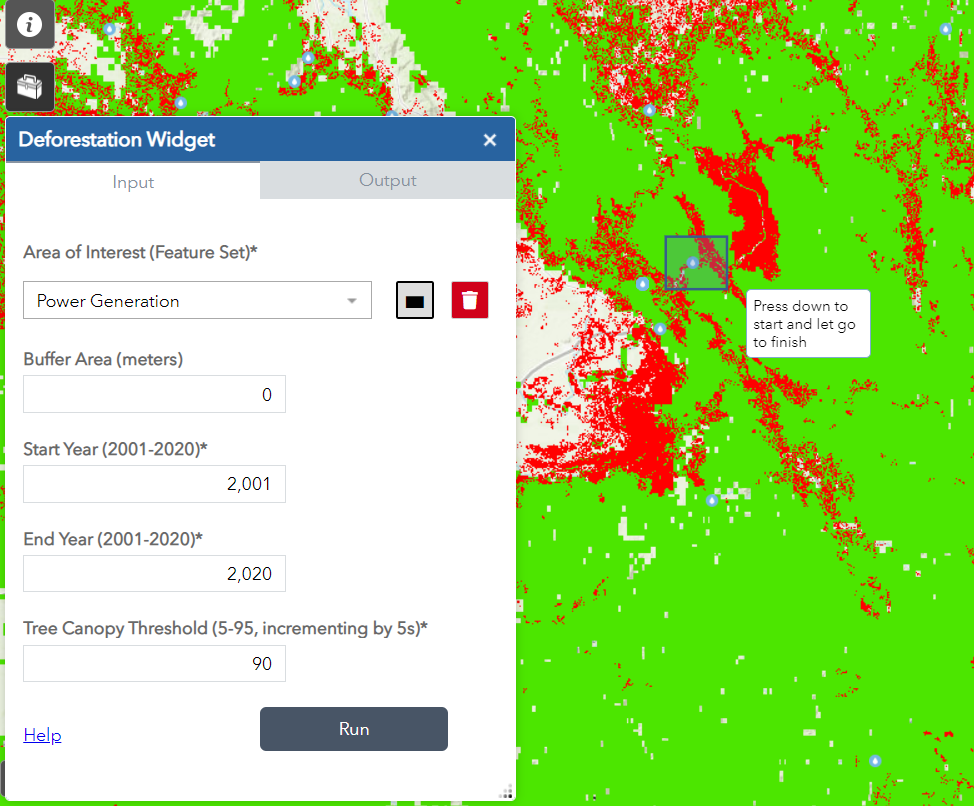
First, users must select the infrastructure layer of interest. Remember: the infrastructure layer must be turned on first for the deforestation calculator to work. In the example above, power generation is already toggled on and selecting that layer will make two icons appear. The first is the feature selection tool and the second tool clears the selection. The feature selection tool captures all the features the user wants to examine.

Using the feature selection tool, users select the infrastructure project(s) of interest. Once selected, the project feature will be highlighted.

Next, the user may include a buffer around the project of interest. This is an optional setting for this widget, however a good rule of thumb is to buffer projects that are points (power generation) or lines (transportation and transmission lines) while keeping shapes (industrial zones and reservoirs) unbuffered. Points and lines without buffers may result in an error as the tool cannot calculate deforested values. In the example above, the project is a point so a buffer of 2,000 meters was created. Next, we can select the start and end years for calculating deforestation and the tree canopy threshold. After the user has configured the widget to their desire, the user can run the tool.

After the tool finish processing and calculating the data, a shape of the calculated area will appear on the map (shown above as a circle with a radius of 2,000 meters) and the output tab on the deforestation calculator will include the results and a link. Clicking the link will download the results as a CSV file.

To view the data in the tool, users may click on the ellipsis which drops a list of options down. Selecting the last option, “View in Attribute Table”, will open a table at the bottom of the tool.

To find the calculations, users will need to scroll to the right until columns named Forest_Loss and IntactForest are in view. Forest loss is shown in yearly values, with the years included in the column names, and intact forest represents the current area of forested land as of 2020. All values are in hectares.
To reset or use the tool again, users can clear the selection or toggle on other infrastructure layers and run the tool again by following the same steps listed above.
How-to example
In this example, we will track forest change in relation to infrastructure development of Xe Kaman 1, a hydropower project in Southern Laos that became operational in 2016. As a researcher or potential project stakeholder, you may be interested in understanding current and past environmental impacts because of infrastructure development. Conducting robust analyses and gathering relevant data and information can help provide more opportunities to mitigate negative socioeconomic and environmental impacts which strengthens capacity to implement stronger ESG standards in infrastructure project development.

First, we need to turn on the infrastructure layer to be examined. We want to track land cover change in relation to the creation of the Xe Kaman 1 reservoir, so it is best to use the reservoirs data layer.

Next, we want to filter the data to only display the Xe Kaman 1 reservoir. Open the infrastructure layer filter, toggle on the reservoirs layer filter and type in the name of the dam and check the box for the reservoir. Once you’ve selected the reservoir, the map will zoom in to the reservoir as shown above.

Once we have filtered the reservoirs dataset and have zoomed into the project, open the deforestation calculator, select the reservoirs dataset and use the feature select tool to select the Xe Kaman 1 reservoir shape. Since this is the shape of the reservoir, we do not need to create a buffer and we will leave the rest of the default inputs. For further practice, we can show a lower tree canopy threshold and see how that changes the results. Once the reservoir is selected, run the calculator.

Once the calculations are finished, open the results in the attribute table and scroll until the results appear. Starting from the beginning of the dataset, we notice forest loss was minimal- a few dozen hectares lost per year up until 2014. Remembering that this dam became operational in 2016 and assuming construction took about 2-3 years, it makes sense that deforestation as part of the construction process and water impoundment occurred in the years before the dam was operational. Looking at the data, we see a spike in forest loss in 2014 which peaked in 2015 and 2016. By 2019, the amount of forest cover lost lowered to pre-2014 levels as the maximum reservoir level was reached and forest loss plateaued.


Current Geopolitics Shift Deep-Sea Mining Debates