Executive Summary and Policy Brief
This report provides an overview and analysis of how dam operations changed Mekong River flow conditions from the 2022 wet season (June-November) through the 2023 dry season (December 2022-May 2023) in comparison to previous years. To inform this analysis, the Mekong Dam Monitor (MDM) team synthesizes information derived from satellite observations with data provided by the Mekong River Commission (MRC). This report also summarizes new lines of research conducted throughout the last year by the MDM team, namely an exploration of drivers of the Tonle Sap Lake Expansion in Cambodia and a historical analysis of how dams in the Sekong, Sesan, and Srepok (3S) tributary rivers are changing flows in the 3S Basin and the Mekong mainstream at large. Regional stakeholders have achieved several key developments related to data sharing and transboundary water management within the last year, in some cases with the support of the MDM’s publicly available data and analysis. These are summarized below and are followed by key findings and policy recommendations. The full report also overviews recent updates to the MDM platform, annual activities, and media footprint. Finally, the content of this report represents the independent research and analysis of the authors of this study.
Key Developments
- As a result of dialogue with the Mekong River Commission, China has pledged to share dam operations data with the MRC by the end of 2023.
- China now shares data at 12-hour intervals for its Jinghong and Man’an gauges. This is an improvement on the previous update interval of every 24 hours which improves the ability to monitor sudden and unannounced changes to dam operations in China and provide downstream communities with more time to adapt.
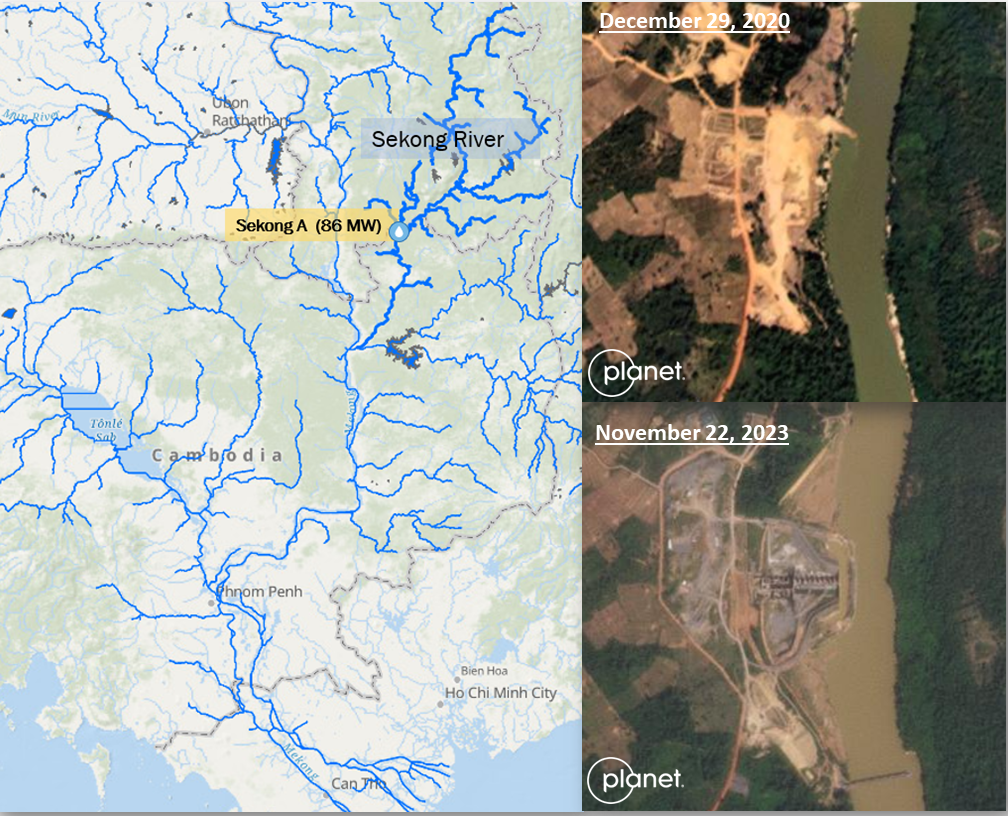
- The MRC is conducting its first ever Transboundary Environmental Impact Assessment (TbEIA) on a tributary dam – the Vietnamese-owned Sekong A Dam in southern Laos. The dam will deliver severe transboundary impacts to the Mekong fishery, and the MRC has stated that the TbEIA will improve the dam design. The dam began construction in December 2020, and Lao PDR was not adhering to the notification protocols required by the 1995 Mekong Agreement until it notified the MRC of the dam’s construction in August 2022.
Summary of Key Findings and Recommendations
Dam Impacts and Climate Change
So much of what makes the Mekong unique, from being the world’s largest freshwater fishery to its robust agricultural production to its incredible biodiversity, relies on the extreme highs and lows of its annual flood pulse. Since its launch in December 2020, the Mekong Dam Monitor has consistently published evidence that the largest storage dams in the Mekong Basin refill their reservoirs during the wet season and release water from reservoirs during the dry season for hydropower production. The effect of these operations is a reduction of the benefits provided by the floodpulse. As a general rule, dam restrictions reduce the wet season peaks, and dam releases increase the level of the river during the dry season much higher than what natural flow would provide. Over time this flattening of the floodpulse will bring significant reductions to the Mekong’s massive fish population and reduce the opportunity for floodplain agriculture, particularly in Cambodia and Vietnam.
Much of the Mekong Basin has experienced increased variability in rainfall during recent wet seasons in recent years. The MRC has established that the wet seasons of 2019-2021 were anomalously dry. The MRC’s joint study with China also more generally explores the interactions of dam operations and climate, albeit with inconclusive results. Our study results provide particular insight into how dam operations are flattening the floodpulse at the same time as new climate patterns are affecting the basin. Data in this study also suggests that even as the wet season months of June through September have been drier than normal, the largest dams in the Mekong still tend to restrict more water to refill reservoirs during these months compared to other months, and this significantly exacerbates the climate effect on river flow. For example, in September 2021 the river flow at Stung Treng, Cambodia would have been 26% below normal as a result of a lack of rain, but that was reduced to 39% below normal when exacerbated by the operations of 55 upstream dams. Low flows during the wet season severely impact fishery and agricultural outcomes throughout the Mekong Basin upon which tens of millions rely for their livelihood.
Additionally, climate variability is not constant throughout the entirety of the Mekong Basin. The data shows periods when downstream countries experience severe wet season drought while the upstream in China does not. This was the case in 2020, when Mekong annual flow hit an all-time low and yet average rainfall in China’s portion of the Mekong created conditions for dams there to restrict the maximum amount of water, significantly exacerbating the severe wet season drought downstream.
Improved basin-wide seasonal and monthly weather forecasting and better communication between upstream and downstream countries about mitigating the impacts of dams during times of crisis can help avoid exacerbating an already bad situation.
For the dry season, the evidence clearly points to dams being the major driver to changes in flow regime, causing much higher-than-normal flow volumes even far downstream. The data shows the dams with the largest reservoir storage release water during the dry season for hydropower production. During certain dry season months, cumulative dam releases can nearly double the flow of the river at Stung Treng, Cambodia. Dam releases are shifting the dry season low point to be one month earlier than normal at gauges along the entire course of the Mekong mainstream. High water volumes in the dry season are causing unknown levels of ecological and socio-economic impacts. The most obvious dry season impacts can be observed in Cambodia’s flooded forest between the Lao border and Stung Treng, where a massive tree die-off has occurred in recent years as a result of much higher river levels.
However, climate effects from the wet season also carry over into the dry season. This is discussed further below, but data shows that when the wet season precipitation is anomalously low in parts of the basin then dams in these parts of the basin restrict less water due to a lack of water availability. Consequently during the dry season these dams release less water for hydropower production, and this creates significant variability in dry season river levels from year to year.
Climate variability also impacts the revenue generated by hydropower dams, making a strong case for less vulnerable alternative renewable power generation options. Dry season impacts of dams and climate must be further studied and quantified in order to understand their effects and identify potential mitigation pathways.
The largest monthly dam impacts consistently come from two dams in China (Xiaowan and Nuozhadu) which together hold about 50% of the active storage in the Mekong Basin. The impacts of these dams are most profound at the communities closest to them such as Chiang Saen, Thailand, where China’s dams reduced wet season flow by 62% in September 2021 and have tripled river flow several times in certain months of the dry season. However, the impacts of large dams in Laos located on tributaries which enter the river between Vientiane, Laos and Nakhon Phanom, Thailand can at times be equally large. These dams can reduce total Mekong flow at Nakhon Phanom by 20% in the wet season and increase flow by as much as 60% in the dry season. Further downstream at Stung Treng, the impacts of 20 dams in the 3S Basin combine with those of upstream dams in China, Laos, and Thailand to further alter seasonal flow patterns. While the 3S dams in general are less impactful than other groupings of dams, they can increase dry season flow by 30%.
Finally, while dams can deliver profound impacts to the Mekong flow regime, wet season droughts can also reduce the impacts of the largest dams. For example, a 2022 wet season drought in China significantly limited the ability of the largest reservoirs to fill to their full capacity. The MDM team monitored this development in real-time and communicated to downstream communities and governments that China’s 2023 dry season releases would be less impactful than previous years since the dams had less water to release for hydropower production. Our prediction was later confirmed both via 2023 dry season data as well as confirmations from downstream communities that a somewhat normal river flow pattern in the 2023 dry season facilitated many cultural, economic, and ecological benefits.
To reduce the impacts that dams deliver to seasonal flow regimes and thus maximize downstream fishery productivity and agricultural production, minimum and maximum flow thresholds for seasonal storage dams should be determined. If a robust floodpulse is to persist, acceptable limits for flow alteration to the Mekong mainstream at the monthly and seasonal levels should be determined and agreed upon prior to the buildout of new tributary or mainstream dams. Finally, climate interactions with dam impacts and river flow are complex, and much is unknown about the interaction of these effects on the Mekong’s ecology and socio-economic outcomes. More study is required to understand these interactions and impacts. A misunderstanding of these interactions and impacts can lead to ineffective solutions.
Early Warning Alerts and Hydropeaking
Between June 2022 and May 2023, the MDM team issued 20 alerts when China’s upstream dams released or restricted enough water to cause a 0.50 meter or higher rise or fall in river level within a 24-hour period at Chiang Saen, Thailand. Alerts are issued to national governments, the MRC, and tens of thousands of people living in affected communities via social media. During a July 2022 visit to Chiang Saen, local community people who receive the alerts confirmed that these alerts helped protect their assets, namely boats which had previously been washed away during sudden releases of water.
These sudden rises and falls in river level come mostly from hydropeaking, which is a method of operating a dam which restricts water at points of low electricity demand in order to then generate electricity and release water when demand is high. This causes the river level to fluctuate erratically and often significantly throughout the day, which is extremely damaging to aquatic habitats and riverine ecologies. In the worst cases, sudden releases of water can cause flash flooding downstream. Communities along the Thai-Lao border have had to cope with the effects of China’s hydropeaking operations for more than a decade. This study also shows how hydropeaking operations by upstream dam operators on Vietnam’s portion of the Sesan and Srepok Rivers have caused similar issues downstream in Cambodia.
Dam operators throughout the basin should avoid sudden releases or restrictions in flow which cause severe downstream fluctuations and also reduce hydropeaking practices.
Smarter dam management can avoid these impacts. In cases where sudden releases and restrictions are necessary for dam safety or other reasons, dam operators should provide early warning days in advance to relevant authorities and communities in the downstream so that vulnerable people have time to prepare. Local authorities should create clear processes for notification and require compliance by dam operators.
Tonle Sap Expansion
The Tonle Sap Lake is often called the beating heart of the Mekong Basin. During normal wet season conditions, it expands to five times its dry season area and sixty times its dry season volume of water. This expansion is mostly driven by the Mekong floodpulse bringing higher river levels throughout the Mekong mainstream, causing the famous “Tonle Sap Reversal” where the river which traditionally flows out of the Tonle Sap reverses direction. This reversal sends water from the Mekong into the Tonle Sap, and transported with that water are fish eggs and larvae which find a rich habitat inside the Tonle Sap Lake where the fish feed and grow. As the lake contracts in the dry season and drains back into the Mekong system, migratory fish move upstream into tributaries in Cambodia, Laos, Vietnam, and Thailand and water and sediment flow downstream to nourish the Mekong Delta. This process makes the Mekong Basin account for 20% of the world’s freshwater fish catch. The fish catch in Cambodia alone is responsible for 60-70% of the national population’s animal protein intake.
Data in this report shows that the Tonle Sap Expansion has varied significantly between 2018-2022. Evidence suggests the timing of peak expansion is shifting from September to October, and during 2019, 2020, and 2021, the expansion reached sub-normal levels with the weakest expansion occurring in 2019 at around 58% of normal. However the data also shows that the Tonle Sap can expand within its normal range despite ongoing impacts of wet season dam restrictions, as seen in 2018 and 2022. With dam impacts however, fish larvae and sediment transport into the lake is severely reduced. Importantly, the data also shows that the Tonle Sap Reversal might not always be the most critical driver of the Tonle Sap Expansion. MRC data showed that in 2022, reverse flow was the lowest in 30 years of record keeping—and yet the Tonle Sap expanded to normal levels that year. Our modeling in this report suggests rainfall over the Tonle Sap Lake is enough to drive a normal expansion if the Mekong mainstream can sustain certain water level conditions throughout the wet season.
This highlights a need to prioritize the conservation of the Tonle Sap Watershed.
More study is needed to determine the importance of Tonle Sap tributary contributions to the wet season expansion process, particularly during wet seasons with low flow in the mainstream. The Tonle Sap’s tributaries are both understudied and being exploited at an alarming rate by the construction of small and medium-sized dams and irrigation canals.
Further, it is important to reduce restrictions at large upstream dams during July and August in order to promote a more normal Tonle Sap Expansion. An adaptive management plan for dam operations is needed to maximize the Tonle Sap Expansion and minimize impacts of flow restrictions on the floodpulse.
The data shows that the Tonle Sap Expansion process falters alongside restrictions at the largest dams in China and Laos, particularly during July and August. As these dams reduce restrictions during later wet season months, the expansion process proceeds with less hinderance. Data also suggests that the later wet season is becoming wetter than usual, which could be another contributing factor to later expansion peaks observed in the data.
Data Needs
As a best practice, all countries with dams in the Mekong Basin should publish and share daily or hourly dam operation data—ideally via an information portal available to the public, but at minimum to the Mekong River Commission. This data and information would provide more awareness of reservoir and river conditions and lead to ways to avoid or mitigate environmental and social impacts. Thailand, Vietnam, and Laos already publicly share relevant information on some of their dams in the Mekong Basin. In the absence of physical data, the evidence provided by this and other studies is sufficient to demonstrate the degrees to which dam operations alter river flow at various locations along the river’s course at monthly and seasonal frequencies.
Applying these methods to produce weekly or daily information could allow for extremely effective near real-time adaptive river management. Higher resolution satellite data from more sophisticated remote sensing instruments can also reduce potential bias and improve accuracy.
This study also reveals a data gap surrounding conditions on the Sekong River, the longest transboundary tributary of the Mekong, due to a lack of river gauge data published on the Mekong River Commission website.
Authorities in Cambodia and the Mekong River Commission should restore physical gauge reporting at the Siempang gauge on the Sekong River. Adding a gauge below the confluence of the Sekong, Sesan, and Srepok Rivers but before the river enters the Mekong mainstream would also help measure and study total 3S Basin discharge and flow alteration from upstream dams.
Introduction
This report provides an overview and analysis of how dam operations changed Mekong River flow conditions from the 2022 wet season (June-November) through the 2023 dry season (December-May) with some comparison to previous dry and wet seasons. To inform this analysis, the Mekong Dam Monitor (MDM) team synthesizes information derived from satellite observations with data provided by the Mekong River Commission. The report also summarizes new lines of research conducted over the course of the last year by the MDM team, namely a discussion of drivers of expansion of the Tonle Sap Lake in Cambodia and a historical analysis of how dams in the Sekong, Sesan, and Srepok (3S) rivers (three long Mekong tributaries) are changing flows in the 3S Basin and the Mekong mainstream at large. A number of policy and planning recommendations are drawn from these studies. Finally, the report highlights new features and data added to the Mekong Dam Monitor platform since June 2022 and provides links to webinars and articles produced by the MDM team as well as media mentions published between June 2022 and May 2023.
Key Developments
Better data improves the understanding of contributing factors to changes in river flow and allows decisionmakers and stakeholders across the Mekong to establish a common baseline, enabling a more effective response to new developments and challenges. The Mekong Dam Monitor provides publicly available data and analysis which empowers local stakeholders and actors to improve the state of data sharing and transboundary governance in the Mekong Basin. The following notable developments were achieved over the course of 2022 and 2023.
- Improved Data Sharing from China: China now sends data updates to governments party to the 1995 Mekong Agreement (Thailand, Laos, Cambodia, Vietnam) and the Mekong River Commission Secretariat on river levels at the Jinghong and Man’an gauge at 12-hour intervals. Previously China had only updated its hourly data once every 24 hours. Providing data at 12-hour intervals improves the ability to monitor sudden releases and restrictions from dams upstream of these river gauges and provides vulnerable communities with more time to adapt to these sudden changes. In September 2023 at a joint Mekong River Commission-Lancang Mekong Cooperation Mechanism meeting, China also pledged to share dam operations data by the end of the calendar year. While improvements in data-sharing are welcome, details of what data would be included in this pledge are scarce, and the MDM team continues to follow these developments closely.
Recommendation: As a best practice, all countries with dams in the Mekong Basin should publish and share dam daily or hourly operation data—ideally via an information portal available to the public, but at minimum to the Mekong River Commission. This data and information will provide more awareness around reservoir and river conditions and lead to ways to avoid or mitigate environmental and social impacts, and could lead to improved utilization of water resources across a shared vision for the Mekong River.
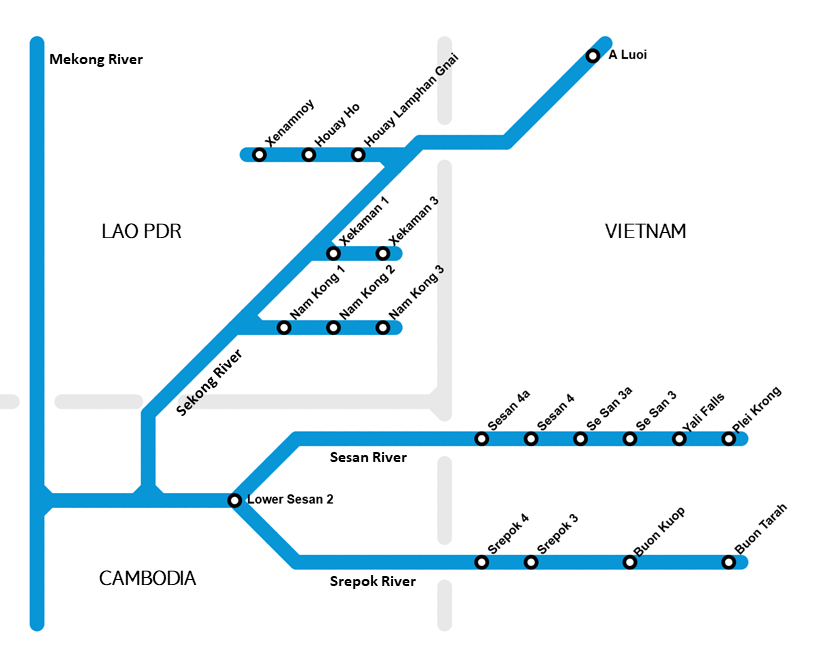
- First voluntary Transboundary Environmental Impact Assessment for a tributary dam in the Mekong Basin: In August 2022, after more than a year of public and internal campaigning by numerous local stakeholders, the Lao PDR government notified the Mekong River Commission Secretariat of the already under-construction status of the Sekong A Dam. The Sekong River is the last undammed long tributary of the Mekong and is a critically important artery for migratory fish in the lower basin. The Stimson Center, IUCN, WWF, IFC, NHI and other organizations have long advocated to keep the Sekong free-flowing. Satellite imagery shows that the Sekong A Dam began construction in in December 2020, and in 2021 key campaigners began to circulate this imagery citing the need for the government of Laos to provide official notification of the dam’s construction to the Mekong River Commission.
Notification is required by the 1995 Mekong Agreement for all dams built on tributaries of the Mekong and the mainstream. The Lao PDR government was not adhering to the 1995 Mekong Agreement until it notified the MRC in August 2022. Given the dam’s potentially severe transboundary impacts to the Mekong’s fish population and by extension to communities in all Mekong countries who rely on the world’s largest freshwater fishery, we advocate that the Sekong A Dam also requires a full prior notification, prior consultation process administered by the MRC.
In March 2023, the Lao, Vietnamese, and Cambodian government agreed to voluntarily participate with the MRC in a Transboundary Environmental Impact Assessment (TbEIA) process for the Sekong A Dam. This is the first TbEIA conducted on a tributary dam of the Mekong. The current status of the TbEIA is unconfirmed and the Sekong A Dam is currently about 50% complete, yet at the April 2023 Mekong Summit in Vientiane, MRC CEO Dr. Anoulak Kittikhoun publicly stated that the TbEIA will result in improvements to the Sekong A dam.
Recommendation: Most if not all dams in the Mekong basin will deliver transboundary impacts to varying degrees. The MRC and member countries should take lessons learned from the Sekong A TbEIA process for future application of TbEIA to all new dams, regardless of whether they are built on the mainstream or on tributaries. Further, Mekong member countries should hold each other accountable for adhering to the 1995 Mekong Agreement, particularly Article 5 which requires notification to the MRC Joint Committee by member countries to notification for all intra-basin uses on tributaries or the mainstream.
General Overview of the 2022-2023 wet-dry season cycle
The Mekong has a seasonal climate where river flow is driven by intense wet season precipitation (June to November) and extreme dryness during the dry season months (December to May). Figure A demonstrates this seasonal effect with low river flow volumes at Stung Treng, Cambodia during the early months of the year and an intense peak during the wet season months (grey shaded area). This intense peak, often described as the Mekong Floodpulse, is the key driver of fisheries productivity and much agricultural productivity in the Mekong Basin, particularly in the lower floodplain in Cambodia and Vietnam. When wet season flooding rushes across more than 70,000 square kilometers of floodplain it replenishes the croplands with rich sediment and organic material. The basin’s more than 1000 species of migratory fish find the floodplain an ideal habitat. A 2017 study by the Mekong River Commission estimated that wet season flooding provides $8-10 billion in annual economic benefits while causing less than $70 million in damages. Yet dam operations throughout the Mekong are changing the nature of that floodpulse to varying degrees. Specifically, dams are reducing the peaks and changing the timing of the floodpulse. They also trap the Mekong’s rich sediments and organic materials mobilized during the wet season, and dams block the migration of fish. Climate impacts, namely lower precipitation levels during the wet season, also are changing the nature of the floodpulse. In sections below we discuss the impact of dam operations on various sections of the Mekong mainstream and demonstrate understanding of how these dam operations combine with climate impacts to reduce the positive and productive seasonal benefits provided by the Mekong.
Our data show that dams throughout the Mekong Basin, particularly large storage dams, reliably refill their reservoirs with wet season precipitation after draining their reservoirs during the previous dry season for hydropower production. How much dams refill their reservoirs during the wet season roughly determines how much hydroelectricity they can produce during the subsequent dry season. As such, there is a kind of symmetric relationship between wet season storage and dry season releases. But to be clear, wet season storage is a function of the amount of precipitation in the basin, whereas dry season releases are determined by the demand for electricity.
To consider how dam operations impact river flow, it is logical to assume that when a dam fills its reservoir, downstream flow is reduced, and conversely that when a dam releases water for hydropower production or other purposes, downstream flow is increased.
We estimate that the 55 largest hydropower dams in the Mekong can collectively hold about 49.4 cubic kilometers of active storage, which is the amount of water usable for hydropower production. Figure B shows the largest storage dams are far upstream in China. The Xiaowan and Nuozhadu Dams each have the potential to hold more than 11 cubic kilometers of water. While these two dams together hold about half of the active storage of all large Mekong dams, the chart below shows that most other largest storage dams are in the downstream countries of Laos, Cambodia, Thailand, and Vietnam. Click here for an explanation of how we estimate active storage.
Figure C shows highest active storage levels achieved during the 2022 wet season for the 55 largest dams in the Mekong. Many of the largest dams, particularly those in China, did not reach their full potential storage levels during the 2022 wet season. The figure below shows that both Xiaowan and Nuozhadu filled to lower than normal capacities, but many of the downstream dams filled to a relatively higher amount of their potential storage. What drove this pattern? Climate data can help answer this question.
In Figure D, our weekly wetness anomaly maps below show how wet the Mekong Basin was during the 2022 wet season. Orange/red colors show areas of extreme dryness whereas blue/purple colors show areas of extreme wetness. Throughout most of the wet season, China’s upstream portion experienced severe dryness or drought conditions compared to a 30-year baseline. The drought is likely the main driver of low reservoir levels throughout China’s upper cascade of 11 dams, and particularly low levels in Xiaowan Dam and Nuozhadu Dam. Indeed this drought was widely reported in Chinese media and global media, albeit with less focus on the Mekong River and more focus on China’s Yangtze river system. Importantly the Upper Yangtze and Upper Mekong in China are adjacent basins and experienced similar weather over the period of the 2022 wet season. In the downstream, however, a different pattern emerged wherein the wet season kicked off with patterns of dryness but then shifted to extreme wetness during October and November of the wet season.
Use the arrows to scroll through all the maps
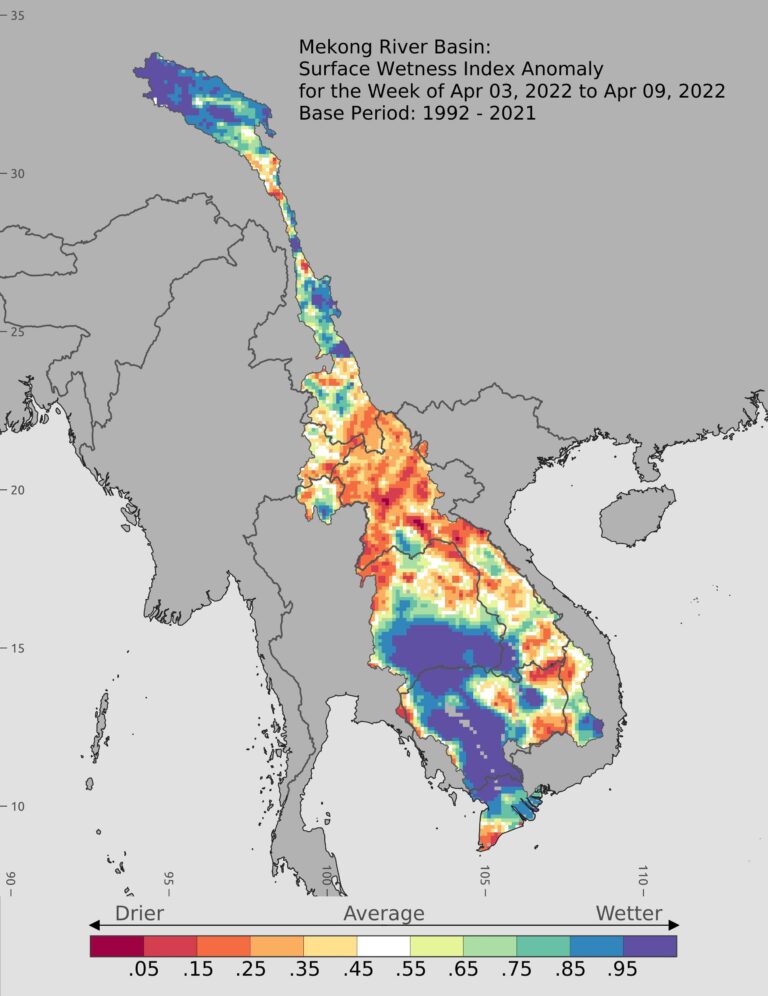
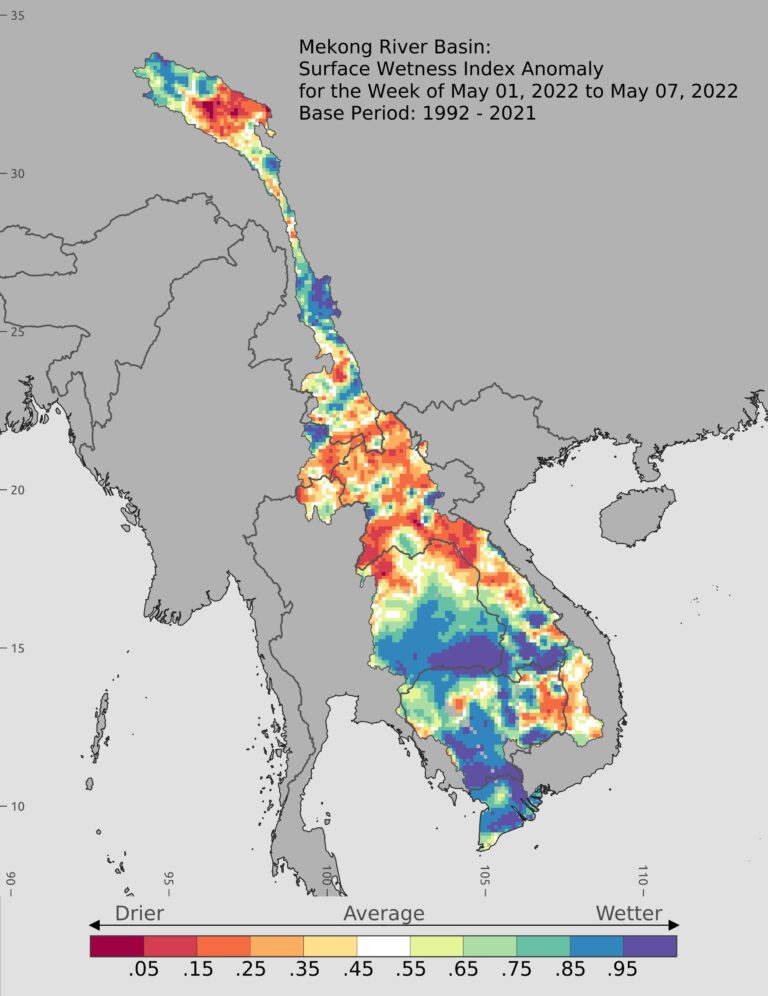
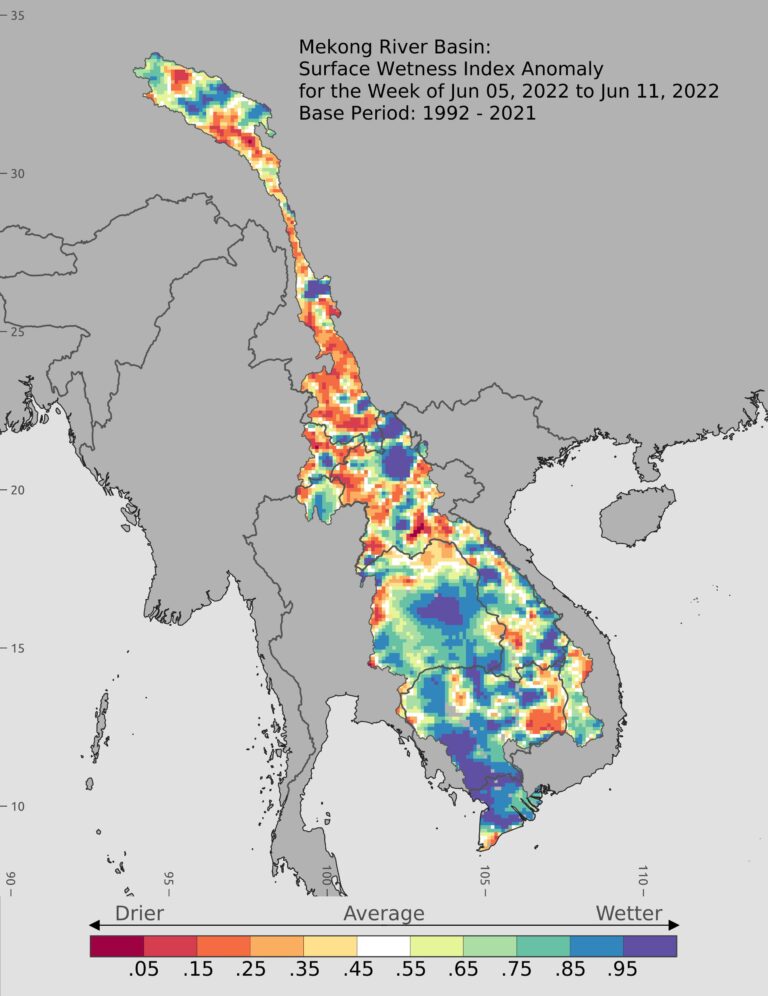
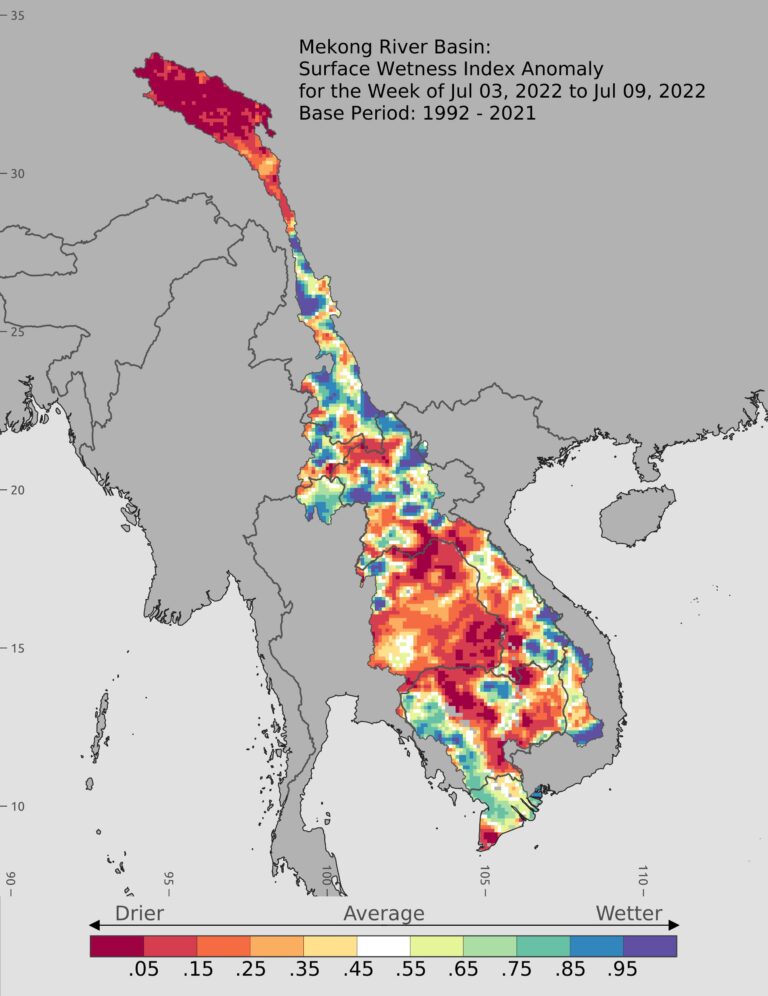
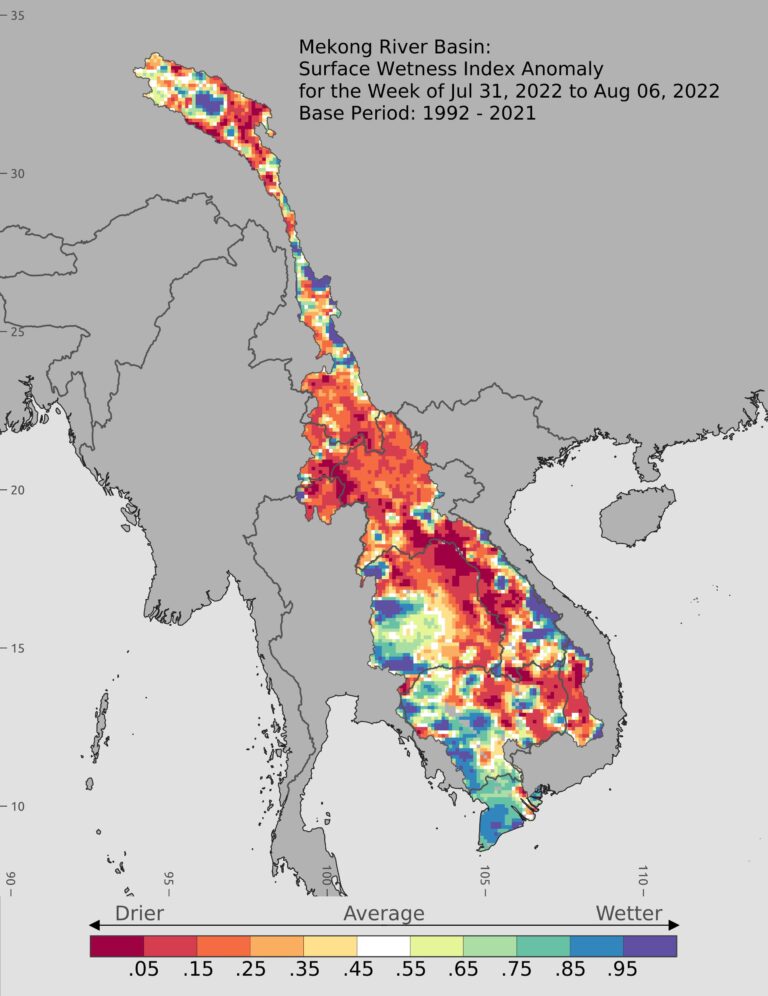
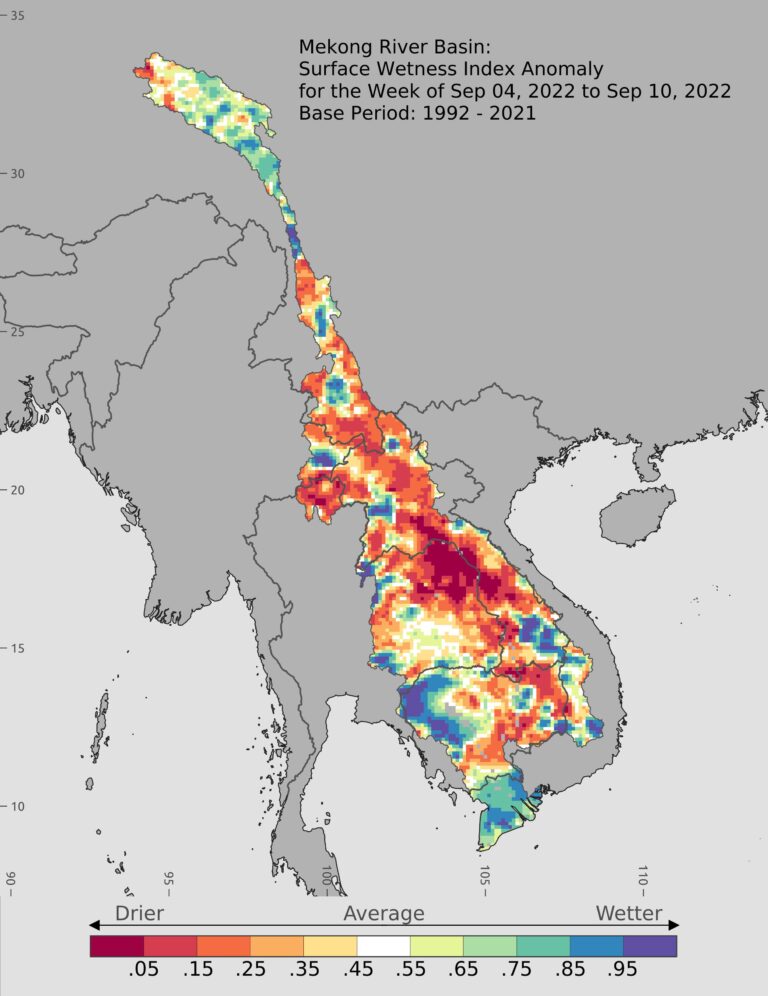
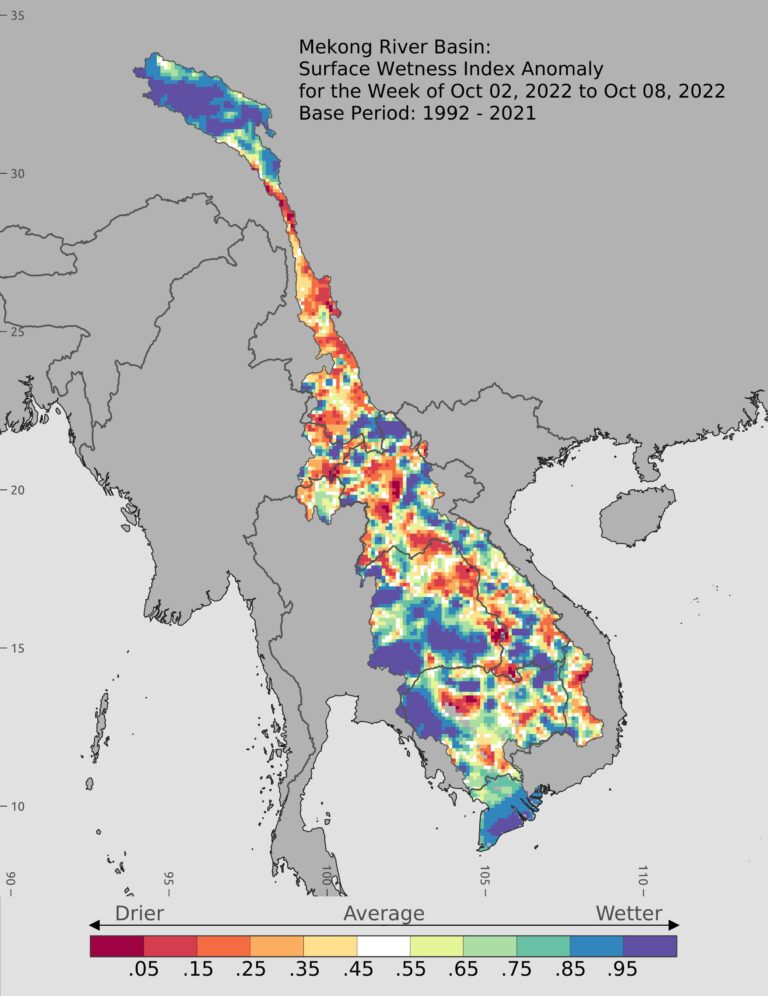
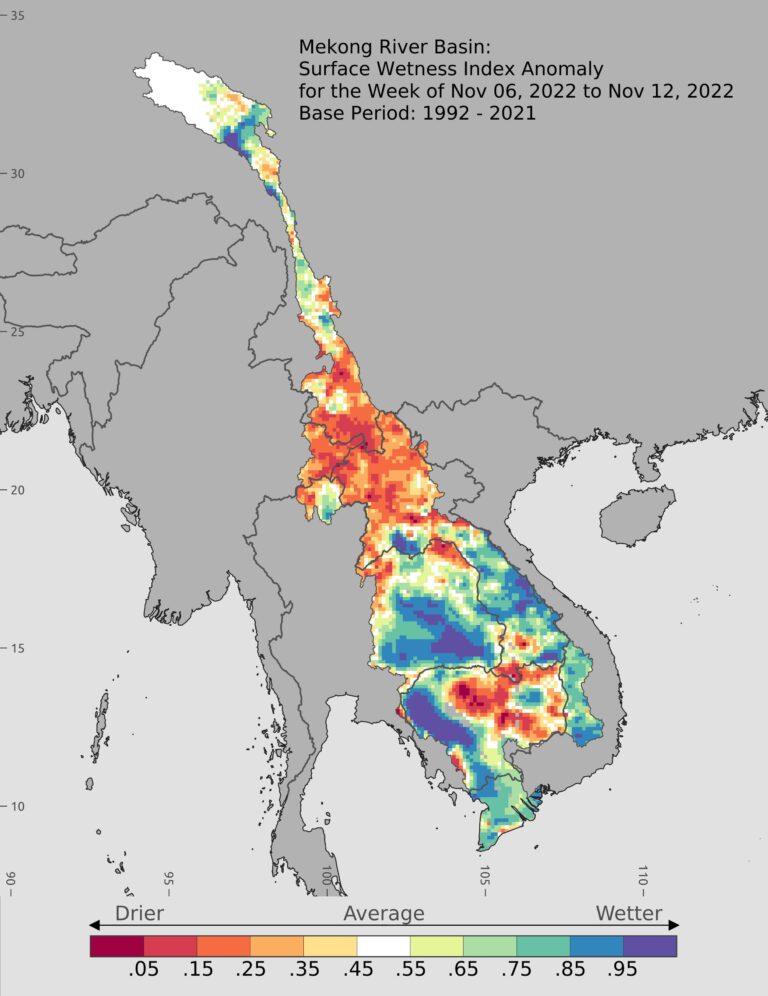
While China’s dams filled to lower-than-normal levels during the wet season due to drought, the abundance of precipitation over the downstream portions of the basin provided conditions for many downstream reservoirs to fill to normal levels. With this information, at the end of the 2022 wet season it was possible to conclude that China’s 2023 dry season hydropower production capabilities would be relatively lower than that of the downstream, and that as a result China’s dry season releases of water would be less impactful than normal years of operations. Our team indeed came to this conclusion and provided this forecast during our 2023 Mekong Dry Season webinar series in January 2023. We also provided this forecast to downstream governments and NGOs. As predicted, 2023 dry season dam operations and river flow data compiled in May 2023 confirmed this forecast to be generally accurate.
Figure E shows the seasonal increases and decreases of storage patterns among China’s 11 mainstream dams from 2019 through 2022. It starts with the 2019 wet season because this was the first year that all 11 of China’s mainstream dams were operational. Focusing on 2022-2023, Figure E above demonstrates the general, reciprocal relationship between wet season 2022 storage increases and dry season 2023 storage decreases. Figure F below shows how much water each of China’s 11 dams released across the dry season of December 2022 through May 2023 compared to their average dry season releases between 2019-2022. Xiaowan’s average dry season releases from 2019-2022 (8.18 cubic kilometers) were nearly double 2023’s dry season releases (4.97 cubic kilometers). The same can be said for Nuozhadu, where the average dry season releases from 2019-2022 totaled 6.1 cubic kilometers yet 2023’s dry season releases were only 3.3 cubic kilometers. China’s nine other dams factored little into the pattern of lower-than-normal dry season releases.
The underperformance of China’s dams was confirmed in a Nikkei Asia article in March 2023, which noted a cut-back in aluminum production in Guangdong resulting from a lack of hydropower production in Yunnan. Interestingly, this underperformance actually resulted in a closer to normal dry season flow regime along the Thai-Lao border from Chiang Saen, Thailand to Vientiane, Laos when compared to previous years, and this is discussed in more detail below.
One other contributing factor to lower than normal dry season releases was that China’s two largest dams began releases for hydropower production prior to the traditional start of the dry season, an uncommon behavior compared to how those dams were operated between 2016 and 2021. The Figures G and H below show Nuozhadu releasing water in October and Xiaowan doing so in November. By the end of December 2022, these dams had already released much of their stored water.
These earlier than normal releases created conditions for closer to normal dry season conditions along the Thai-Lao border downstream during the 2023 dry season. In other words, with lower releases from upstream dams which would otherwise unnaturally raise river levels, the river would run closer to its natural flow pattern. Figure I below shows actual observed flow (dark blue) at Chiang Saen, Thailand tracking much more closely to the long-term average flow pattern than it does to the much higher flow pattern for 2019-2022, which is driven by dam releases across that period.
The above instance highlights the impacts of how China’s large dams can operate when a wet season drought is occurring in China’s upper Mekong Basin. Much of the downstream did not experience the severity of China’s wet season drought in 2022. Critically, the basin is large and long, spanning more than 4,000 kilometers from its headwaters to the mouth and different parts of the basin experience different climatic conditions at different parts of the year. More of the interactions between dam operations and variability in upstream and downstream climate situations is discussed in the sections below. Yet it is important to remember that the data also shows instances when the upstream did not experience a severe wet season drought, but the downstream did.
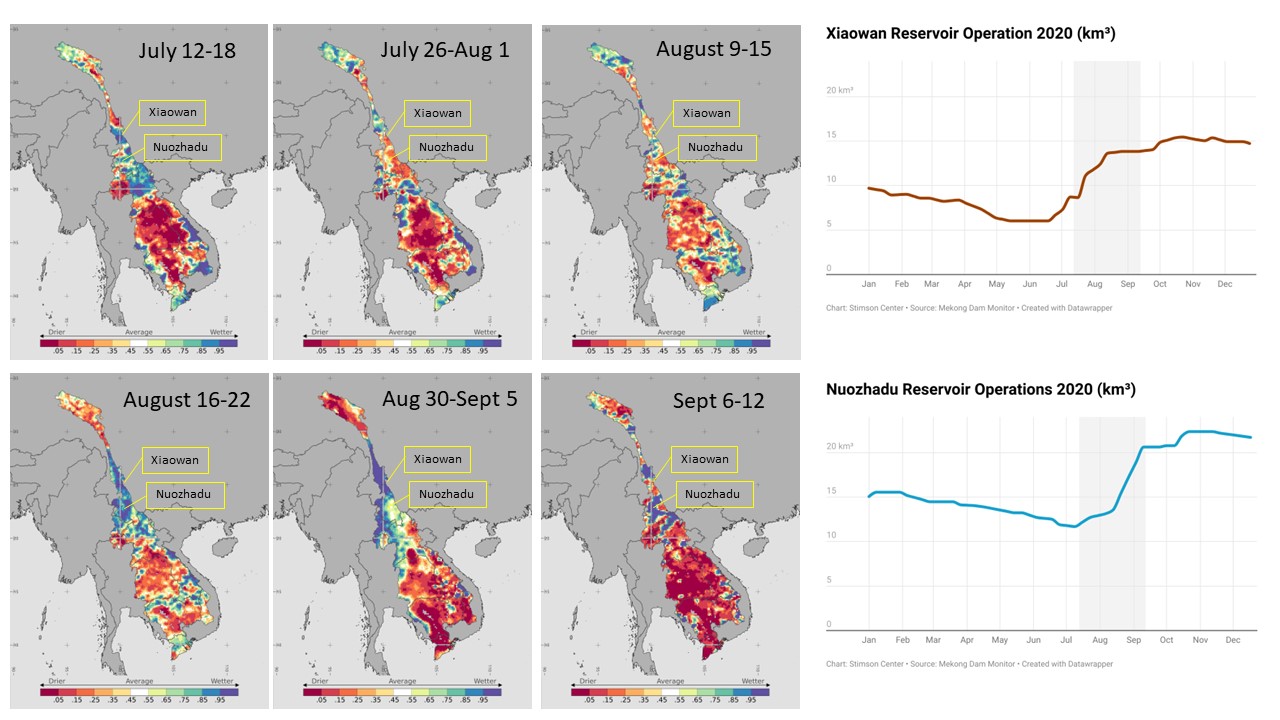
Such was the case in 2020, the lowest annual flow year on record for the Mekong. To provide an example from our previous annual report, during the 2020 wet season, China’s large dams restricted more than 20 cubic kilometers of water. Figure J shows how this was nearly the same quantity of water restricted in 2018, a normal flow year where no instance of wet season drought occurs in the data. In 2020, Nuozhadu and Xiaowan’s restrictions alone reduced total Mekong flow at Stung Treng, Cambodia more than 2,000 kilometers away by more than 9%. This example highlights how China’s dam operations can severely exacerbate drought conditions far downstream particularly during times of wet season drought. It also demonstrates a need for a greater awareness of downstream conditions during times of need like the 2020 wet season and a more careful approach to wet season restrictions during those times of need.
Figure K provides more insight into the case of the 2020 wet season by highlighting wetness anomalies over six weeks of the wet season where the upstream experienced extreme to normal wetness levels (purple and green colors) but the downstream experienced a persistent and severe wet season drought (dark red). Note the location of Xiaowan and Nuozhadu and envision the wetness observed upstream of these dam locations draining into the reservoirs of these dams during the weeks highlighted. The operations curves of each dam (right charts) show that it was across the roughly two-month period of July 12-September 12 that these dams restricted the most water to refill their reservoirs. If those dams would have let all or a portion of the water to flow downstream during these periods, the Mekong floodplain in the downstream would have been considerably wetter, but instead the activity of those dams exacerbated drought conditions.
Seasonal and Monthly Dam Impact Analysis
So much of what makes the Mekong unique, from being the world’s largest freshwater fishery to its robust agricultural production to its incredible biodiversity, relies on the extremes of its annual flood pulse. Since it is now understood that large storage dams in the Mekong Basin refill their reservoirs during the wet season and release water from reservoirs during the dry season for hydropower production, the effect of these operations is a reduction of extremes by bringing the wet season floods down and raising the river level during the dry season. In our last annual report, we published the Figure L which shows how the flood pulse at Chiang Saen, Thailand was on average flattened out or erased during the years of 2017 and 2021.
Focusing on the Chiang Saen gauge is a useful place to start for understanding dam impacts throughout the basin since more that 50% of the active storage of the Mekong is in China’s dams located above the Chiang Saen. But as the river’s water travels downstream and as the basin’s numerous tributaries in Laos, Cambodia, Thailand, and Vietnam flow into the river system, the effects of China’s dams lessen in a relative sense. However, as the river courses along, the impacts of dams in the downstream countries then begin to influence flow and must be accounted for. By combining our virtual gauge observations for the largest 55 dams in the basin dams with Mekong River Commission flow data, it is possible to parse out the impacts of all dams at various locations along the river’s course from Thailand to Laos to Cambodia. We explore these results at five gauge locations at Chiang Saen, Thailand; Vientiane, Laos; Nakhon Phanom, Thailand; Pakse, Laos; and Stung Treng, Cambodia in the subsections below. Figure M provides a breakdown of the dams we monitor located between the five respective gauges and their estimated active storage capacity.
How did dam operations impact 2022 wet season river flows?
The wet season drought in China and the resulting lower-than-normal reservoir levels in China’s upstream dams translated to lower-than-normal reductions of flow from Chiang Saen to Stung Treng during the 2022 wet season. While in previous years the wet season flow restrictions in China’s two largest dams reduced total wet season flow by 10% all the way to Cambodia, this was not the case in 2022. To interpret Figure N, natural flow is the total value of all colors on the bar and can be understood as including dam restrictions plus observed flow since dam restrictions reduce natural flow.
The greatest reduction in flow was experienced at Chiang Saen, where wet season flow would have been 15% higher without the 7.76 cubic kilometers of dam restrictions in China’s dams. At Vientiane, at which point more tributaries in Thailand and Laos have added flow into the river system, the impacts of China’s dam restrictions reduced flow by a little more than 7% and the impacts of the three dams monitored between Chiang Saen and Vientiane were negligible.
At Nakhon Phanom, the impacts of downstream dams become visible and measurable, namely from the operations of the large storage dams in Laos which from here forward are referred to as the Core Lao Dams (Nam Ngum 1, Nam Ngum 2, Nam Ngiep, Nam Theun 2, Theun Hinboun Expansion, plus a few smaller dams). These dams restricted an additional 6.03 cubic kilometers of flow across the six-month wet season, and flow at Nakhon Phanom was reduced by an estimated 8.27% from the combined impacts of both the Core Lao Dams and China’s dams. The additional impacts of Thailand’s dam operations (2.1 cubic kilometers) are picked up at the Pakse gauge, and at Pakse the total restrictions of downstream dams (8.33 cubic kilometers) exceed China’s dam restrictions (7.76 cubic kilometers). Combined, all dam restrictions reduced flow to Pakse by 6.56%. At Stung Treng, the impacts of 20 dams in the 3S (2.6 cubic kilometers) are added on to all dam impacts, creating a total flow reduction of 5.92%. The impact of downstream dams (3.44%) on flow reduction to Stung Treng was greater than that of China’s dams (2.48%).
Obviously, flow reductions of 15% at Chiang Saen is meaningful and likely even obvious to the naked eye, but how much of a difference does say an 8.27% reduction in flow at Nakhon Phanom or a 5.92% reduction in flow to Stung Treng matter to downstream outcomes? One observable outcome is explained in sections below: at this level of flow reduction, the Tonle Sap achieved a normal expansion, albeit one that peaked later than usual.
While this kind of seasonal flow stock analysis is useful, it is also important to remember that dams do not operate in a consistent nor in a necessarily predictable manner over the course of a season. One month’s wet season flow restrictions at a large dam like Nuozhadu in China or the Nam Ngum 1 in Laos might greatly exceed restrictions at the same dam during the preceding or following months. Precipitation and by extension the natural flow of the river will also vary with ups and downs throughout the wet season created by monsoon rains delivering. Thus, to get a more meaningful look at dam impacts, a smaller unit of time provides insight. The analysis below considers monthly dam impacts to flow arriving at the five gauges. To produce these monthly time series at different gauges along the river’s course, we apply a time lag to observed dam restrictions, considering the amount of time it would take for an observed restriction to otherwise flow downstream if the restriction did not occur. These “travel times” of water vary from gauge to gauge. These travel times calibrated using flow data provided by the MRC. For example, we assume all restrictions observed in China would otherwise reach the Chiang Saen gauge roughly during the same week. However, by observing the way wet season flows typically flow from the Mekong, we assume restrictions that happen now in China would otherwise arrive at Stung Treng, Cambodia at least one week later.
To be sure, this lag period of one week is a coarse estimate of travel time. Travel times will vary day to day and week to week based on actual conditions along the river’s course. Dry season travel times will vary much less than wet season travel times, which can be significantly affected by storms and precipitation patterns. While a sophisticated model can be applied to best conduct this kind of dam impact assessment, our application of lag times based on observed MRC data is sufficient to get a general feel for the impacts of dams. The application of a model will help move from a general sense to very specific results. It is possible to conduct this kind of simple lag analysis at weekly intervals using Mekong Dam Monitor and MRC flow data, an endeavor we seek to initiate in the coming year. Honing our understanding of which individual dams created which kinds of impacts to flow during certain weeks or days can help inform sophisticated dam operations analysis or real-time adaptive planning efforts and identify ways to avoid or mitigate environmental impacts related to key ecological processes like the floodpulse.
Figure O below visualizes and provides analysis on monthly impacts of dam restrictions to gauges along the river’s course for the 20211 Data is not available currently for June and July 2021 and 2022 wet season. As the analysis moves downstream it becomes apparent that China’s dams and the Lao dams on tributaries between Vientiane and Nakhon Phanom (Nam Ngum 1, Nam Ngum 2, Nam Ngiep, Nam Theun 2, Theun Hinboun Expansion) deliver the greatest reductions to flow. These charts also include mean monthly flow estimates for each gauge from a pre-dam era determined by the averages at each gauge between the start of data availability (ranging between 1910 and 1960 depending on the gauge) and 2007. After 2008, the Xiaowan Dam commenced operations; post-2008, this and other dams began to significantly influence downstream conditions. Incorporating a mean flow line from the pre-dam era gives the sense of how natural flow conditions for the month or year in question compares to the historical mean. If natural flow is far below the mean, then we assume climate impacts such as low precipitation levels are driving lower than normal natural flow conditions. In other words, when dam impacts are identified and isolated, then it is possible to determine whether the river would be flowing in line with historical norms or whether climate impacts are influencing conditions.
The impacts of dam restrictions at Chiang Saen for the 2022 wet season were more moderate when compared to 2021 due to a lack of rainfall upstream. Even though China’s dam restrictions in 2022 were only half of the average of the previous three wet seasons, they still had a measurable impact to Chiang Saen with flow reductions of 25% in July, 21% in August, 10% in September, 35% in October, and 12% in November. Compare this to 2021 with a 42% reduction in August and a 62% reduction in September. June 2022 has a negative value because China’s dams had net releases during that month, raising the river level higher than normal.
Natural flow at Chiang Saen was still well below mean pre-dam flow (blue line) over the course of the 2022 wet season, with natural flow ranging from 20-34% below mean, suggesting climate effects made this wet season relatively dry. However, dam restrictions exacerbated these conditions by pulling observed flow down to between 40-50% below mean flow over the course of the wet season. Note how 2021 natural flow would have been much closer to normal in August and September without the significant impacts of dams.
Compared to pre-dam mean flow, in 2022 natural flow levels at Vientiane would have been around normal for July and October, and at 15% below mean for August, 12% below mean for September, and 18% below mean for November. But dam impacts pulled all observed monthly values down, ranging between 20-23% below the long-term average.
Natural flow levels would have been lower than the pre-dam mean in July (19% lower), August (18% lower), and September (18% lower), but dam impacts reduced flow to 23% below normal in July, 27% below normal in August, and 23% below normal in September. October flow would have been 35% higher than normal in October, but dam restrictions reduced this to 21% higher than normal.
Natural flow levels would have been lower than the pre-dam mean in July (23% lower), August (21% lower), and September (18% lower), but dam impacts reduced flow to 26% below normal in July, 27% below normal in August, and 22% below normal in September. October flow would have been 27% higher than normal in October, but dam restrictions reduced this to 12% higher than normal. The impacts of dam restrictions at Stung Treng for the 2022 wet season were more moderate than previous years due to a lack of rainfall upstream.
Like the charts above, the cumulative height of the bars (i.e. observed flow plus dam restrictions) represents what flow would have been for each particular month without the impact of dams. The observed flow value (blue) represents the amount of water which was actually observed at each gauge. Further, it is important to note that the maximum value varies for each chart as the amount of water in the system at each gauge increases as the reader moves downstream. For example, the highest flow volume in Chiang Saen would have occurred in August with a value of 11.39 cubic kilometers whereas the highest flow volume at Stung Treng, the most downstream gauge, would have been in September at 77.28 cubic kilometers. To highlight the most significant impacts, in September 2021, river flow at Stung Treng, Cambodia would have been 26% below normal as a result of a lack of rain, but the combined impacts of 55 upstream dams river flow to 39% below normal.
How did dam operations impact 2023 dry season river flows?
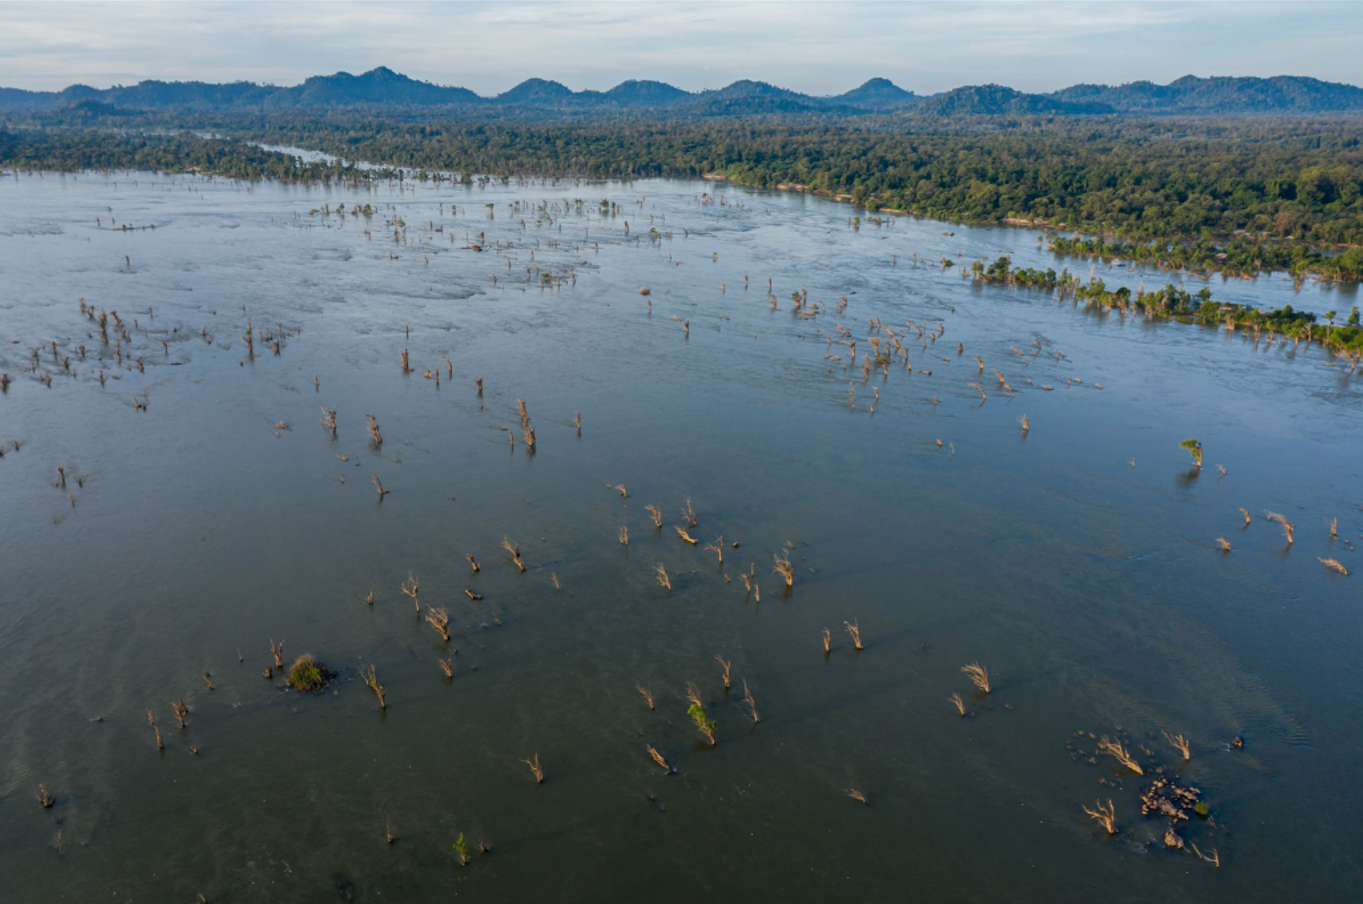
Dams typically release as much water back into the river during the dry season for hydropower production as they restricted into reservoirs during the previous wet season. This is the previously mentioned symmetrical relationship between wet season dam restrictions and dry season releases for hydropower production. Yet dry season impacts of dams are much more noticeable both in the data and to the naked eye since the river flows at seasonal and monthly volumes multiple times lower than in the wet season. Dr. Ian Baird from the University of Wisconsin has recently produced a study showing increasingly higher river levels at the Pakse gauge and subsequent impacts on the ecology of the flooded forest, which runs from Laos’s southern border areas to below Stung Treng, Cambodia. Noticeably, because of higher dry season water levels caused by dam releases, many of these flooded forests no longer have an opportunity to dry out and carry out important life-cycle processes. As a result, thousands if not more trees have died along the river’s course and threaten the habitat of numerous endangered fish and bird species which rely on the fruits of the flooded forest. In turn, this also reduces the livelihood of communities who also rely on this bounty. We too have repeatedly mentioned these impacts in written reports and online webinars.
In the sections below, we examine the seasonal and monthly impacts of dam releases during the dry season gauge by gauge from Chiang Saen, Thailand to Stung Treng Cambodia. Seasonal effects are extremely noticeable at every gauge—much more so than in the wet season.
To interpret Figure P, the light blue value is what flow volume would have been without the impacts of dam releases. It is determined by subtracting estimated dam releases from the observed value at each respective MRC gauge. Previously we discussed how China’s dry season dam releases were roughly half that of recent years, but they still more than doubled natural flow volume (108% higher) at Chiang Saen across the December 2022 through May 2023 timeframe. Farther downstream at Vientiane, China’s dam restrictions are still extremely significant, artificially raising river flow 50% higher than it should have been in that timeframe. The impacts of downstream dams, namely the Core Lao Dams, appear at Nakhon Phanom. These dams alone increased flow by 33.25%, and combined with China’s dams releases, the dry season flow at Nakhon Phanom was 70.41% higher than it would have been under natural conditions. The trend continues at Pakse, with the addition of Thailand’s hydropower releases alongside PRC and Lao dams for a cumulative 61.48% increase in flow, and when the impacts of the 3S dams are added in the seasonal flow at Stung Treng was artificially increased by 56.14%. Noticeably at Stung Treng, downstream dams had a larger impact (34.56%) on river flow than PRC dams (21.56%). But at every gauge the impacts of dam releases are substantial.
The impact of dam releases during the 2023 dry season become even more apparent with monthly views of each gauge. The analysis below suggests that dam releases can increase flow by three times natural flow values at Chiang Saen during certain months, and at Stung Treng far downstream dam releases can nearly double flow values during particular months.2Like the wet season monthly analysis above, we use lagged travel times derived from MRC flow data for the releases tracked by our virtual gauge method. In the dry season, water takes longer to travel downstream due to relatively low volumes. For example, we assume it takes at least two weeks for releases in China to hit the gauge at Phnom Penh and one week for releases from core Lao dams to arrive at Phnom Penh. Dry season lags will be published as endnotes in the document.
Scrolling through Figure Q below provides details on monthly dam impacts during the 2023 dry season. 2022 dry season charts are included for useful comparison. At most gauges it is obvious that China’s unusually low dam releases created conditions for flow volumes much closer to the pre-dam mean.
Comparing these impacts to the previous dry season in 2022 demonstrates how much lower the river can be when dam releases are relatively low. During the 2022 dry season, the natural flow would have been very close to mean values at most gauges throughout the Mekong without dam releases. But that year China’s dams released huge amounts of water for hydropower production during the months of March, April, and May, significantly increasing all five gauges to much higher volumes. This did not happen in 2023.
The high dry season releases during 2022 are representative of how the river flows at much higher-than-normal levels when China’s dry season dam releases are large. In 2022, natural flow without releases tracks closely to the pre-dam mean.
In 2023, observed flow (the total of blue and purple bars each month) tracks closely to mean flow conditions from the pre-dam period. 2023 natural flow was on average 50% below mean flow for the entire season due to lower than usual rainfall upstream. In 2023 dam releases increased river volumes at Chiang Saen by at least 85% each month, In January flow was 116% higher than natural flow, April 131% higher, and in May 194%, nearly three times its natural flow value. Compare this to 2022 when February flow was 150% higher, March 131% higher, and April 213% higher. Also note how China’s dam releases were more extreme over the last months of 2022 where in 2023, releases were more evenly distributed across months.
The high dry season releases during 2022 are representative of how the river flows at much higher-than-normal levels when China’s dry season dam releases are large particularly during March through May. In 2022, natural flow without releases tracks closely to the pre-dam mean with the exception of April and May which must have experienced unusual rainfall.
In 2023, observed flow (the total of blue and purple bars each month) tracks closely to mean flow conditions from the pre-dam period. 2023 natural flow was on average 25% below mean flow for the entire season due to lower than usual rainfall upstream. In 2023 dam releases increased river volumes at Vientiane by 54% in January, 51% in February, 55% in March, 32% in April, and by 114% in May. Compare this to 2022 when March flow was 109% higher and May was 68% higher. Also note how China’s dam releases were more extreme over the last months of 2022 where in 2023, releases were more evenly distributed across months.
The high dry season releases during 2022 are representative of how the river flows at much higher-than-normal levels when China’s dry season dam releases are large particularly during March through May. In 2022, the additions of releases from the Core Lao Dams begin to push flow volumes much higher than the pre-dam mean particularly during March and April.
In 2023, dam releases increased flow at Nakhon Phanom by 60% in January, by 93% in February, by 93% and March, by 53% in April, by 154% in May. On average the flow values at Nakhon Phanom in 2023 were 21% higher than pre-dam mean values, yet they were 56% higher than mean in 2022. In March 2022 dam releases increased flow by 134%, in April by 56%, and in May by 50%. These numbers suggest that this stretch of the river could one of the most affected by the combined impacts of dams upstream. Although the percentage increases of flow are similar to those at Chiang Saen, Thailand, the actual volume of flow increases is much higher at Nakhon Phanom.
The high dry season releases during 2022 are representative of how the river flows at much higher-than-normal levels when China’s dry season dam releases are large particularly during March through May. In 2022, the additions of releases from the Core Lao Dams and Thailand’s dams begin to push flow volumes much higher than the pre-dam mean particularly during March and April.
In 2023, dam releases increased flow at Pakse by 66% in January, by 101% in February, by 63% and March, by 91% in April, by 67% in May. On average the flow values at Pakse in 2023 were 30% higher than pre-dam mean values, yet they were 68% higher than mean in 2022. In March 2022 dam releases increased flow by 116%, in April by 48%, and in May by 41%. These numbers suggest that this stretch of the river could be one of the most affected by the combined impacts of dams upstream. Although the percentage increases of flow are similar to those at Chiang Saen, Thailand, the actual volume of flow increases is much higher at Pakse.
The high dry season releases during 2022 are representative of how the river flows at much higher-than-normal levels when China’s dry season dam releases are large particularly during March through May. In 2022, the additions of releases from the 3S dams, Thailand’s dams, and Core Lao Dams begin to push flow volumes much higher than the pre-dam mean particularly during March and April.
In 2023, dam releases increased flow at Stung Treng by 46% in January, by 73% in February, by 90% and March, by 84% in April, by 43% in May. On average the flow values at Pakse in 2023 were 37% higher than pre-dam mean values, yet they were 74% higher than mean in 2022. In March 2022 dam releases increased flow by 92%, in April by 42%, and in May by 41%. These numbers suggest that this stretch of the river could be one of the most affected by the combined impacts of dams upstream. Although the percentage increases of flow are similar to those at Chiang Saen, Thailand, the actual volume of flow increases is much higher at Stung Treng.
Notably, 2023 also did not experience an uptick in natural river flow as the dry season began to transition into the wet season in April and May. This uptick was observed in 2022 and is a known feature of the upper basin’s normal hydrological cycle as glacial melt in China increases toward the end of the dry season, giving the wet season a kind of early boost starting in April. Isolating the impacts of dams allows for analysis into other climate impacts, like changes in glacial melt behavior, which could be affecting river flow. While we have no conclusive evidence that glacial melt in April and May of 2023 was any less than previous years, the lack of an April-May uptick also translates through to lower parts of the basin.
At most gauges below Vientiane, the largest dry season impacts are delivered by China’s dams and the Core Lao dams between Vientiane and Nakhon Phanom. Yet at times, releases from other dams can be equally if not more impactful. For example, in March 2023 dams in the 3S Basin released a collective 1.88 cubic kilometers of water, which we estimate at around 30% of their total active storage. In March 2023, the release from 3S dams was slightly greater than the release from the core Laos dams and also much greater than those from China’s dams in March. The 3S dam releases created an additional 34% of increase to flow which when combined with other upstream dam releases increased flow to 90% above what natural flow would deliver.
Focusing on 2022 dry season gauge analysis also reveals an interesting find. At each gauge from Vientiane to Stung Treng, natural flow—or the flow without dam releases—would deliver a normal, dry season nadir in the month of March. Yet dam impacts, particularly China’s dam impacts, shift that nadir to February. So not only is the river becoming higher in general during the dry season due to dam releases, but in 2022 its rise began one month earlier than normal.
The same effect is observed in Figure R below which compares pre-dam dry season means to the post 2007 period when the impacts of dams became visibly noticeable to the naked eye and in MRC data.
Recommendations:
- In absence of official data, the evidence provided by this and other studies is sufficient to demonstrate the degree to which dam operations are changing river levels at various locations along the river’s course at monthly and seasonal frequencies. Improving these methods to the weekly and even daily scale could allow for extremely effective methods in near-real time adaptive river management.
- Climate interactions with dam impacts and river flow are complex and much is unknown about the interaction of these effects on the Mekong’s ecology and socio-economic outcomes. Climate effects are more acutely visible via abnormally low wet season flows but these effects impact dam operations which then carry over into the dry season and increase variability in dry season river levels month to month and year to year. Further, not all parts of the basin are equally impacted by changes in wet season precipitation. This study points out wet seasons when the upper basin is wet while the lower is dry and vice-versa. Increased basin-wide weather and climate forecasting at the seasonal and smaller time scales can help understand this complexity, and an adaptive basin-wide dam operations plan can help mitigate instances when upstream dams severely exacerbate wet season drought. More study is required to understand these interactions and impacts. A misunderstanding of these interactions and impacts can lead to ineffective solutions.
Early Warning Alerts
When China’s dams suddenly release or restrict flow to the degree that river levels downstream rise or fall 0.50 meters or more within a 24-hour period, we issue alerts to authorities and communities in Thailand and Laos two to five days prior to those impacts reaching those communities. We issue these alerts at this threshold because a change of 0.50 meters or more over the course of 24 hours is enough to flood riverside gardens or sweep farming assets into the river. Larger releases could cause significant flooding. Thailand’s government puts our alerts to use through its disaster management agencies when the level of change exceeds one meter. To further demonstrate the impact of these alerts, we visited Ban Saeo Village in Chiang Rai Province, Thailand in July 2023 and met with community leaders who told us they no longer lose boats moored along the river because of the alerts they receive. The alerts, communicated by the Thai government and local civil society groups to tens of thousands of people along the river via various methods, allow vulnerable people to take anticipatory action that saves assets and possibly lives. We will continue to provide these alerts until China makes good on its long-standing pledge to issue early warnings related to dam restrictions and releases.
The table below compares alerts issued across the 2022 wet season and 2023 dry season to previous years. During this time we issued 20 alerts, a significant decrease compared to the previous year’s 34 alerts. Across the two periods, the number of alerts related to significant restrictions of flow which drop the level of the river downstream were similar to previous years, but the number of alerts for sudden releases in this timeframe were less than half that of the previous year. China’s dam releases increased the level of the river downstream by one meter or more in a 24-hour period only four times over the 2022-2023 period compared to 9 times over the previous period. The maximum release observed over the 2022-2023 cycle was 1 meter, significantly lower than previous cycles with increases of 1.6 meters (2021-2022) and 1.3 meters (2021-2022). The cause for these reduction in alerts over the 2022-2023 cycle is most likely related to lower than usual reservoir levels during the 2022 wet season, which led to lower than usual releases in 2023’s dry season. We also would like to think our efforts to shine a light on these sudden releases and their causes have sparked a diplomatic discussion which has persuaded China’s dam operators to operate their dams more responsibly with lower sudden downstream impacts. A longer dataset over five to ten years into the future could possibly demonstrate this effect.
Recommendation: PRC dam operators should avoid sudden releases or restrictions in flow which cause these severe downstream fluctuations. Smarter dam management can avoid these impacts. In cases where sudden releases and restrictions are necessary for dam safety or other reasons, dam operators in China should provide early warning days in advance to relevant authorities and communities downstream in order for vulnerable people to have time to prepare for the coming change.
Deep Dives: Key findings of research studies
The following two sections take a deep dive into analysis produced by new MDM products developed over the last year. The first offers a new insight into the Tonle Sap expansion process and details a unique find identified during the 2022 wet season. The second discusses the impacts of more than 20 dams built in the 3S Basin, a transboundary basin formed by three major tributary systems of the Mekong which originate in Vietnam and then pass through parts of Laos and Cambodia before joining the Mekong at Stung Treng, Cambodia.
Tonle Sap Expansion
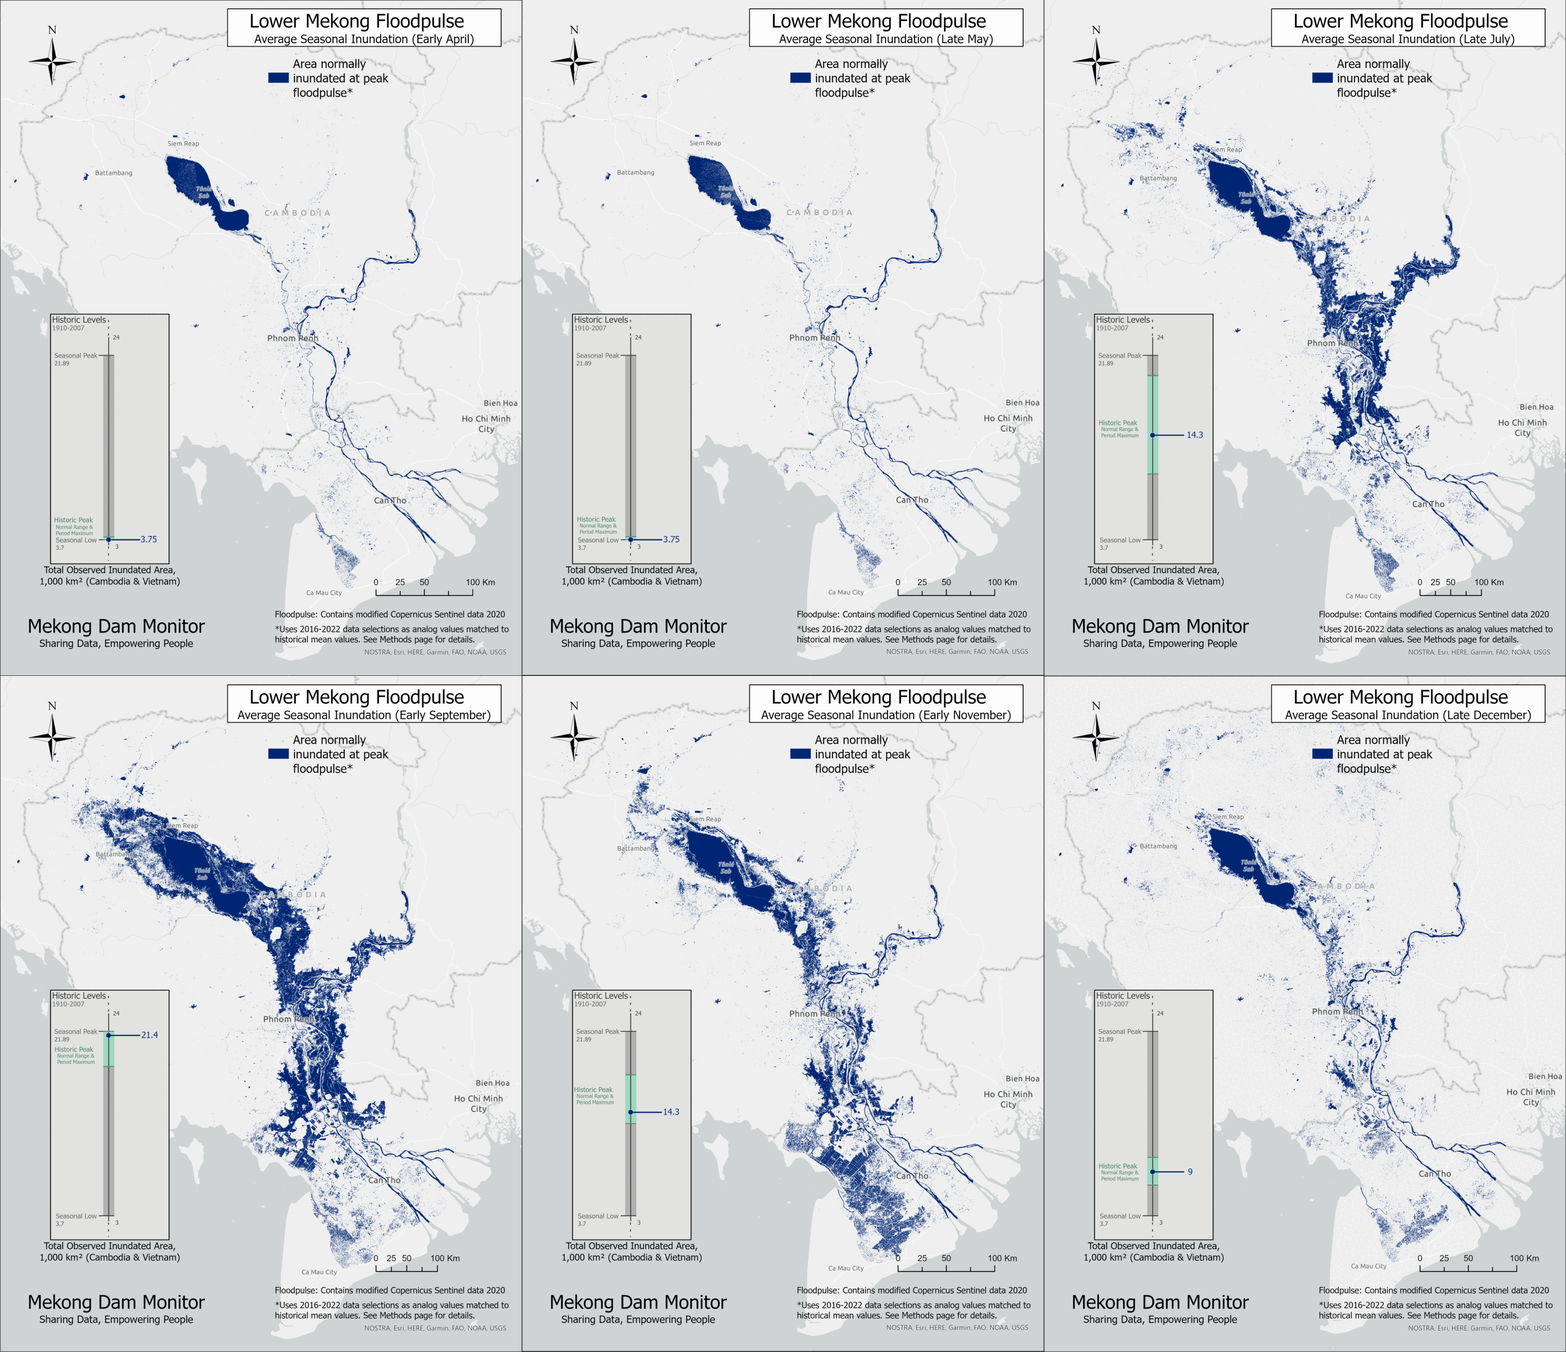
The Tonle Sap Lake is often called the beating heart of the Mekong Basin. During normal wet season conditions, its area expands to five times its dry season size and fills the lake with sixty times its dry season volume of water. This expansion is mostly driven by higher levels in the Mekong mainstream, which causes the famous “Tonle Sap Reversal” where the river which traditionally flows out of the Tonle Sap reverses direction. This reversal sends water from the Mekong into the Tonle Sap, and transported with that water are fish eggs and larvae which find a rich habitat inside the Tonle Sap Lake where the fish feed and grow. As the wet season rains subside, the level of the Mekong mainstream drops again and water begins to flow back out of the Tonle Sap Lake, returning the Tonle Sap River to its normal direction of flow toward the ocean. The Tonle Sap begins to contract and fish species migrate into the Mekong to find spawning grounds upstream. Figure T shows the 2018 expansion process which tracks closely to a normal expansion.
Figure T: A Normal Tonle Sap Expansion Process
It is this process that makes the Tonle Sap Lake the world’s largest freshwater fishery with roughly 500,000 tons of fish caught throughout the year. Similarly, it is this process that makes the Mekong Basin account for 20% of the world’s freshwater fish catch. More than 3 million people live and fish on the lake and along its shorelines, and the fish catch in Cambodia alone is responsible for 60-70% of the national population’s animal protein intake.
While the sustainability of Cambodia’s fish catch and the annual expansion and contraction of the Tonle Sap Lake has been a question of concern for decades, Mekong watchers grew particularly concerned about the state of the Tonle Sap during the string of low wet season flow years which ran from 2019-2021. Those living in the Mekong could easily see the low wet season river levels and lower than normal lake levels, but it was unknown how much lower than normal the lake’s expansion was and to what degree the Tonle Sap Reversal was occurring or not occurring. The Mekong Dam Monitor team was equally concerned, and in 2022 developed three new products to monitor the expansion process and answer these questions: a bi-weekly map of the floodpulse, which captures inundation in Cambodia and Vietnam; a weekly wetness map, which shows the state of surface wetness in Cambodia and Vietnam; and a kind of natural flow model for the Tonle Sap, which focuses on the MRC gauge at Prek Kdam, Cambodia. In 2022, the Mekong River Commission also published a webpage which monitors reverse flow in real-time and compares what’s happening now to normal conditions. The section below utilizes these new approaches to tell the story of what happened to the Tonle Sap expansion in 2022.
What did we learn from floodpulse monitoring?
Our Mekong Floodpulse map can demonstrate just how much the Tonle Sap Lake and the floodpulse were affected by low flow years by examining peak flood conditions over the course of the low-flow period of 2019-2021, bookended by normal flow years of 2018 and 2022. The blue area in Figure U shows actual inundation as observed by radar satellites, while the teal shows what normal conditions would be for that time of the year based on normal expansion processes as defined by a 100-year dataset provided by the MRC. Since 2018 tracked closely to the normal expansion process, we match the results of the normal expansion to corresponding observed lake levels in 2018.
Use the arrows to scroll through all the maps
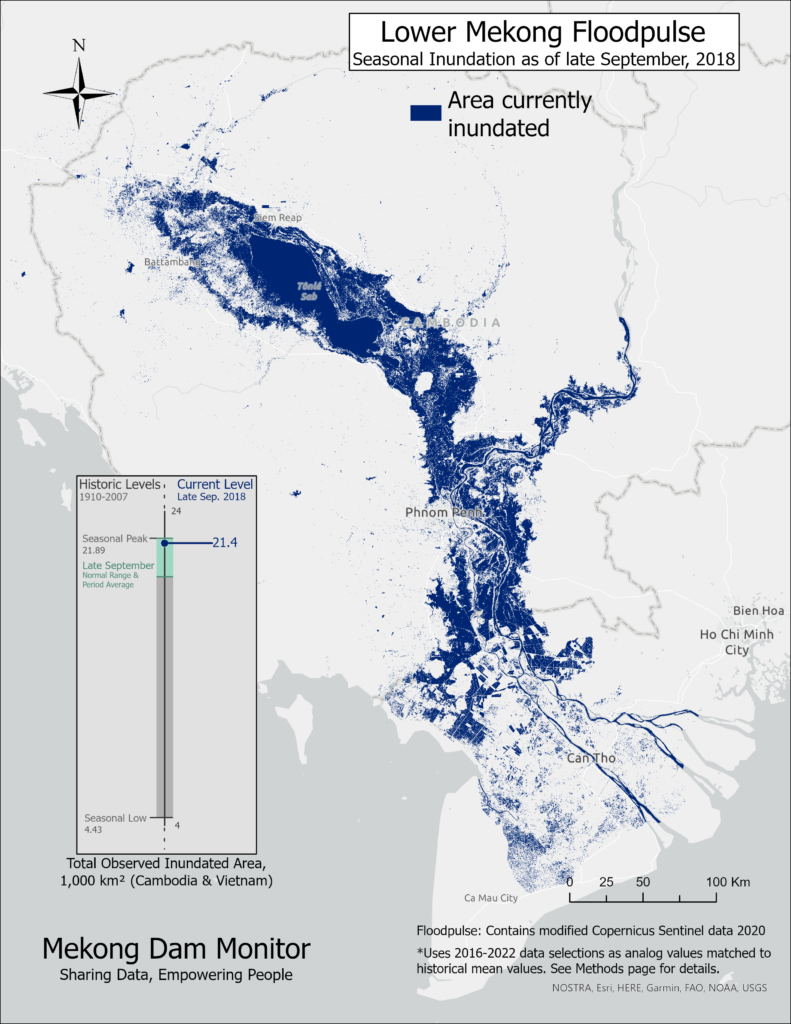
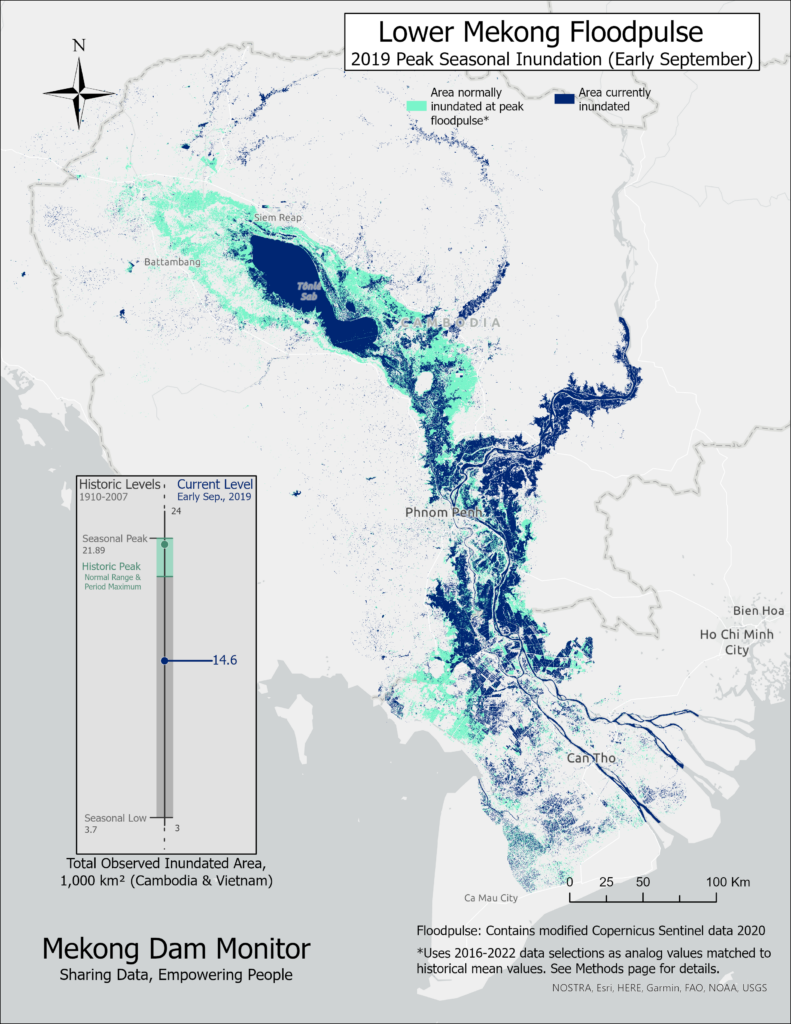
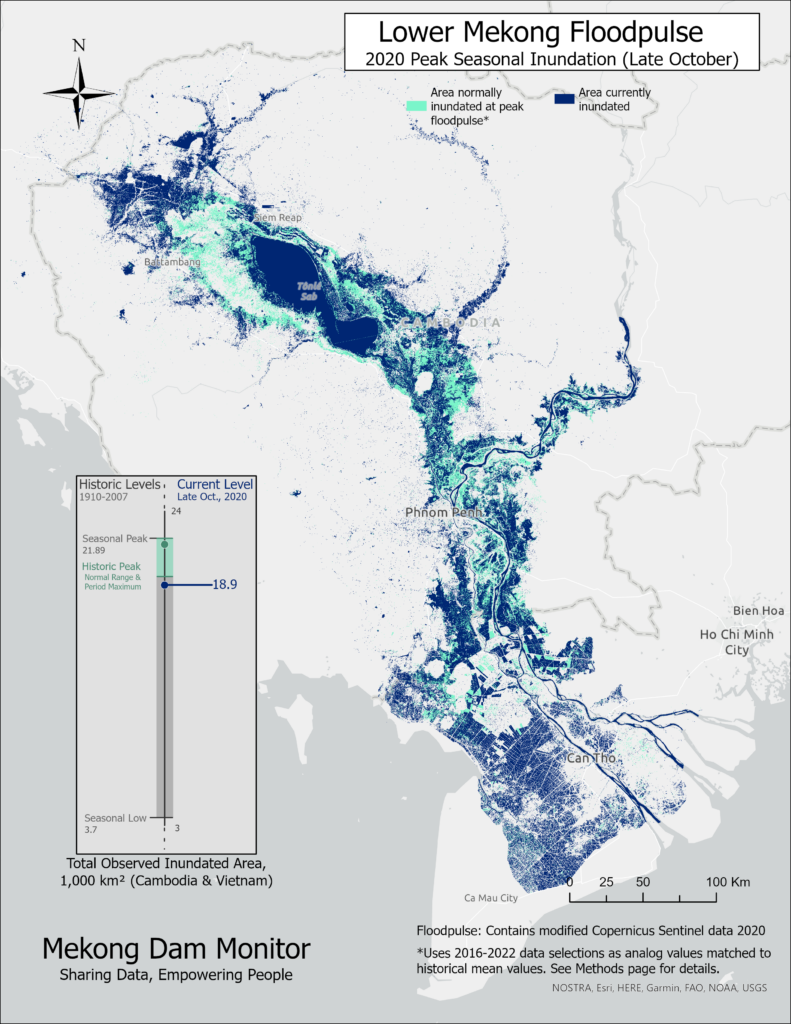
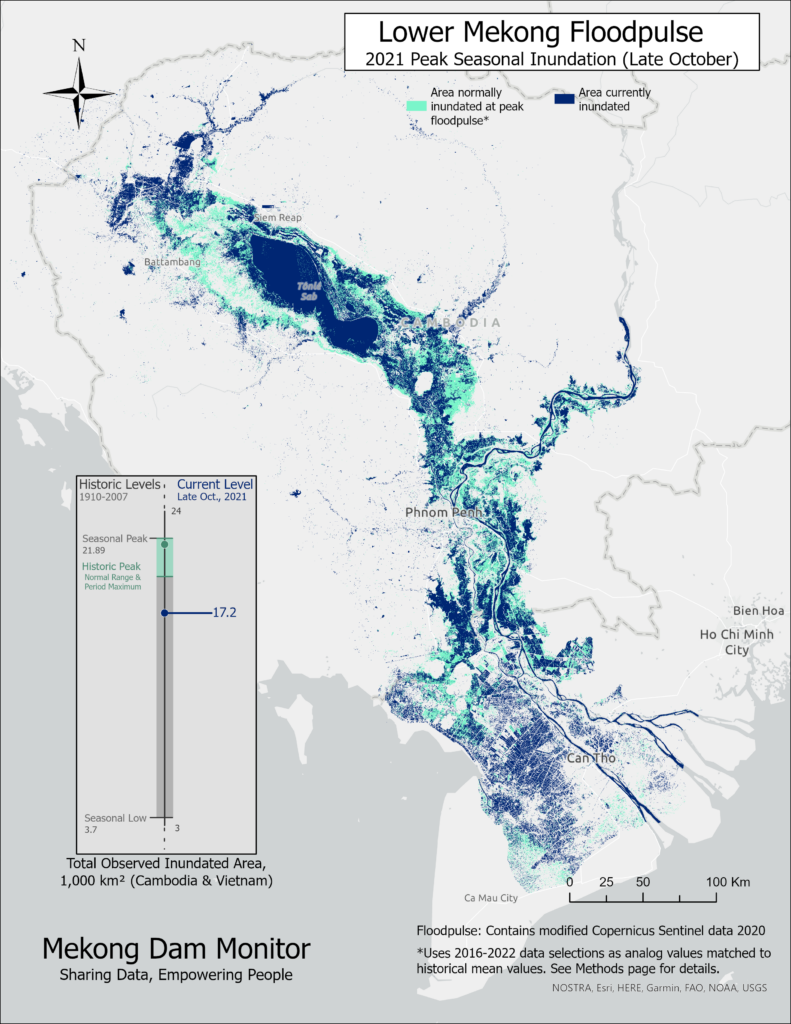
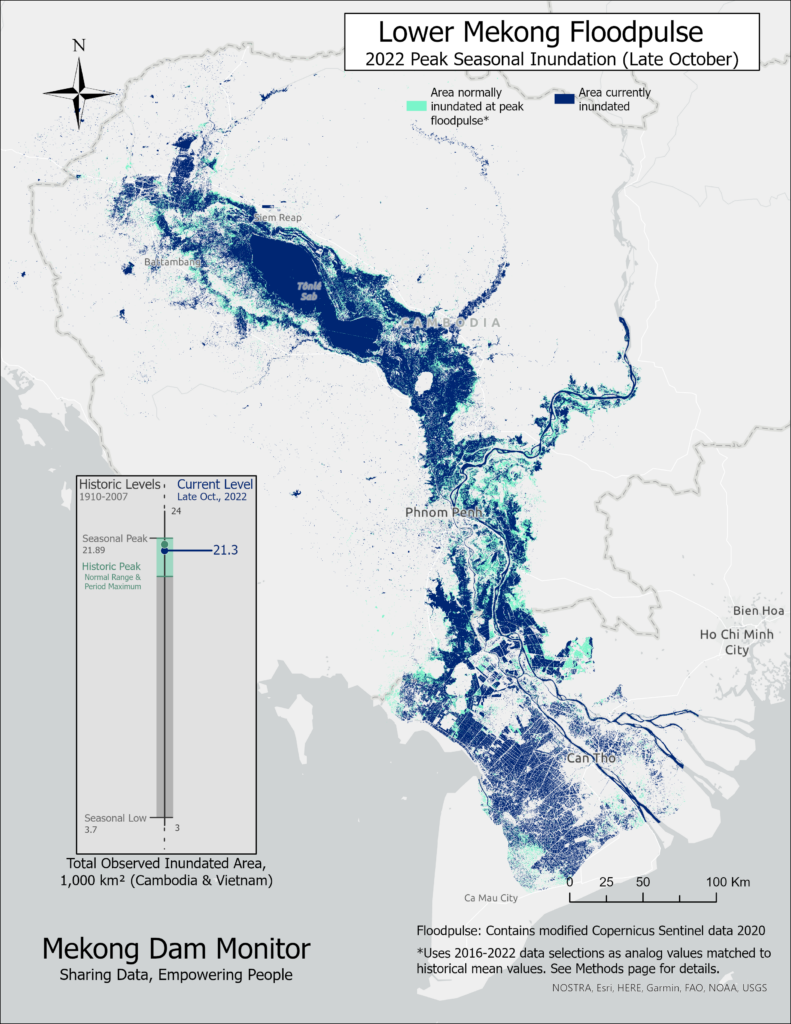
2019 appears to be the year with the lowest peak expansion, which is surprising since 2020 and not 2019 was the lowest flow year on record for the Mekong. A normal peak is estimated at 21,600 square kilometers, yet in 2019 seasonal inundation peaked at a meager 14,600 square kilometers. While much of the Mekong mainstream from central Cambodia to the Vietnam border was less flooded than normal in 2020, 2020’s floodpulse came closer to normal ranges with 18,900 square kilometers of seasonal flooding. This was buoyed by extreme inundation in the upper northwest corner of the lake, likely a result of prolonged rainfall over that part of the Tonle Sap Basin and not a result of reverse flow. Note the large teal gap between the lakeshore inundation and the inundation in the upper northwest corner of the map. That teal area is apparent from 2019 through 2021 and as such, persistently unflooded portions of the northwest corner of the lake near Battambang are likely signals of a weak expansion and reversal process. In 2018 and 2022, when a normal expansion was achieved, that gap area is mostly filled in with inundation.
2022 achieved a normal expansion, much to the relief of fishers living along the lakeshore, and alleviated concerns among some Mekong Watchers that the Tonle Sap Lake might not ever reach normal expansion again due to the impacts of climate and upstream dams. Yet during the 2022 wet season, as the Mekong Dam Monitor team published its bi-weekly maps of the floodpulse in real-time, we too grew concerned about whether the expansion would occur. By September of 2022, lake levels were still very low and reverse flow levels as reported by the Mekong River Commission were the lowest ever recorded. Figure V shows the process of the 2022 Tonle Sap Expansion.
Use the arrows to scroll through all the maps
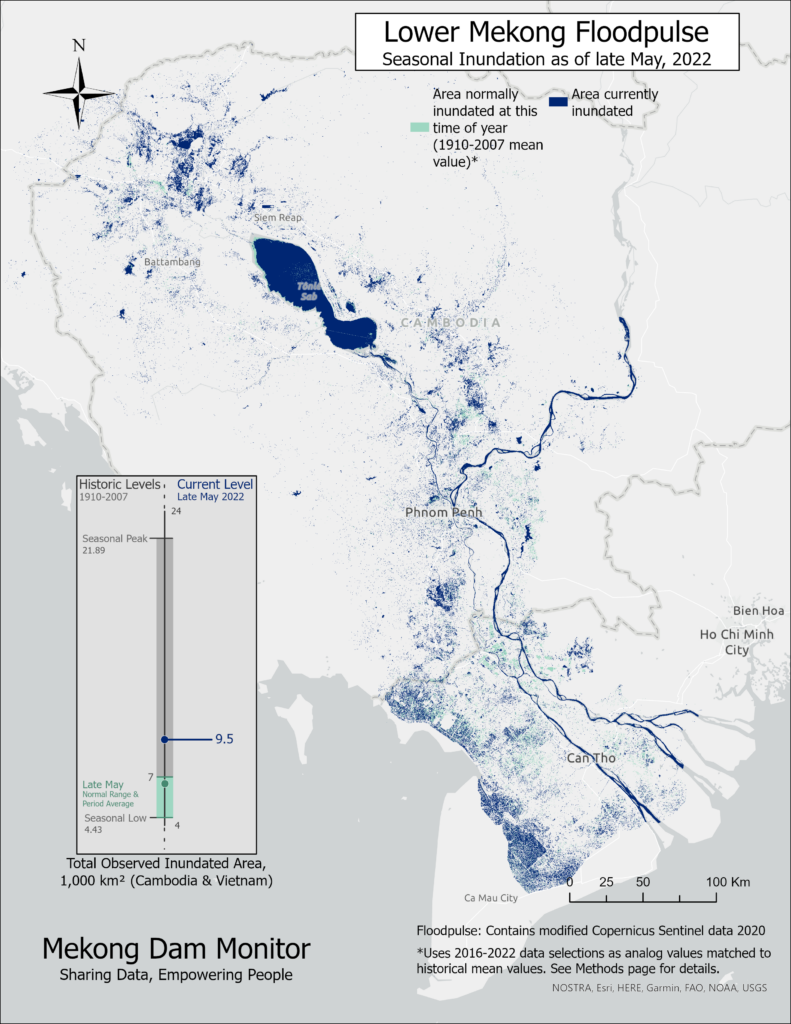
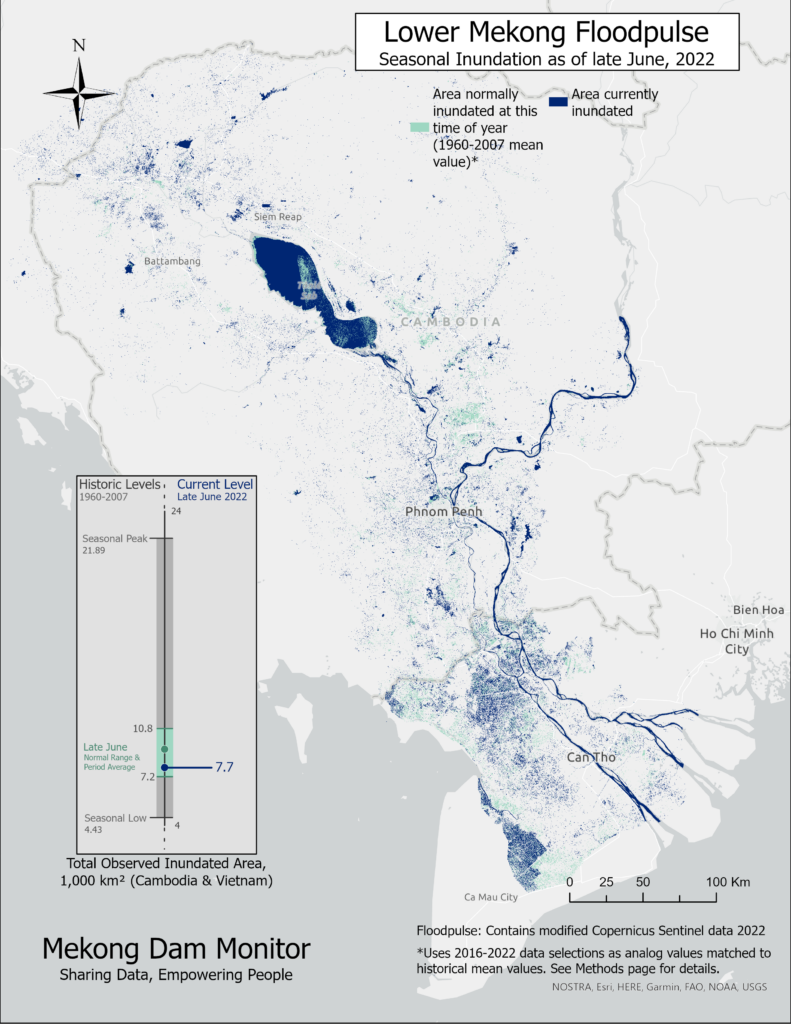
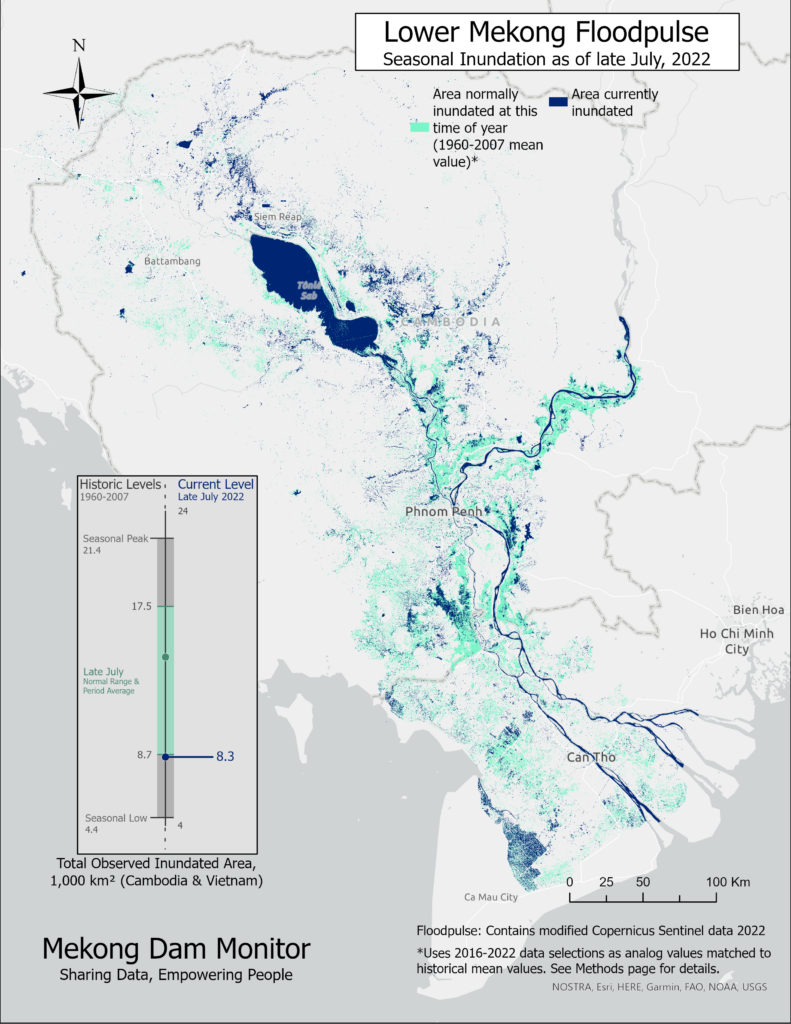
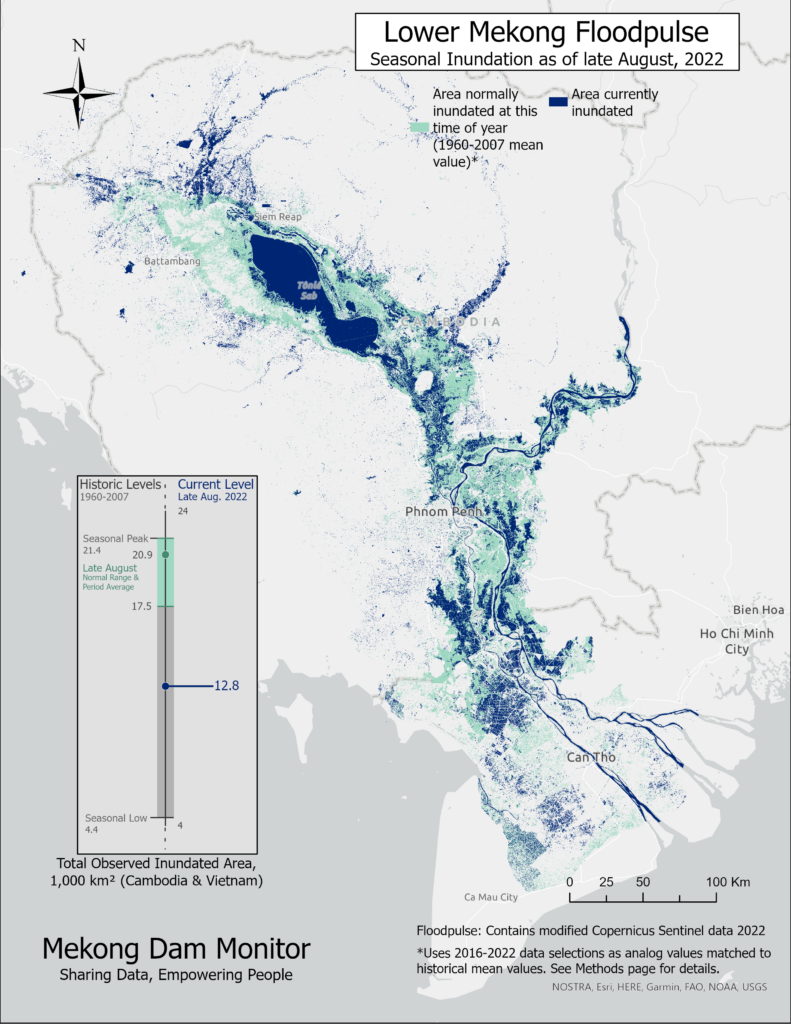
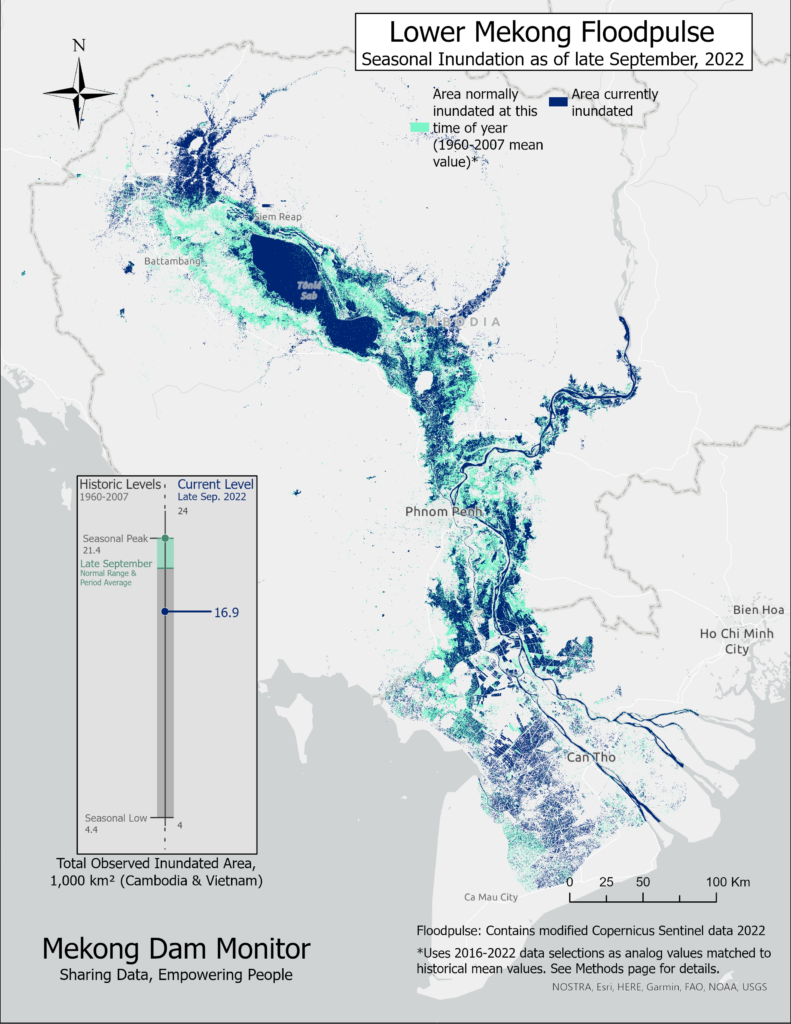
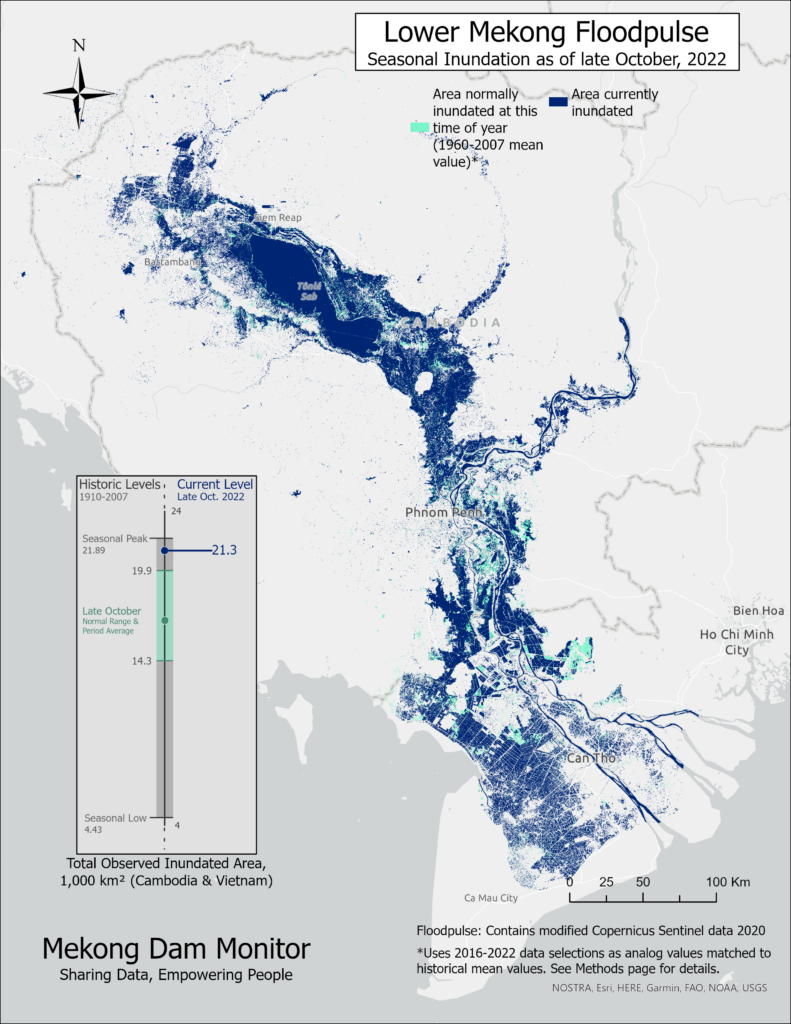
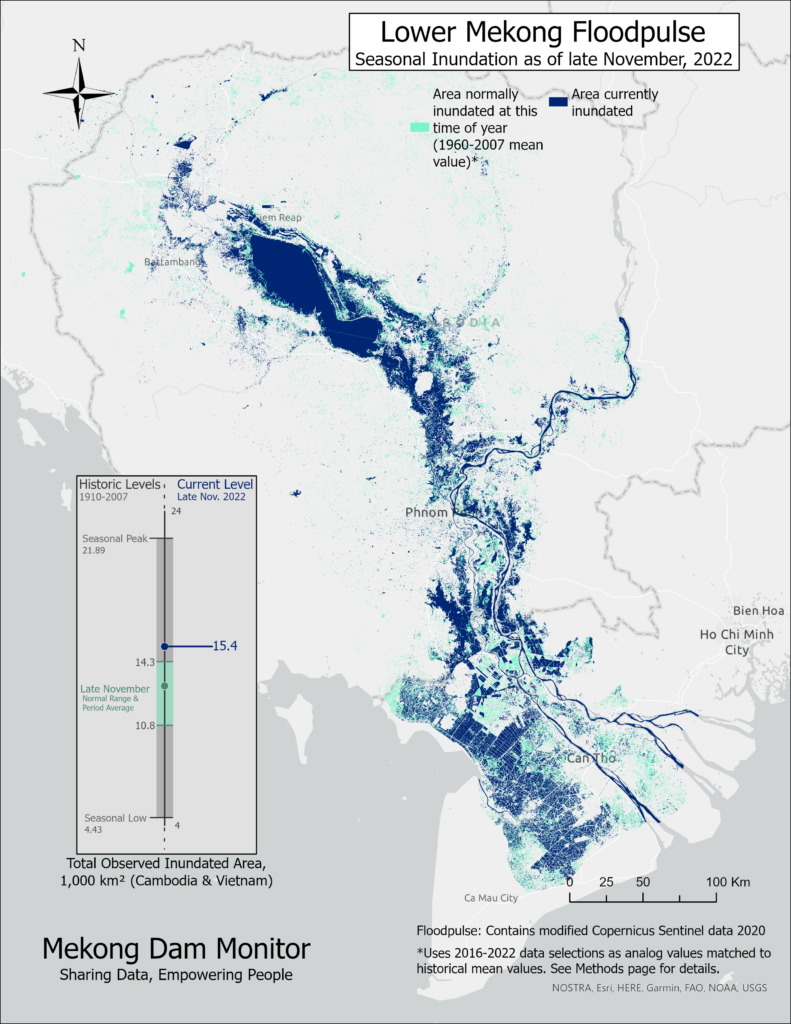
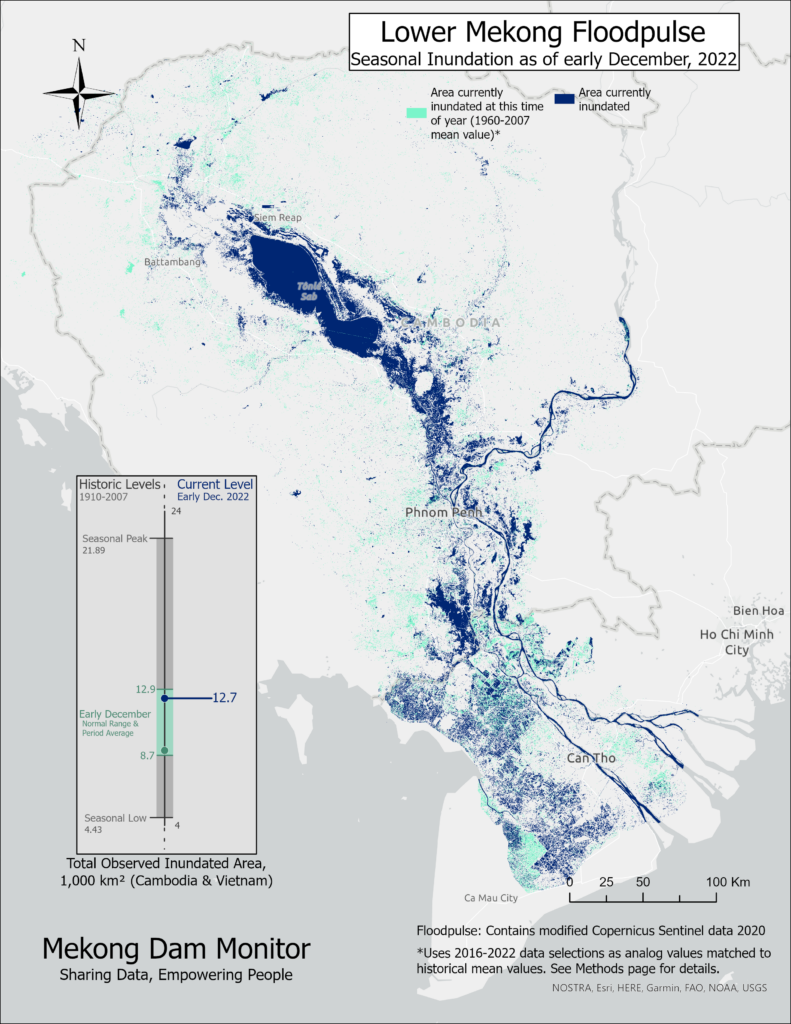
The series shows that the lake’s expansion process actually got off to a good start in June with above normal conditions, likely due to unseasonable rains over the Tonle Sap during the months of April and May. As the wet season months proceeded, however, the level of inundation fell well below normal with the greatest gap observed in August as shown in the chart nested inside of the map. In August, only 8,200 square kilometers of inundation was observed compared to a normal range of 14,300-21,400 square kilometers of inundation for that time of year. After August, something unique happened: the lake began to expand into September and October. By the end of October, the Tonle Sap achieved a normal expansion of around 21,800 square kilometers of inundation, about one month later than normal conditions would deliver. This is remarkable because it was the first time in four years that the lake achieved a normal expansion. What drove this late, normal expansion? While the floodpulse images cannot fully answer this question, digging into other data provided by the Mekong Dam Monitor and Mekong River Commission can.
Did reverse flow cause a normal 2022 Tonle Sap expansion?
A good first guess into what drives the Tonle Sap expansion is always to consider how much “reverse flow” has moved from the Mekong mainstream into the lake. In 2022, the MRC launched its “Article 6b for monitoring purposes” webpage to track reverse flow and provide an interactive interface which can show cumulative reverse flow volumes tracked from 1997 to the present where each year is assigned a different colored line. The volume is calculated by comparing the differences of water levels at gauges along the lake water levels at gauges on and near to the Mekong mainstream. A basic way to interpret Figure W as published by the MRC is that when Mekong mainstream river levels are higher than lake levels, then water will flow in reverse direction from the river back into the lake and the line will increase in value. When the line is flat, then reverse flow is not occurring either because lake and river levels are similar or because lake levels are higher than the river.
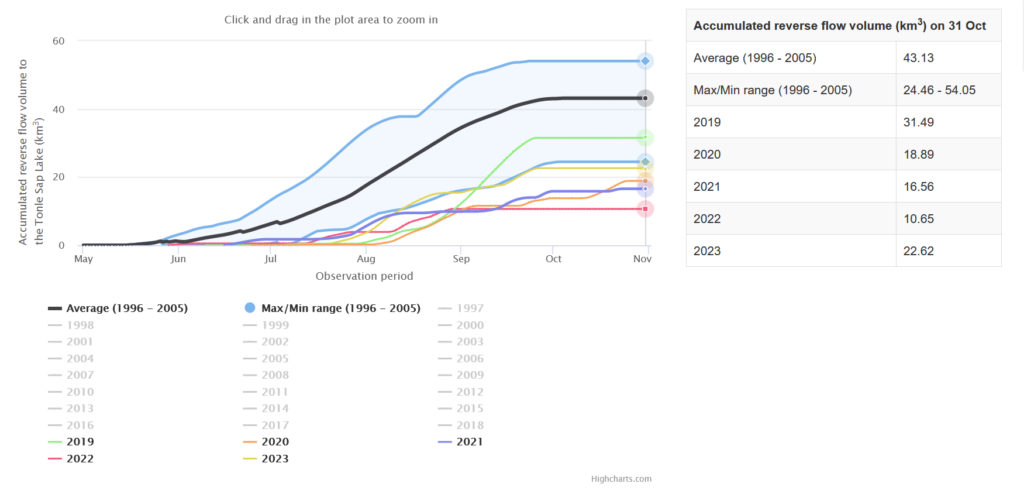
The reverse flow values for 2022 present an intriguing find: total reverse flow for 2022 (10.65 km3) was the lowest ever recorded since record-keeping began in 1996, yet the Tonle Sap Lake reached a normal expansion albeit later than normal peak. Looking at the graph, it is clear that reverse flow in 2022 was even lower than the low wet season flow years of 2019 (31.49km3), 2020 (18.89km3), 2021 (16.56 km3), all years when the Tonle Sap Lake did not achieve a significant level of expansion. At face value, the data alone tells us that reverse flow from the Mekong mainstream is not always the most significant driver of the Tonle Sap Expansion. This finding should challenge traditional thinking about how the Tonle Sap Expansion works under different conditions. Under normal circumstances the Tonle Sap Expansion is likely driven mostly by reverse flow, but below we explain that under certain circumstances it can expand as a result of significant levels of rainfall over the Tonle Sap Basin. This is important to know given increasingly lower Mekong wet season flows resulting from a combination of a lack of rainfall and upstream dam restrictions.
So what caused a normal Tonle Sap Expansion in 2022?
While the upper Mekong experienced a drought during the 2022 wet season, the same was not necessarily true for the lower Mekong, particularly over the Tonle Sap. The image series in Figure X below focus on wetness anomalies in the Mekong Basin and actual wetness values observed by microwave satellites over the Lower Mekong floodplain from September through November. These months correspond to the greatest amount of expansion tracked by our Mekong Floodpulse Map and is inclusive of October, when peak expansion occurred. The Tonle Sap Watershed is identified with a brown line. Through every week of this period, extremely high wetness anomalies were observed over the Tonle Sap, particularly in the northwest and southwest portions of the Tonle Sap Watershed. Wetness of this nature can only come from sustained and significant levels of rainfall. That rainfall will eventually move into the Tonle Sap Lake and as such can be deduced as one driver of the 2022 Tonle Sap Expansion.
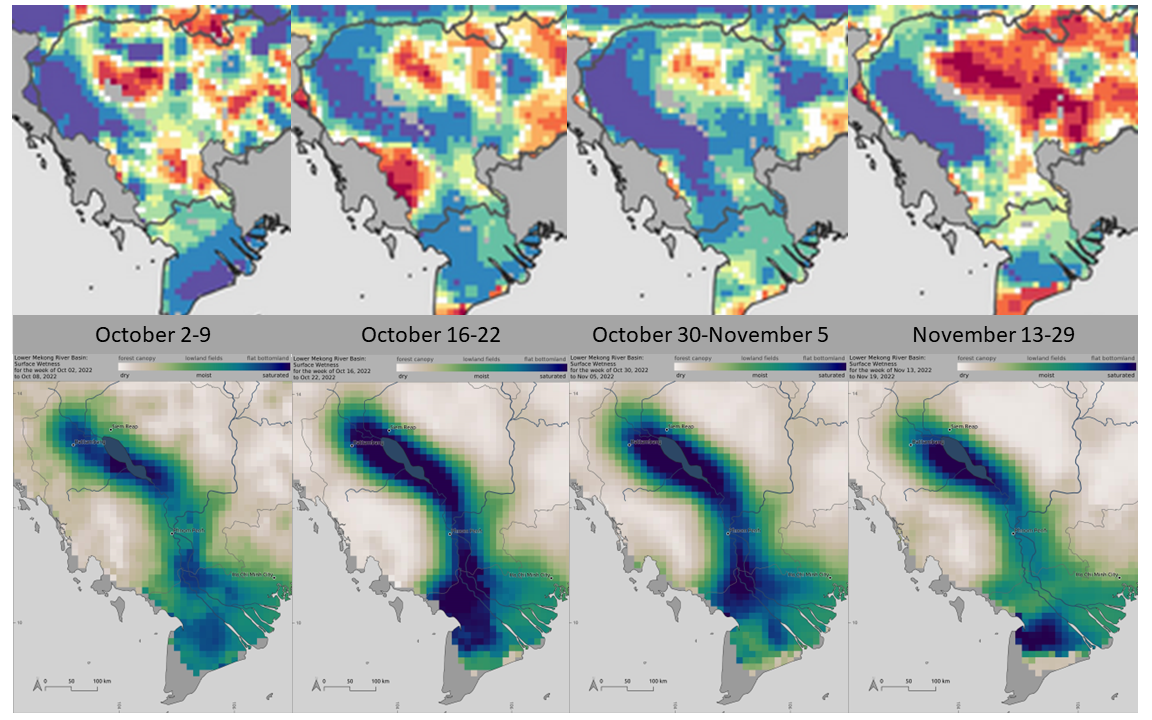
But if the Tonle Sap Lake was receiving so much water, one might assume that water in the lake would flow directly out into the ocean rather than cause the lake to expand given the extremely low reverse flow values tracked by the MRC. Yet, the lake indeed did expand. So, something much more dynamic must be happening to keep the water in the lake and to push the lake’s expansion over the course of several months.
In 2022, we also developed an analytical process which can powerfully explain much of this complexity. This method considers two sources of water for the Tonle Sap Expansion: Reverse flow from the Mekong mainstream and water originating from rainfall over the Tonle Sap watershed. The method takes actual observed wetness values and models how that wetness would manifest at a river gauge downstream under natural, unimpeded conditions. But instead of asking how would the Mekong flow without impediment of upstream dams, we asked how would the water that comes into the Tonle Sap watershed from rainfall enter the Tonle Sap River and flow under natural conditions without the presence of reverse flow from the Mekong? One way to think about this is how the water in the Tonle Sap River would flow directly to the ocean if it did not intersect with the Mekong mainstream at Phnom Penh.
Calculating and calibrating this model is complicated because it is necessary to find periods of the year where the Mekong mainstream is not influencing the Tonle Sap River. This rules out most of the wet season and even some of the early and late months of the dry season, leaving only the driest months of the dry season. After choosing the driest months of February through April, we then calibrated observed wetness values during this natural flow period to river levels observed at the Prek Kdam gauge, a MRC river gauge about 30km upstream from Phnom Penh. The resulting model has strong explanatory value accounting for 91% of the variability in river level at the Prek Kdam gauge over the calibration period. What we learned really helped explain how the Tonle Sap expanded in 2022 under unique circumstances. But before we look at 2022, let’s see how the model explains for normal reverse flow conditions by looking at 2004, a year in which the MRC reverse flow webpage suggests reverse flow tracked very close to normal (Figure Y).
In 2004, the yellow line shows a normal Mekong pulse where the river level at Prek Kdam rose from less than two meters in May to over eight meters in September. Looking at just the natural flow line (blue). Which models how much water would be present at the gauge without the influence of the Mekong, a much lower peak of just over 6 meters is observed. The difference between the two lines tells us something about reverse flow. When the yellow gauge line is above the blue natural flow line, there is water present at the gauge which originated from the Mekong—essentially the reverse flow. When the difference is large, then there is much more water from the Mekong present at the gauge. This difference is visualized as the grey shaded area close to the x-axis. Interestingly, the grey can tell us something about reverse flow going into the lake as well as when the reverse flow comes out of the lake. When the grey shape is increasing in value or rising (positive slope) then this marks the time when reverse flow is flowing into the lake. When the grey shape is decreasing (negative slope), then we are observing the reverse flow which went into the lake now leave the lake as a kind of “first in, first out” behavior.
Applying this logic, it is also possible to assume that when the blue natural flow line is above the yellow line, more water which originated from rainfall within the lake’s watershed is present at the gauge than reverse flow from the Mekong mainstream. This is observed as the black shape from March through May, when the lake is draining and has already lost its previous wet season’s reverse flow. But it is also present for a brief period in July, when any reverse flow that went into the lake during the month of June also drained out of the lake and the lake is sending its watershed’s flow back into the ocean. From this view it is possible to see that the Tonle Sap reversed its natural flow direction twice during 2004: once in June and a second time in August, at which point the reversal pushed enough water back into the lake to cause a robust expansion into the autumn months. The black shaded area (water which originated from rainfall in the Tonle Sap watershed) is significantly less than the grey shaded area (water which originated from the Mekong). Since comparatively little water which originated from rainfall in the lake’s watershed was present at the gauge during 2004, we can conclude that the lake retained the water which flowed into it as a result of rainfall. This concept is important to remember when looking at long term trends.
The time series in Figure Z shows the entire period of record when data is available to model Tonle Sap processes in this manner. Prior to 2007, the grey shapes are clearly larger than the black shapes year after year. Peak gauge observations are also relatively high with a few exceptions. In most of these years, robust reverse flow is observed, and the lake retains the water which came into it as a result of rainfall. But after 2007 the trend changes. In some years the black shapes are much larger than the grey shapes around them, and both the height of the grey shapes (the amount of reverse flow entering the lake) and the width of the grey shapes (the length of time reverse flow stays in the lake) are by and large reduced.
After 2007, the major change to Mekong hydrological flow was dam operations, starting with the 2008 operation of the Xiaowan Dam and then the 2012 operation of the Nuozhadu Dam in addition to numerous additional large storage dams in Laos. The data suggests a relationship between when major dam operations began to alter and reduce the natural wet season floodpulse and the amount and duration of reverse flow into the lake. As such, the data suggests a relationship between dam operations and the Tonle Sap Expansion. Wet season peaks during the post-2007 period are also notably lower through much of the record, with a few exceptions. 2022 is one of those exceptions.
So how can the model be applied to understand what happened in 2022? To recap, it is known that the MRC recorded a record low reverse flow in 2022. We have also established that the Tonle Sap Expansion was normal in size but peaked later than usual. And finally, we have established that rainfall over the lake’s watershed was higher than normal during the months of September to November.
Figure AA shows how as the Prek Kdam gauge water level (yellow line) rose from April through October, most water present at the Prek Kdam gauge originated as rainfall over the lake (the blue line is above the yellow line, and there’s more black than grey). After the gauge peaked in October, all of the water that came out of the lake had originated as rainfall over the lake. Data and logic suggest that the lake did not contract from April through October, even though most of the water present at the gauge during that time came from Tonle Sap rainfall. This is where the Mekong mainstream plays a critically important role. The blue (modeled natural flow) and yellow (actual observations at Prek Kdam) lines are rising together in a tight fashion, suggesting that although more water present at the gauge is from Tonle Sap rainfall, that amount is not much more than the water coming from the Mekong mainstream. This indicates that as the Mekong rises, it acts like a kind of wall of water which prevents Tonle Sap rainfall water from leaving the lake. Thus, as the Mekong mainstream rises, then so does the Tonle Sap expand from the intense rainfall over it. Under these conditions of zero to little reverse flow the Tonle Sap achieved a normal but late expansion.
Tonle Sap Accordion Effect
One final find comes from our weekly Lower Mekong Floodplain wetness product, which mirrors the findings of the floodpulse map using microwave data instead of radar imagery. During the early months of the 2022 wet season, these wetness maps revealed what we call an “accordion effect” of the reversal process. To provide context, the annual reversal is conventionally described as the Tonle Sap River reversing flow direction once in June or July and then resuming its normal flow direction sometime in the later wet season months. However, our wetness maps showed a unique phenomenon: the floodplain around the Tonle Sap River expanded and contracted several times between June and September, much like an accordion expands and contracts before the full expansion took off in late September and October.
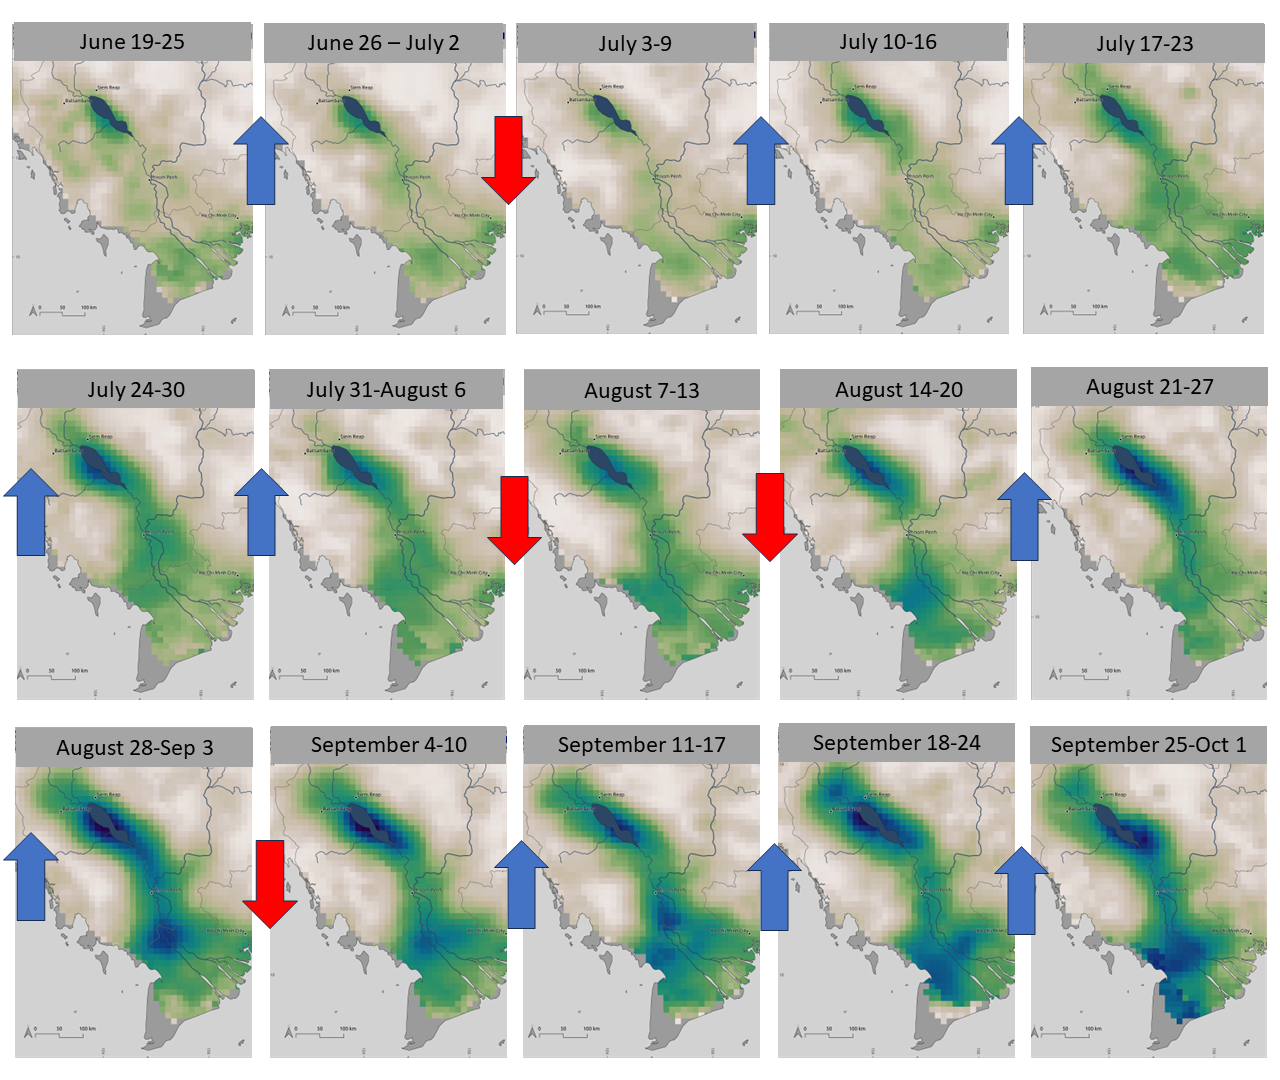
This contraction phase of this accordion effect happens when the Tonle Sap River resumes its normal flow towards the ocean, so this observation suggests the Tonle Sap River reverses direction several times during the course of a wet season before conditions are present to drive a long-lasting reverse flow from the Mekong mainstream into the lake. This accordion effect is driven by precipitation conditions, short bursts of storms followed by periods of dryness, but also it is likely driven by sudden restrictions of dams upstream. It is important to remember that dam operation patterns also follow a kind of accordion effect over the wet season by restricting and releasing flow at determined intervals over the course of the wet season to both store water and produce hydropower.
Recommendations:
- An adaptive management plan for dam operations is needed to maximize the Tonle Sap Expansion and minimize impacts of flow restrictions. Between MDM data and other available data from the MRC and Cambodian authorities, there is enough data to conduct a study of how dam impacts change the Tonle Sap Expansion and reverse flow phenomenon. It is also possible to conduct a multi-factor analysis which incorporates the impacts of land use changes, fishing practices, sediment removal, dam operations, climate change, water quality and other factors on the health of the Tonle Sap fishery and develop an adaptive plan to conserve the Tonle Sap fishery through mitigation efforts. There is no better time than the present to conduct this study given the existential contributions of the Tonle Sap to Cambodia’s economy and social cohesion, not to mention its contributions to other Lower Mekong countries. Effective mitigation efforts would need to occur at the transboundary level, given the change the operations and impacts of upstream dams in China, Laos, Thailand, Vietnam, and Cambodia deliver to the Tonle Sap Lake.
- Prioritize conservation of the Tonle Sap Watershed. More study is needed to determine the importance of Tonle Sap tributary contributions to the wet season expansion process, particularly during low flow wet seasons. The 2022 wet season revealed a unique phenomenon of rainfall over the Tonle Sap basin as a key driver, if not the main driver, of a successful Tonle Sap Expansion. The Tonle Sap’s tributaries are understudied and are also being exploited at an alarming rate by the construction of small and medium-sized dams and irrigation canals used for various purposes. These structures will, without a doubt, impact the Tonle Sap’s hydrological system. Smart operation of these dams and avoidance of future dams are required until the water contributions of this critical watershed are better understood.
- Reduce restrictions at large dams during the months of July and August in order to promote a more normal Tonle Sap Expansion. Data show the largest dams in the Mekong typically restrict the most water during the initial months of the wet season and then moderate restrictions in September and October. These operations remove important components of early wet season flow from the Mekong system and reduce the ability of the Tonle Sap River to experience sustained and robust reverse flow in July and August. If water restrictions must happen, then an operation pattern of smoother restrictions over the whole of the wet season to achieve desired reservoir levels could provide for a normally timed and normally robust Tonle Sap expansion, but this should be further demonstrated by further research and analysis.
Dam Impacts in the Transboundary 3S Basin:
In June 2023, our team published the “Analysis of Hydropower Impacts in the Mekong’s 3S Basin,” a technical report which shows how 20 dams in Vietnam, Laos, and Cambodia are changing the hydrological flows of the 3S Basin and the Mekong River with focus on changes from 2016 to 2022. The section below summarizes key findings and recommendations of that report and also provides new analysis not published in that report comparing the impacts of the twenty 3S dams to China’s upstream dams on the Mekong mainstream. This study was groundbreaking because it showed how the operation of previously unstudied dams were impacting the Sekong, Sesan, and Srepok Rivers – three transboundary river basins running through Laos, Vietnam, and Cambodia collectively known as the 3S Basin. The 3S Basin provides the Mekong with around 20% of its annual flow, and its relative proximity to the Tonle Sap Lake means alterations to hydrological flow and fish migration patterns in the 3S can have a potentially outsized impact on the Mekong fishery.
Our study used satellite-derived data to determine how the 20 largest dams in the 3S system were operated. The map above shows the name, location, and active storage estimates for each of those dams. Hover your mouse over the dam name in the interactive map below for detailed information on each dam, including operations estimates from 2016 to 2022.
We estimate the total active storage of the twenty 3S dams at around 6.6 cubic kilometers. To put this into perspective, China’s two largest dams Xiaowan and Nuozhadu each hold more than 11 cubic kilometers, which suggests in the simplest manner that Xiaowan and Nuozhadu can each have much more influence over mainstream Mekong outcomes than dams in the 3S Basin. When comparing groupings of dams by sub-basin or location (Figure CC), active storage in the 3S Basin ranks third behind China’s 11-dam cascade on the mainstream and the two large dams in the Nam Ngum sub-basin in Laos. Notably, the 3S dams do hold more water than the seven large hydropower dams in Northeast Thailand’s part of the Mekong Basin. We also determined that five of the 3S dams rank within the top sixteen largest dams in the Mekong in terms of active storage (Figure DD). Two of those are in Laos (Xekaman 1, Xepian-Xenamnoy), one is in Cambodia (Lower Sesan 2), and two are in Vietnam (Plei Krong, Buon Tarah).
The Hydropeaking Problem in the 3S Basin
A key find of the study is that hydropeaking operations from a cascade of dams in Vietnam on the Upper Sesan have introduced significant daily and weekly fluctuations to Sesan River flow regardless of the season, and this has likely severely changed ecological systems within the Sesan Basin. Hydropeaking is a method of operating a dam by releasing and restricting flow at sudden or erratic periods to generate a maximum amount of electricity during the time of day when electricity is most needed. This causes the river level to fluctuate significantly throughout the day, causing an erratic flow pattern downstream which is extremely damaging to aquatic habitats and riverine ecologies. In the worst cases, sudden releases of water can cause flash flooding downstream. In the Sesan, hydropeaking can be recognized simply by looking at dry season data provided by the MRC gauge on the Sesan River. To see this gauge data and take a deeper dive into the history of hydropeaking in the 3S, click here.
The Impact of this hydropeaking is severe enough to merit mitigation or early warning to downstream communities in Cambodia when reservoirs suddenly release significant flow for hydropower generation or in cases of emergency drawdown. A recent example of this need for early warning occurred in late April 2023, when upstream dam hydropeaking operations in Vietnam caused a stretch of the Sesan River in Cambodia to go nearly completely dry (Figure EE) for a short period of time. No warning was provided to downstream communities, where massive fish kills were reported among other negative impacts.
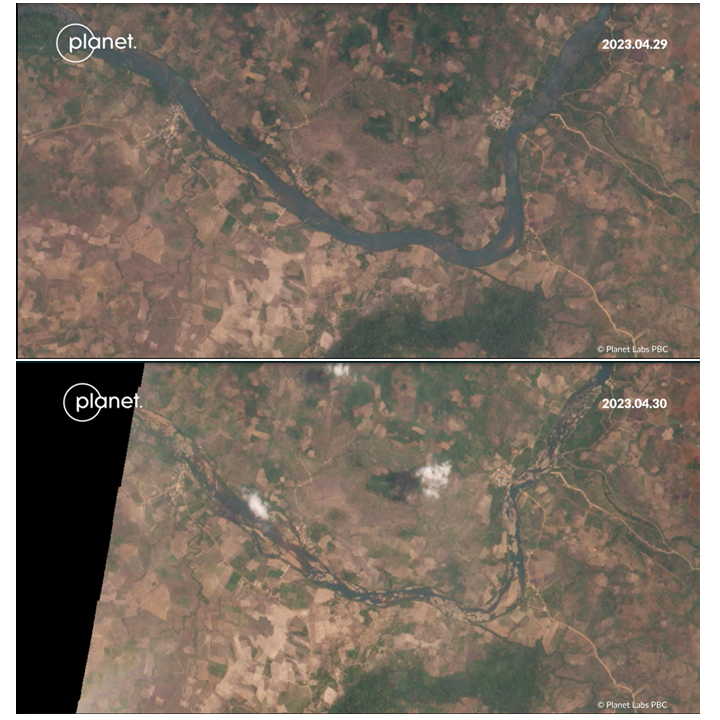
Hydropeaking effects and daily/weekly fluctuations are also observed in the Sekong and Srepok Basin, but at lower degrees of intensity compared to the Sesan. These hydropeaking effects carry on to the confluence of the 3S and the Mekong Mainstream and thus also influence Mekong Mainstream wetland processes and fish habitats near and downstream of the confluence. Recommendations to mitigate the negative impacts of hydropeaking are listed at the end of this section.
How do dams impact seasonal flows in each 3S River?
Figure FF shows that active storage changes related to hydropower production in each of the three river systems are already creating a measurable alteration of seasonal flow. Similar to other parts of the Mekong, the data shows that the largest dams restrict flow during the wet seasons to recharge their reservoirs and then release their storage during the dry season to produce hydropower, and this artificially raises the level of the rivers to varying degrees. This can be observed by the peak and valley patterns in the figures below for each of the rivers. A high active storage level is always achieved during the wet season (peak) while a low level is reached during the dry season (valley). Importantly, peak active storage estimates currently observed in the Sekong and Sesan are nearly five times that of the Srepok.
Hydropower dam operations wield the most influence over seasonal flow outcomes in the Sekong and Sesan. Good gauge data is not available from the MRC or governments of Laos or Cambodia for the Sekong River, so it is not possible to conduct a specific analysis of dam impacts on Sekong flow. However, if the Sekong’s mean wet season flow volume (34.62 km3) is compared to the highest observed active storage for dams in the Sekong (2.78 km3 in 2022), then it is possible to infer that Sekong dams could reduce flow by 8% during the wet season. Mean dry season flow for the Sekong is estimated at 5.3km3, so the highest observed dry season release (1.99 km3 in 2022) could possibly increase dry season flow by 37%.
Reliable gauge data is available for the Sesan and Srepok Rivers, making it possible to estimate actual seasonal and monthly impacts of dams. Among notable findings is that in 2020, the lowest flow year on record for the Mekong, Sesan dams increased Sesan dry season flow by 13% and reduced Sesan wet season flow by 6%. The charts below show how effects in individual months during the dry and wet season of 2020 were even greater. Figure GG shows how dry season releases in January and May increased flow by more than 30% and March releases increased flow by 52%.
Figure HH shows how wet season dam restrictions in October 2020 reduced flow in the Sesan by 27%. Each of these additions or subtractions to the natural flow of the Sesan have profound effects on the river’s core ecology and livelihoods of communities living along the river’s course.
How do 3S Dams Impact the Mekong Mainstream?
We also find the seasonal operations of all dams in the 3S Basin can increase total Mekong Basin dry season flow to Stung Treng by at least 7% and reduce total Mekong Basin wet season flow to Stung Treng by at most 1.42%, with much greater variance at smaller timescales. These impacts are much less when compared to China’s operations at a seasonal level, but 3S dam operations can be as or even more impactful on a monthly basis and thus likely on smaller units of time as well.
Figure II identifies which portions of dry season flow to Stung Treng came from 3S dam releases, China’s dam releases, and a combination of natural flow and other unidentified dam releases upstream. China’s dams (light blue) have multiples greater effect than the 3S dams (mid-blue) across the dry seasons of 2018 to 2022, yet together they combine for significant flow increases of 35-40% or more during the driest years. When drilling down to the lowest flow year of 2020 (Figure JJ), the combined impacts are even more profound such as in March, when the river was 53% higher than it should have been and when 3S dam releases (28.52%) eclipsed China’s (25.1%) impact on flow. Importantly the right figure also reveals that the natural dry season low point would have occurred sometime in March 2020, but dam releases shifted the low point of the dry season earlier by one month. This temporal shift in dry season lows is also observed in other years across the dataset.
Looking at wet season impacts the reduction of flow from China’s upstream dams is also multiples more than the 3S, with the greatest differences occurring in 2020 (left-side figure below) when China’s upstream dams reduced wet season flow to Stung Treng by 7.65% and 3S dams by only 1.19%. Yet, as similarly observed during the dry season, 3S dam restrictions to the Mekong can be as profound as China’s on a monthly (and likely weekly and daily basis) depending on how dams are being operated. For example, as shown in Figure KK, in September 2019 the 3S dams had a greater monthly reduction of flow (1.74%) than China’s dams (1.45%). Yet Figure LL show months where China’s monthly wet season reductions can be huge, such as in October 2019 when China’s dams were estimated to cause a 22.89% reduction in flow even as far south as Stung Treng.
Recommendations
Our “Analysis of 3S Basin Dam Impacts” study comprehensively examines how operations of 20 dams throughout the 3S system are changing hydrological cycles within the 3S rivers and the Mekong as a whole. Data gaps in the Sekong Basin present challenges to measure specific hydrological impacts and these challenges translate through to impact other aspects of this study. However, data is robust enough to conclude that dry season releases from seasonal storage dams are delivering a measurable increase of river flow and wet season restrictions from the same dams are delivering a measurable decrease of river flow, with the greatest effects in the Sekong and Sesan basins. Hydropeaking operations throughout the system, but most noticeably on Vietnam’s cascades on the upper Sesan and upper Srepok, are causing severe fluctuations of downstream river flow observable in daily and monthly data. The data suggests that operations of seasonal dams and hydropeaking dams are determined with little to no consideration of downstream ecosystem impacts or early warning for sudden releases of water which can cause flash floods. Giving these findings, we make the following recommendations.
- Authorities in Cambodia and the Mekong River Commission should restore physical gauge reporting at the Siempang gauge on the Sekong River. No daily discharge data is available for this gauge after 2012. The Sekong River is responsible for approximately 10% of total Mekong annual flow and needs proper infrastructure to monitor its hydrological conditions in real time given its importance. Additionally, a gauge located on the composite 3S River below the confluence of the Sekong and Sesan and before the river enters the Mekong mainstream would be useful to measure and study total 3S Basin discharge and flow alteration from upstream dams.
- The use of dams for hydropeaking purposes is damaging to communities and ecosystems downstream. Measures such as adjusting operations of the most downstream dam in a cascade to emulate natural flow or reduce severe and sudden alterations of flow can mitigate the effects of hydropeaking. Re-regulation dams can be built for this purpose as well. Effective early warning systems are needed at the transboundary scale to communicate when hydropeaking operations or sudden reservoir drawdowns due to emergency management procedures at the dam site release water that can cause a flash flood in communities downstream. This is necessary in all 3S Basins as well as on their tributary rivers which have communities living below and between dams.
- To maximize downstream fishery productivity and agricultural production, minimum and maximum flow thresholds for seasonal storage dams should be determined in order to reduce the impacts dams deliver to seasonal flow regimes. Importantly, these flow regimes should be respected during wet seasons which are anomalously dry. In these times of wet season drought, dam operations can support a crisis management plan to increase flow during the wet season instead of reduce it and exacerbate drought.
- The data suggests that 3S dams can reduce monthly wet season flow for the Mekong mainstream to Stung Treng, Cambodia by more than 3%. This 3% flow reduction is on top of flow restrictions from dams upstream which can cumulatively reduce flow by 10-20%. The data also suggests that 3S dams can increase monthly dry season flow of the Mekong mainstream by at least 22%. Vietnam is unlikely to build more large dams in its upstream portions of the 3S Rivers, but Laos and Cambodia do have plans for significant hydropower expansion. If newly developed dams have significant active storage, then the mainstream Mekong flow reductions and increases above will worsen. Acceptable limits for flow alteration to the Mekong mainstream at the monthly and seasonal levels should be determined and agreed upon prior to the buildout of new dams if a robust wet season flood pulse is to persist.
What’s New on the MDM (June 2022-May 2023)
Mekong Floodpulse Map
This biweekly product tracks the Mekong Floodpulse by the current observed area of inundation (km2) in the Lower Mekong Floodplain and comparing it to normal seasonal inundation based on an annual mean flow pattern observed at the Prek Kdam gauge from 1912-2007. Along with the full-field wetness map of the Mekong floodplain (below), it is the first satellite mapping product of its kind to track the Tonle Sap Expansion in near-real time. A single map gives insight into the relative intensity of the floodpulse, and by looking at the maps in a time series it is possible to determine whether the floodpulse is ahead or behind schedule. The timing and intensity of the floodpulse can be used to predict water availability in the Mekong floodplain throughout the year, as well as give some indication to the robustness of the fish population and seasonal agricultural yields in Cambodia and Vietnam’s Mekong Delta. The most recent Mekong Floodpulse Maps can be found on the MDM Home Page and a catalogue of previous maps can be found on the MDM’s “Compare Maps and Data” tab. The Floodpulse product was developed by the Stimson team using proceeds from winning the 2021 Prudence Foundation Safe Steps Disaster-Tech Award.
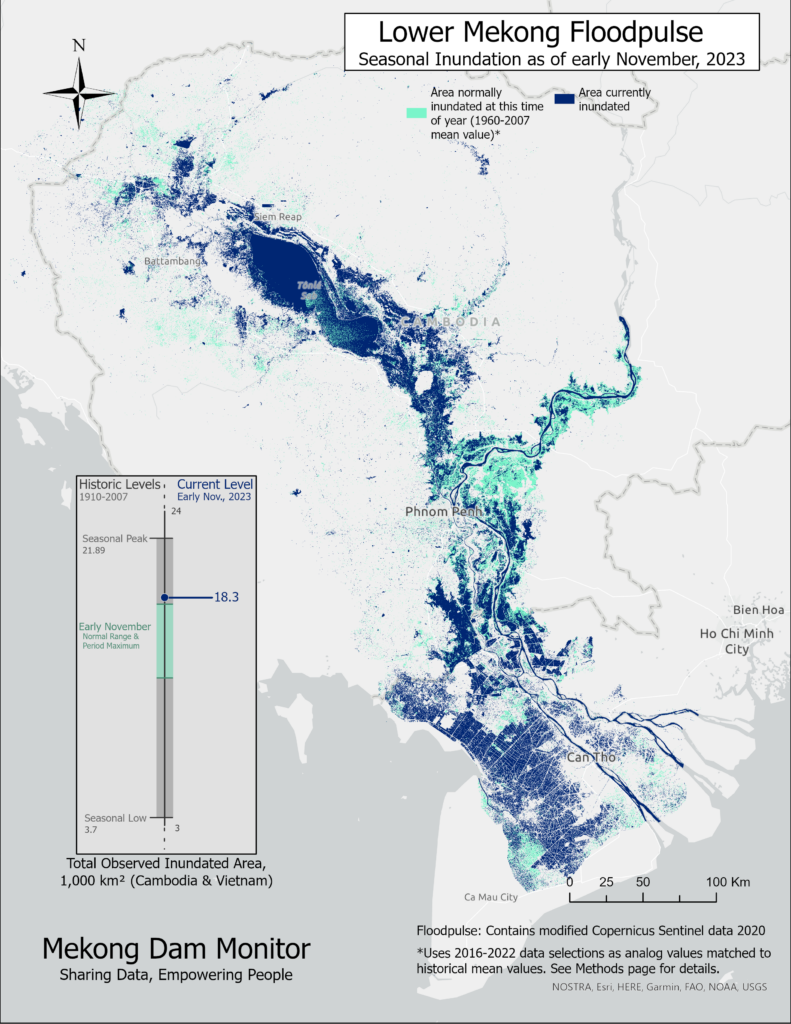
Full-field Wetness Map of the Lower Mekong
Along with the Mekong Floodpulse Map (above), it is the first satellite mapping product of its kind to track the Tonle Sap Expansion in near-real time. Analysis of these maps can also provide insight into water availability throughout the year and indicate the robustness of the Mekong fish population and seasonal agricultural yields. The most recent full-field wetness maps can be found on the MDM Home Page and a catalogue of previous maps can be found on the MDM’s “Compare Maps and Data” tab. This product was developed by the Eyes on Earth team using proceeds from winning the 2021 Prudence Foundation Safe Steps Disaster-Tech Award.
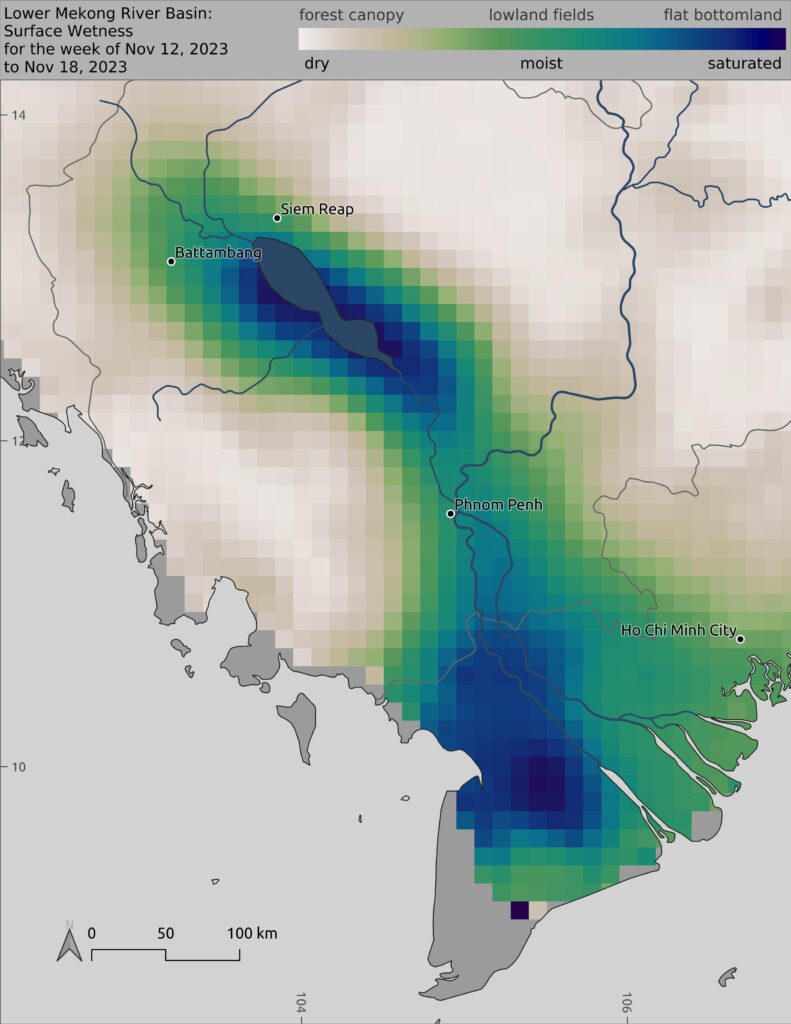
Prek Kdam Natural Gauge
This model answers questions relevant to Tonle Sap expansion processes. It can provide insight on whether water is draining out of the Tonle Sap Lake or whether reverse flow is moving into the Tonle Sap Lake from the Mekong mainstream. The model also provides insight on whether water which originated from the Mekong is driving the Tonle Sap expansion or whether the Tonle Sap is expanding as a result of intense rainfall over the Tonle Sap watershed. The model provides evidence that after the Xiaowan Dam (the first large storage dam on the Mekong mainstream) became operational in 2008, its seasonal operations began to affect the Tonle Sap expansion. After this, the impacts of additional large dams have changed the intensity and timing of the Tonle Sap expansion. To learn more about this model, please read the Tonle Sap Deep Dive above. The Prek Kdam Natural Gauge model can be found on the MDM “Natural River Flow Models” tab. This product was developed by the Eyes on Earth team with support from the USAID Wonders of the Mekong Activity
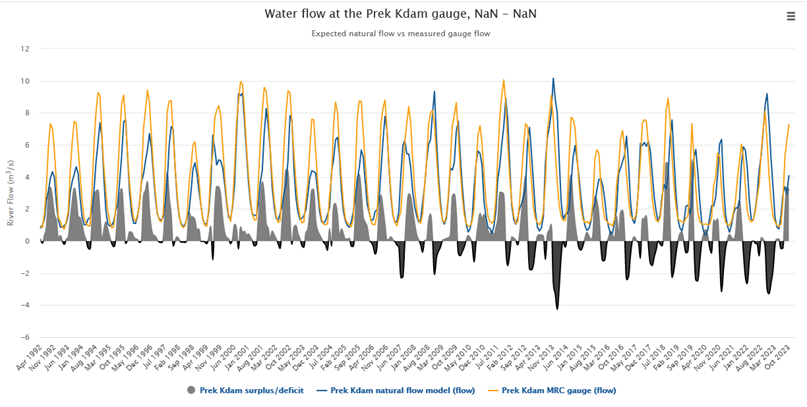
New Cascade Analysis
This interactive cascade analysis product replaces our previous static cascade analysis product and expands to include analysis of several cascades. Cascade analysis provides insight into the degree to which series of dams (often built in a row from upstream to downstream hence the term “cascade”) are operated in coordination. It is possible to gain understanding of when the most and least amount of water is available in the cascade and also among individual dams. One can also understand the size of water storage of dams in a cascade relative to other cascades. Currently, cascade analyses for the Lancang Basin (China’s 11 mainstream dams), the 3S Basin (20 dams), and individual analysis for the Sekong (9 dams), Sesan (7 dams), and Srepok Basins (4 dams) can be viewed on the MDM Cascade Analysis tab. Users can toggle on-off individual dams and zoom in on particular time periods. Users can download storage time series data for entire cascades or individual queries. Data is compiled using virtual gauge data and data provided by Thai, Lao, and Vietnamese official data portals. This product was developed by the Stimson Team with support from the USAID Wonders of the Mekong Activity.
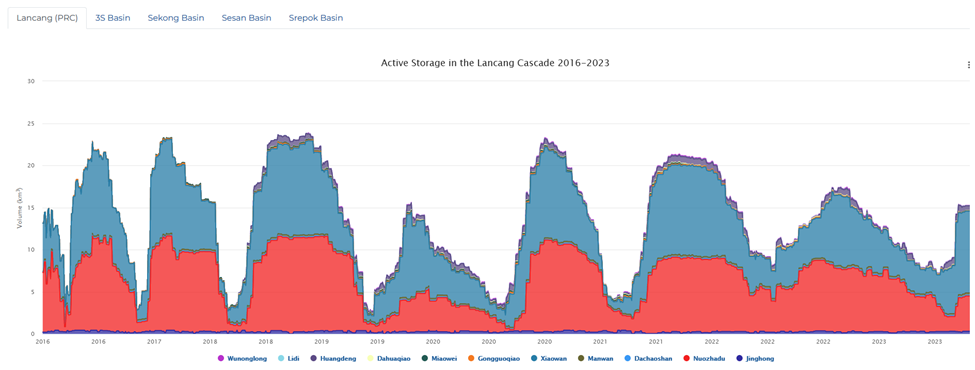
Real-time monitoring of 11 additional dams in the 3S Basin
We added 11 new dams in the 3S basin to the Mekong Dam Monitor in 2023, full details for which can be accessed on the Virtual Gauges tab and seen in Cascade Analysis. This product was developed with support from the USAID Wonders of the Mekong Activity.
Studies, Op-eds, Testimonies
Studies and Testimonies
- Analysis of Hydropower Impacts in the Mekong 3S Basin
- Delivering on Vietnam’s COP26 Commitments
- Mekong River Agency Must Step Up
- Testimony Before the House Subcommittee on Asia, the Pacific, Central Asia, and Nonproliferation on Benefits and Opportunities for United States Foreign Policy Programming in the Mekong Region
Online Webinars
- Where’s the Water Wet Season 2022
- Where’s the Water Dry Season 2023
- Mekong Water Data Hour: Flooded Forests
- Mekong Water Data Hour: Sandmining
- Mekong Water Data Hour: How Dams Impact the Mekong Delta
- Mekong Water Data Hour: Dam Impacts in the 3S Basin
- How a smart “away game” can save the Mekong Delta
Major Media Mentions
What’s Next for the Mekong Dam Monitor?
The Mekong Dam Monitor will continue its regular activities over the 2023 wet season-2024 dry season cycle and provide a report similar to this one after the conclusion of the 2024 dry season. A new set of activities for this period will send the Mekong Dam Monitor team to the Mekong region to engage local institutions and organizations with capacity building programs to teach people in the Mekong how to produce similar analysis and satellite derived products. We are actively looking for new partners for new studies and/or the production of new products and services at varying scales. We are specifically interested in identifying dam impacts to the Tonle Sap Expansion (among other factors), gaining a better understanding the relationship between dam impacts and the Tonle Sap fishery, and conducting an analysis of climate trends in the basin.
Over the next year we will also expand our near-real time analysis of monthly impacts of dams at the Chiang Saen, Vientiane, Nakhon Phanom, Pakse, and Stung Treng gauges. We will consider downscaling to weekly analysis and could possibly publish this information within the next year. We find the recent publication of dam operations data by the Lao PDR Ministry of Energy and Mines (MEM) on its Facebook page particularly interesting and will work to incorporate information about more than 20 previously understudied dams now reported by MEM into the MDM platform.
The coming year will see continuations of the Mekong Water Data Hour series and our flagship Where’s the Water Seasonal webinars.
Acknowledgements
The authors are grateful to the Mekong-U.S. Partnership and the Chino Cienega Foundation who have supported the efforts of the Mekong Dam Monitor from day one. We are also grateful to the USAID Wonder of the Mekong project which provided support for the work on the Tonle Sap and 3S Basin summarized in this report. This report goes through a rigorous peer review process, and we express thanks and gratitude to reviewers’ invaluable feedback which has made this report a more effective product. Lastly, we are thankful for official data on river conditions and dam operations provided via publicly available portals by the Mekong River Commission and government agencies in Thailand, Vietnam, and the Lao PDR.

