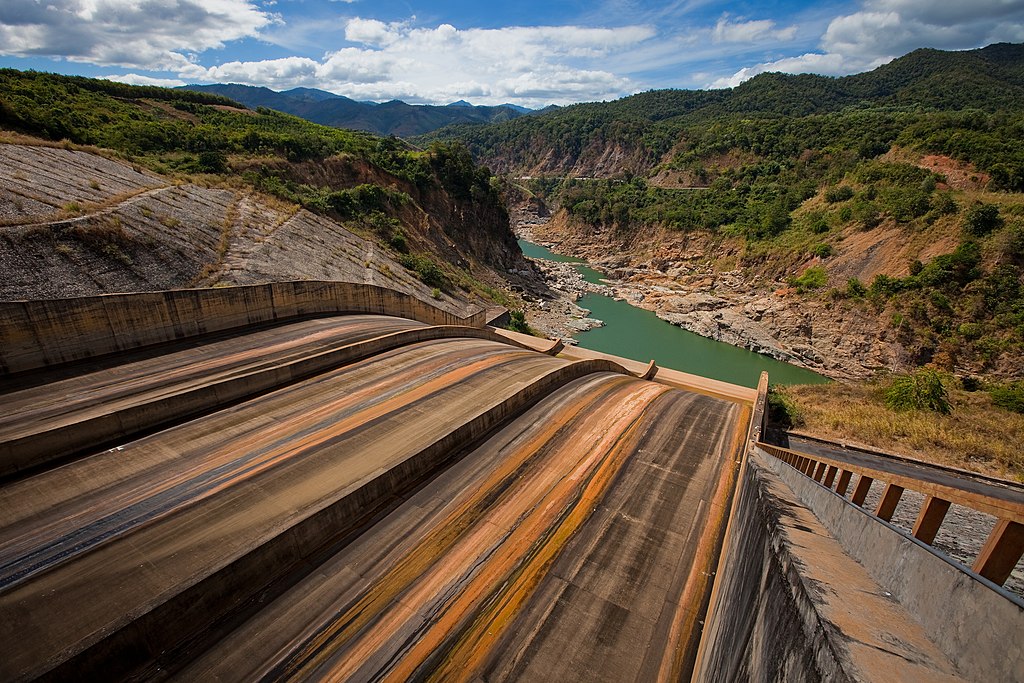
Share:
The 3S Basin is one of the largest tributary basins of the Mekong system. It contributes around 20% of the river’s annual flow. Over the last three decades, hydropower dams have been built in each of the 3S rivers (Sekong, Sesan, and Srepok), yet little is known about how the operations of these dams alter the Mekong’s flood pulse. These transboundary rivers run through Vietnam, Laos, and Cambodia and because of their proximity to Cambodia’s Tonle Sap Lake and Vietnam’s Mekong Delta, they provide important environmental services to the Mekong’s robust fisheries and agricultural sectors. This report uses satellite imagery to, for the first time ever, estimate the impacts of 20 large dams in the 3S Basin.
Executive Summary
This study analyzes how hydropower dam operations are altering the hydrological regime of the 3S River system in the Mekong Basin. The 3S River System is one of the largest tributary systems of the Mekong Basin and is often described as providing the Mekong Basin with about 20% of its annual flow. It is formed by three transboundary river systems: the Sekong, which rises in Vietnam and flows through southern Laos and northern Cambodia and the Sesan and Srepok Rivers which both rise in Vietnam and flow through northern Cambodia. The three rivers join in Stung Treng Province, Cambodia before flowing into the Mekong at the city of Stung Treng.
Like most tributary systems throughout the Mekong Basin, this hydrological regime is driven by monsoonal rains which typically occur during the wet season months of June through November. The 3S System’s wet season contribution to the overall Mekong Basin is an important driver of the Mekong’s seasonal flood pulse, which engenders ecological processes in Cambodia’s Tonle Sap Basin and the transboundary Mekong floodplain-delta system shared by Cambodia and Vietnam. Its location in the downstream portion of the basin and relative proximity to the Tonle Sap Lake, the world’s most productive lake fishery for a single body of water, also makes the 3S Basin a critical pathway for ecological flows such as fish migration and sediment transport.
The geographic and hydrological features of the 3S Basin have been widely researched, but the impacts of hydropower dam operations on the 3S system and the wider effect on Mekong mainstream flow have so far been understudied. In this study, we use remote sensing data and GIS processing to estimate the individual and cumulative impacts of 20 dams built throughout the 3S system from 1990 to the present. We place specific focus on the operations of those dams between 2017 and 2022 because remote sensing data is most robust from 2017 onward.
Our analysis finds that active storage changes related to hydropower production in each of the three river systems is already creating a measurable alteration of seasonal flow. The data show the largest dams restrict flow during the wet seasons to recharge their reservoirs, and then the dams release their storage during the dry season to produce hydropower and this artificially raises the level of the rivers to varying degrees. Hydropower dam operations are wielding the most influence over the Sekong’s and Sesan’s seasonal flow regimes.
Further, hydropeaking operations from a cascade of dams in Vietnam on the Upper Sesan have introduced significant daily and weekly fluctuations to Sesan River flow regardless of the season, and this has likely severely changed ecological systems within the Sesan Basin. The impact is severe enough to merit mitigation or early warning to downstream communities in Cambodia when reservoirs suddenly release significant flow for hydropower generation or in cases of emergency drawdown. Hydropeaking effects and daily/weekly fluctuations are also observed in the Sekong and Srepok Basin, but at lower degrees of intensity compared to the Sesan.
We also find the seasonal operations of all dams in the 3S Basin can increase total Mekong Basin dry season flow to Stung Treng by at least 5.84% and reduce total Mekong Basin wet season flow to Stung Treng by at most 1.48%, with much greater variance estimated at smaller temporal scales. Further, daily and weekly fluctuations to river flow introduced by hydropeaking dams also carry through to the confluence of the 3S River at the Mekong mainstream and introduce unnatural variability to Mekong River flow.
The following sections analyze and discuss how the active storage estimates and other indicators above were derived and how the operations of the twenty 3S dams analyzed in this study are changing hydrological flow regimes downstream. This report provides a brief overview of the ecological and social value of the 3S Basin followed by a summary of dam development, followed by policy and planning recommendations. Subsequent sections analyze how dams in each river basin are changing the hydrological flow of their respective river and then how all dams in the 3S Basin are changing 3S flow with some analysis of the impacts to Mekong mainstream flow at Stung Treng, Cambodia.
Background
Why the 3S Basin Matters
The transboundary 3S Basin is often cited as providing the Mekong Basin with around 18-20% of its annual discharge, which is particularly significant since the 3S Basin covers only 10% of the Mekong Basin’s total area. Historical discharge data (1965-present shown in Figure 1) from the MRC’s data portal suggest the 3S Basin flow contributions make up 21.53% of total Mekong annual discharge to Stung Treng, with higher contributions in the dry season (31.62%) and slightly lower contributions in the wet season (20.39%).1Methods for calculating sub-basin flow contributions: We use data from the Mekong River Commission (MRC) for each of the three subbasins to construct total annual and seasonal flows to demonstrate the 3S Basin’s contribution to mean annual and seasonal Mekong flows at the Stung Treng gauge. We also use a long-term average of Stung Treng volume data from 1912 to 2007 and exclude data for annual and seasonal flow after 2007, at which point the largest dams upstream began to fill and alter seasonal flow via their operations. Finally, MRC flow data is much scarcer for the Sekong River in comparison to flow data for the Sesan and Srepok rivers: complete daily discharge data for only two of years are available on the MRC data portal for the Sekong Basin from 1965 to the present. As such, the derivation processes for mean annual and seasonal flow estimates are described in the Sekong River section below, as is the specific time series used to calculate mean annual and seasonal flow for each 3S River. Importantly, the dry season and wet season mean values above are calculated using a range of data from 1965 to 2022. which includes the years after the largest dams began operating. It is not possible to assess reliable seasonal mean flow estimates prior to the impact of dams in the early 2000s given the scarcity of flow data. Our calculations could thus understate the basin’s contributions as it may inflate the mean dry season contributions relative to natural flow due to inclusion of hydropower dam releases during the dry seasons, and subsequent wet season dam restrictions of flow very likely is pulling down mean wet season contributions relative to natural flow. More of this is discussed below.
Examining the individual flow contributions of the Sekong, Sesan, and Srepok, the data suggest the Sekong Basin produces the highest mean annual flow (44%) with 39.92 km3, nearly 50% higher than Sesan mean annual flow (Figure 2. The Sesan, however, contributes the most mean dry season flow (42.97%) and the Sekong produces the most mean wet season flow (45.85%). These flow calculations are also inclusive of a time period when dam operations are influencing seasonal flow through dry season releases for hydropower production and wet season flow restrictions to recharge reservoirs.
IUCN’s Atlas of the 3S Basin provides insight into why the 3S Basin is an important ecological watershed for both the 4.4 million people who live there and also for Mekong communities downstream who rely on the 3S’s contribution to the Mekong flood pulse for fisheries and agricultural production2Atlas of the 3S Basins: The Sekong, Sesan and Sre Pok Trans-boundary Basins. IUCN, 2014. https://portals.iucn.org/library/node/46373. Wetlands form buffers along parts of the Sekong, Sesan, and Srepok in Cambodia, and as the landscape flattens out near Stung Treng these wetlands expand in area. These wetlands provide important natural habitats for a variety of freshwater birds, turtles, and other species. For communities, wetlands provide natural benefits such as reducing flood damage, providing clean water and food for local residents, and space for flood-retreat agriculture.3Ibid. p 20
The Lower Sesan 2 reservoir inundated a substantial portion of the lower Sesan and Srepok riverine wetlands when it filled in 2018. The 3S Basin historically formed a critical habitat for megafishes and migratory species.4Campbell, T.; Pin, K.; Ngor, P.B.; Hogan, Z. Conserving Mekong Megafishes: Current Status and Critical Threats in Cambodia. Water 2020, 12, 1820.] 329 species of fish are found in the 3S Basin.5Atlas of the 3S Basins: The Sekong, Sesan and Sre Pok Trans-boundary Basins. IUCN, 2014. https://portals.iucn.org/library/node/46373 p 40 These fish species and their migratory pathways are threatened by a lack of fish mitigation pathways in dams built throughout the basin. The only dam with a fish passage is the Lower Sesan 2, and this pathway has been assessed by third party experts as extremely inadequate for the volume and diversity of fish species that need to use it.6https://www.hrw.org/report/2021/08/10/underwater/human-rights-impacts-china-belt-and-road-project-cambodia As such, a new study demonstrates migratory fish could be shifting migration patterns from the Sesan-Srepok Basin into the Sekong Basin now that the confluence of the Sesan and Srepok is blocked by the Lower Sesan 2 Dam and the headwaters are dammed with cascades.7Sor R, Ngor PB, Lek S, Chann K, Khoeun R, Chandra S, Hogan ZS, Null SE. Fish biodiversity declines with dam development in the Lower Mekong Basin. Sci Rep. 2023 May 26;13(1):8571. doi: 10.1038/s41598-023-35665-9. PMID: 37237013; PMCID: PMC10220217. https://pubmed.ncbi.nlm.nih.gov/37237013/ One of the signals which triggers fish migration in the basin is the natural flood pulse, so any alteration of natural flow in the 3S basin by dams will likely affect fish migration behavior.8BARAN Eric (2006) Fish migration triggers in the Lower Mekong Basin and other tropical freshwater systems. MRC Technical Paper No. 14, Mekong River Commission, Vientiane.
Capture fisheries are critically important food sources to communities throughout the 3S Basin. Locally, mean per capita fish consumption is highest in the Sekong Basin, with around 45 kg of fish per year, followed by 35 to 45 kg per year in Cambodia’s Sesan and Srepok Basins9Atlas of the 3S Basins: The Sekong, Sesan and Sre Pok Trans-boundary Basins. IUCN, 2014. https://portals.iucn.org/library/node/46373; p 40 Cambodia per capita fish consumption is 63 kg per year according to World Fish: https://worldfishcenter.org/where-we-work/asia/cambodia. Fish consumption is lower in Vietnam’s headwater areas at approximately 25-35 kg per year.10Atlas of the 3S Basins: The Sekong, Sesan and Sre Pok Trans-boundary Basins. IUCN, 2014. https://portals.iucn.org/library/node/46373 p 40 This data was determined prior to the filling of the Lower Sesan 2 dam, so further studies are required to understand how this dam has altered fish catch and fish consumption patterns in the Sesan and Srepok Basins.
Finally, the 3S Basin’s natural flow regime acts as a critical driver of the annual Mekong flood pulse, which drives fisheries and agricultural production for 35 million people across Cambodia’s floodplain and Vietnam’s delta. The Tonle Sap receives water from the Mekong mainstream each wet season with 3S contributions as a key portion (20-25%)11Null SE, Farshid A, Goodrum G, Gray CA, Lohani S, Morrisett CN, Prudencio L, Sor R. A Meta-Analysis of Environmental Tradeoffs of Hydropower Dams in the Sekong, Sesan, and Srepok (3S) Rivers of the Lower Mekong Basin. Water. 2021; 13(1):63. https://doi.org/10.3390/w13010063, causing it to expand to five times its dry season area and increase 60 times in volume. This expansion is a critical element which makes the Tonle Sap the world’s most productive inland fishery, with around 500,000 tons of fish caught per year, a majority of Cambodia’s annual catch.12https://www.conservation.org/projects/tonle-sap-lake-conserving-cambodias-fish-factory For perspective, all of North America’s rivers and lakes combined produce 160,000 tons of fish annually on average.13FAO stats; cite FAO These fisheries are critically important for Cambodia, providing its people with 60-70% of their annual animal protein intake14https://www.wwf.org.kh/projects_and_reports2/sustainable_use/community_fisheries/. The Mekong’s flood pulse also creates favorable conditions for robust agricultural production in Cambodia and Vietnam. Vietnam’s Mekong Delta provides Vietnam with 50% of Vietnam’s rice crop and 90% of Vietnam’s rice export crop, which contributes 16% of Vietnam’s GDP15https://blogs.worldbank.org/eastasiapacific/vietnam-and-mekong-delta-drafting-plan-ensure-greater-productivity-and-climate.
Brief History of Hydropower Development in the 3S Basin
Hydropower dams have been operating in the 3S Basin since the early 1990s, beginning with the construction of the Srepok 3 dam on the upper Srepok in Vietnam. Figure 3 below demonstrates how active storage of reservoirs has grown over time as more dams were built. For a definition of active storage and an explanation of methods used to derive active storage, please see the methods section below.
Active storage increased from .285 km3 in 1990 (mostly from the Houay Ho Dam in the Sekong Basin in Laos) to nearly 10 times that amount of 2.493 km3 by 2010 with the major additions of the Yali Falls (.405 km3 in 2001) and the Plei Krong (.977 km3 in 2009) on the upper Sesan and the Buon Tarah (.530 km3 in 2010) on the Srepok. By 2010, Vietnam had completed its cascades of dams on the Upper Sesan (6 dams) and Upper Srepok (4 dams). By 2015, active storage in the 3S Basin totaled 4.221 km3 across 15 dams with the largest addition coming from the largest dam in the system, the Xekaman 1 (1.538 km3, 2015) in the Sekong Basin. By the end of 2022, across a total of 20 large hydropower dams, active storage totaled 6.597 km3, with significant additions coming from the Lower Sesan 2 (1.037 km3, 2018) in Cambodia and the Nam Kong 3 (.469 km3, 2021) and Nam Kong 1 (.109 km3) in Laos. Additionally, the Nam Kong 1, 2, and 3 dams and the Xekaman 1 and Xekaman 3 form hydropower cascades in the Sekong Basin.
Currently, the Sekong River has a total of 3.292 km3 of active storage across 9 dams, all of which are located on tributaries in Laos with the exception of the small A Luoi Dam (.023 km3) on the Sekong’s headwaters in Vietnam. The Sekong comprises 49.9% of active storage in the 3S Basin. The Sesan River has a total of 2.695 km3 of active storage and comprises 40.85% of total active storage across 7 dams, 6 of which form the Upper Sesan cascade in Vietnam and the seventh of which is the Lower Sesan 2 built downstream below the confluence of the Srepok and Sesan. Finally, the Srepok has the least active storage with .610 km3 across four dams in Vietnam’s upper Srepok, comprising 9.25% of all 3S active storage. All dams analyzed in this study are listed in the table below ordered from upstream to downstream location by basin. Methods for determining operations category and estimated actives storage are discussed in greater depth in later sections. The largest five dams in terms of active storage are highlighted in grey.
How do 3S Dams compare to other dams in the Mekong Basin?
Through the Mekong Dam Monitor, our team has generated active storage estimates for 55 large reservoirs (inclusive of 3S Basin reservoirs) in major sub-basins in the Mekong Basin (see Figure 4). The 3S Basin ranks third behind China’s Lancang cascade of 11 dams on the Mekong Mainstream and the Nam Ngum 1-2 dams on the Nam Ngum River in Laos. For comparison, the active storage of the Lancang Cascade is nearly 4 times that of the 3S Basin and comprises 49.5% of all estimated active storage in the Mekong. Most of this active storage in China is in the giant reservoirs of Xiaowan and Nuozhadu. Active storage in Thailand’s 7 major dams in the Mun-Chi basin, which accounts for more than 30% of Thailand’s national territory and most of its northeast region, total less than half that of the 3S Basin.
When comparing the active storage of individual dams (Figure 5), it becomes clear that some of the largest dams in the Mekong Basin are in the 3S. The largest reservoir in the 3S Basin, the Xekaman 1, ranks 8th largest in the Mekong with 1.538 km3 of active storage and the Lower Sesan 2 ranks 10th with an estimated 1.036 km3 of active storage. In total, five 3S dams rank within the top 16 largest reservoirs in the Mekong Basin, including the Plei Krong, Xenamnoy, and the Buon Tarah in addition to Xekaman 1 and Lower Sesan 2. Still the storage of these dams is a magnitude or more smaller than China’s Nuozhadu (11.358 km3) and Xiaowan (11.174 km3). Even the Nam Ngum 1 reservoir in Laos is nearly 3 times larger than the Xekaman 1 reservoir.
Descriptive Overview of 20 Major Dams in the 3S Basin
This section provides an overview of each of the 20 large dams assessed in the 3S Basin. Summary information derived from the processes above is listed for each dam, including minimum observed level, normal service level, and maximum level observed estimated active storage. A time series for both change in reservoir level (in meters above sea level or masl) and volume change is listed per dam along with analysis of the dam’s operation pattern. We examine the time series to categorize dams by operation type (seasonal storage dam, run-of-river dam, regulating dam, hydropeaking dam) and expound on notable events observed across the time series such as drought, sudden drawdowns related to dam safety or maintenance, etc. Dams are ordered from upstream to downstream by sub-basin.
Interactive map: Major Dams in the 3S Basin
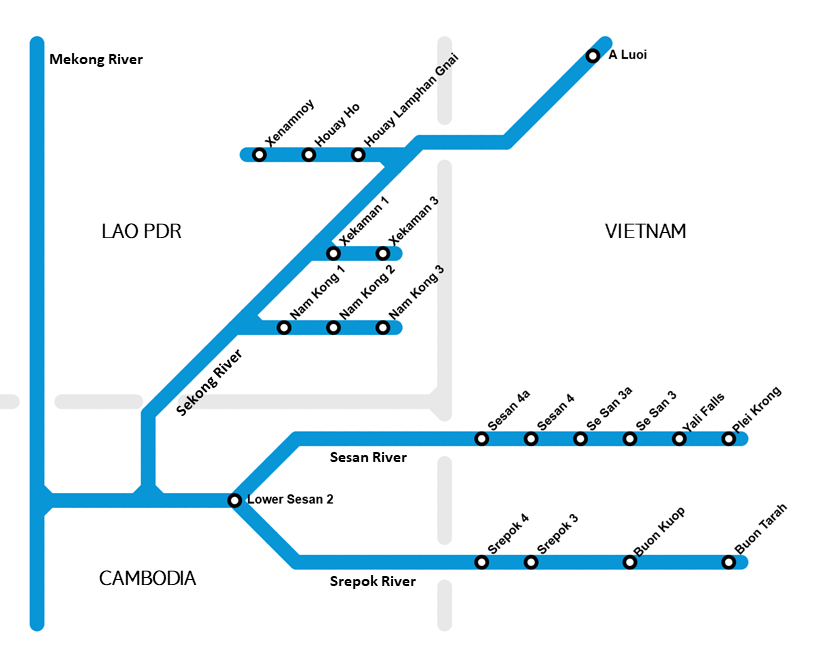
Click on the dots for statistics, operation data, and analysis of each dam.
Analysis of Hydropower Cascades on the Sekong, Sesan, Srepok rivers (by River Basin)
This section compiles the reservoir observations above to discuss the analysis of hydropower cascades and overall dam operations at the basin scale starting with the Sekong, followed by the Sesan and Srepok. The discussion of each basin begins with an overview of how total estimated storage has increased over time in each respective basin. Then, storage indicators are compared to mean annual discharge as well as mean wet season and mean dry season discharge data to assess the overall hydrological impact of all dams on annual and seasonal flow volumes. Where possible, analysis of specific temporal periods sheds light on instances in the historical period when dam operations delivered particular and measurable impacts to the hydrological flow regime. Further, we assess and discuss what the data say about the optimization and coordination of cascades within the basin.
Sekong Basin
The Sekong Basin has the second largest catchment size (28,815 km2) of the three 3S Basins. It is also the only basin of the three which flows through three countries with headwaters in Thua-Thien Hue province, Vietnam; 78% of its basin flowing through Laos’s southern provinces of Xe Kong, Saravane, Champassak, and Attapeu; and 19% of its lower basin in Cambodia’s Stung Treng province16 Note: Atlas of the 3S Basin. IUCN, 2014. A robust dataset is not available to accurately measure mean annual flow and seasonal flow of the Sekong River, but the limited data available suggests that mean annual flow in the Sekong Basin is 39.92 km3; mean dry season flow is 5.304 km3; and mean wet season flow is 34.62 km3.17 Note: Full year (365 day) daily discharge observations datasets for the Siem Pang gauge (Sekong) are only available via the MRC data portal for the years of 1965 and 2012. Across the period of record however, there are some years (1965, 1966, 1967, 1968, 2011, and 2012) which have full months (28-31 days) of data available ranging between 7 and 4 years depending on the months. The mean flow values are derived from sums of the monthly averages for the respective indicators (Jan-Dec for mean annual flow, Dec-May for mean dry season flow, June-Nov for mean wet season flow). This data is not robust, but it is ample to produce a kind of mean analysis. Among the 3S basins, the Sekong has the highest annual flow with an estimated 49% more annual flow than the next largest basin, the Sesan. The Sekong’s dry season flow is estimated to be less than the Sesan’s, although this conclusion should be further tested given limited data.
The Sekong’s major tributaries, the Nam Kong and the Xe Kaman Rivers, as well as the rivers which flow off of the Bolaven Plateau have all been dammed for hydropower development. This study tracks 9 large dams built on those tributaries and estimates that their total cumulative active storage is 3.292 km3. Compared to the Sesan and Srepok Basins, the Sekong has the most dams and also the highest cumulative active storage volume.
Figure 6 below demonstrates the progression of active storage increases in the Sekong Basin. The Houay Ho Dam located on the northeast corner of the Bolaven Plateau was the first dam built in the Sekong Basin (1999) and was the basin’s only dam until the A Luoi Dam in Vietnam began operations in 2012. Cumulative storage in the basin began to rise significantly after 2015, when the Xekaman 1 Dam (1.538 km3) was completed, followed by the Xenamnoy Dam (.714 km3) in 2019 and the Nam Kong 3 Dam (.469 km3) in 2021.
The largest reservoirs in the system are Xekaman 1 (1.538 km3), Xenamnoy (.714 km3), Nam Kong 3 (.469 km3) and the Houay Ho (.225 km3). The operations curves suggest that all three of these reservoirs are operated as seasonal storage, restricting flow during the wet season to recharge reservoirs and subsequently releasing that water during the dry season for hydropower production. The table above demonstrates the maximum potential impact of each dam on mean seasonal flow, which can be conceptualized as if the reservoir released all of its active storage during the dry season and then recharged its reservoir to maximum estimated active storage levels during the wet season.
The Xekaman 1 dam has the maximum potential to increase dry season flow to the Sekong river system by 28.99% and reduce wet season flow by 4.44%. The Xenamnoy dam has the maximum potential to increase dry season flow by 13.46% and reduce wet season flow by 2.06%. The Nam Kong 3 dam has the maximum potential to increase dry season flow by 8.84% and reduce wet season flow by 1.35%. Finally, the Houay Ho Dam has the potential to increase dry season flow by 4.24% and reduce wet season flow by .65%. If the entire cascade of 9 dams were operated in a coordinated way to maximize active storage releases during the dry season and fully recharge active storage via wet season flow restrictions, the cascade could potentially increase mean dry season flow by 62.06% and reduce wet season flow by 9.51%. Of course, seasonal flows vary, and in instances where seasonal flow is lower than average due to climate variability or change then the impacts of dam operations could be more severe.
Figure 7 below shows how the nine-dam cascade operations have changed over time. We find no evidence in the data or literature of coordinated dam releases or restrictions to optimize hydropower production or water utilization. However, the data below suggest that cumulatively the active storage patterns are driven by the large dams listed above, which predictably release storage during the dry season and increase storage during the wet season months. Actual active storage peaks are increasing over time, but importantly so is the nadir of minimum cumulative active storage levels. The only year in the record where active storage levels were close to zero—when reservoirs released all or most of their water during the dry season—was in 2019. Interestingly, in 2022 the large reservoirs of Xenamnoy, Xekaman 1, and the Nam Kong 3 did not reach their lowest active storage levels.
Table 2 tracks observed cumulative active storage increases (through wet season restrictions) and observed cumulative active storage decreases (through dry season releases). After 2019, a pattern emerges of dams increasing total active storage over the course of the wet season, with restrictions ranging from 1.90 km3 to 2.39 km3, and total cumulative flow releases during the dry season ranging between 1.73 km3 and 1.99 km3. Cumulative releases and restrictions vary from year to year due to new dams coming online, meteorological factors which determine inflow into reservoirs, and demand for hydropower which drives dam operations decisions.
Importantly, the wet seasons of 2019, 2020, and 2021 were among the lowest flow years on record for the Mekong Basin. There is insufficient discharge data in the MRC database to confirm whether these years were also low flow years for the Sekong Basin, but it is possible to assume so based on total Mekong flow data and flow data for the Sesan to the south. However, there is no pattern in the data to suggest that a lack of water availability in the wet season changed either the behavior of dam operators or the quantity of water restricted by reservoirs. This suggests dam operations had a proportionately larger reduction on wet season flow during these years. Since seasonal flow data is not available over this time period for the Sekong Basin, this issue is revisited below via analysis of the Sesan and Srepok Basin. In consideration to seasonal annual means, 2021 restrictions delivered the greatest wet season flow reductions of 8.4% and 2022 releases would have delivered the greatest dry season flow increases of 37.52%.
Sesan Basin
The Sesan Basin is the smallest of the three 3S Basins with a total area of 18,800 km2. Roughly half of that area is in Vietnam’s provinces of Kon Tum and Gia Lai, and the other half of the basin is in Cambodia’s Ratanakiri Province. The MRC provides complete or near complete flow data for the Sesan Basin for 20 years between 1965 and 2022 via measurements at the Voeun Sai gauge. From this data, mean annual flow is determined to be 26.80 km3; mean dry season flow (December-May) is determined to be 6.86 km3 (the highest in the 3S Basin); and mean wet season flow (June-November) is determined to be 20.44 km3. Unlike the Sekong with numerous dams on tributaries, most dams in the Sesan are on the mainstream. This study assesses the reservoir volumes and operations of seven large reservoirs all situated on the mainstream. Six of those reservoirs form a cascade in Vietnam and one reservoir, the Lower Sesan 2, is located in Cambodia below the confluence of the Sesan and Srepok rivers.
Figure 8 below shows how cumulative storage in the Sesan Basin has increased since the year 2000. Vietnam’s state-owned power generation company Vietnam Electricity (EVN) developed a cascade of six dams on the upper Sesan, starting with the Yali Falls Dam (.405 km3) in 2001, followed by the Se San 3, Se San 3a, Sesan 4, and Sesan 4a, each of which was built below the Yali Falls dam in the order listed and starting operations between 2006 and 2009. Of these four, the Se San 3a (.088 km3) and the Se San 4 (.168 km3) have significant storage. The last dam in the cascade, the Plei Krong Dam, was completed in 2009 with an estimated active storage of .977 km3, making it the largest reservoir in the upper Sesan cascade and the third largest reservoir in the 3S system. The Plei Krong Dam is estimated to be the 11th largest reservoir in the Mekong Basin.
Of these six dams, the data suggests Plei Krong, Yali Falls, and the Se San 4 are operated as seasonal storage dams while the others either serve hydropeaking functions or operate as re-regulation dams. Given their significant power generation capacity, it is likely the smaller dams are operated as hydropeaking dams. Further evidence to this is provided by examining dry season flows at the Voeun Sai gauge in Cambodia, located about 100km downstream from the Sesan 4A dam (the most downstream dam in Vietnam’s upper cascade). The largest reservoir in the Sesan Basin (and the largest reservoir in Cambodia), the Lower Sesan 2 (1.037 km3) began operating in 2018 and is designed to be run as a run-of-river scheme. It is located downstream of the Voeun Sai gauge and just below the confluence of the Sesan and the Srepok and, as such, receives flow from both river basins. Examination of its operations pattern suggests it is not entirely operated in a way where inflow equals outflow but rather is operated in a modified format to respond to electricity demand needs in industrializing Phnom Penh. There is no evidence that the Lower Sesan 2 in Cambodia is operated in a coordinated fashion with the upstream dam cascades in the Sesan or the Srepok in Vietnam.
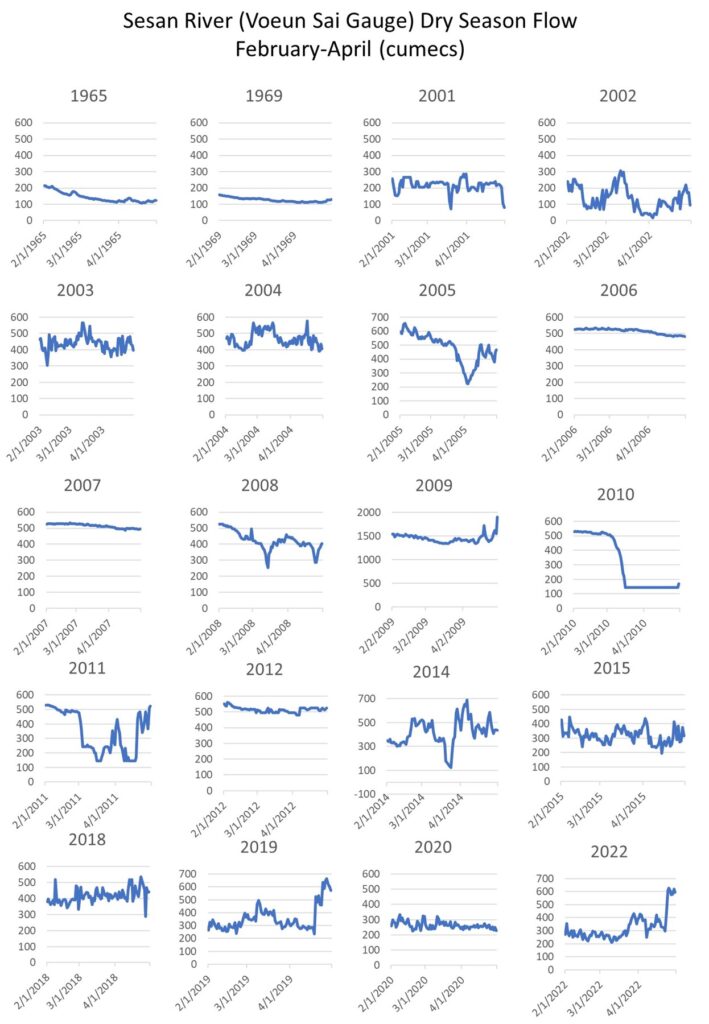
Figure 9 above shows the flow records at the Voeun Sai gauge for the dry season months of February through April across years between 1965 and 2022 for which there are complete sets of data coverage. The goal of this comparison is to demonstrate the impacts of dam construction and operation on Vietnam’s upper Sesan cascade on the Voeun Sai gauge. February to April represent a cross-section of data when the river should be running at a relatively flat and low flow rate with little variance across the entire dataset. Adding the dry season months of December, January, and May increases the range of seasonal variance sometimes to over 2000 cubic meters per second (cumecs), which would inhibit the ability to see day to day changes in flow during the months of February-April. Therefore, the dry season months of December, January, and May are excluded. The series above begins with selections from 1965 and 1969 (the only complete pre-2000 datasets for this period) and shows a predictable dry season flow regime which starts slightly higher in February and then reduces in a gradual fashion through the end of the period. It is assumed that the slight variance in each time series is related to natural factors such as the occasional rain shower or temperature change.
The satellite data we use in this study is not available to generate operations curves for dams prior to 2017, but nonetheless through inference into the construction schedules of the dams on the Sesan River, we can infer that the extreme daily variation observed in the historical data from 2001-2003 is related to the construction and filling of the Yali Falls Dam. During this time, downstream communities in Cambodia began to complain about sudden rises and falls in the river level and occasional, unexplained flash flooding.18 Note: https://www.ejatlas.org/print/yali-falls-hydropower-dam-vietnam We assume the Yali Falls dam finished filling by 2003. Since that year, the river has operated at a consistently higher level likely due to the fact that Yali Falls, as a seasonal storage reservoir, has been releasing stored water from the wet into the river during the dry season for hydropower production. Releases appear to be very irregular, introducing much abnormality into flow patterns. In 2006 and 2007, the river level flat lines. We assume this is a function of constructing the Sesan 3 and Sesan 3a dams over this period. The Yali Falls Dam stopped releasing irregular flows because these flows could have disturbed or disrupted construction of those dams. A similar pattern is observed in 2009 when the Sesan 4 and Plei Krong dams came online. However, 2009 flows are much higher in terms of volume compared to other years, averaging around 1500 cumecs for February through April. It is possible the new dams sought to demonstrate their full capacity to produce hydropower that year, a phenomenon often observed in flow data during a dam’s first year of operation. It is also possible this is a data error.
We assume river flow dropped severely and then flatlined in 2010 because the large Plei Krong Dam was filling and removing water from dry season flow at a constant rate. After the Plei Krong Dam filled (likely at some point in 2012), the cascade was complete. Since then, nearly all semblance of gradual dry season flow has been removed from the river system. The river is subject to erratic and sudden peaks and valleys, which suggests that most downstream dams in the upper Sesan cascade are engaged in hydropeaking operations. This kind of operation is damaging to communities and ecosystems downstream and can be mitigated via re-regulation dam operations and/or adapted to via an effective early warning system to give local communities time to adapt to sudden changes in river level like those observed in April 2014 or March 2019.
Figure 10 below shows cumulative operations of all dams in the Sesan Basin from 2017 through 2022. Overall, the data show a clear trend of seasonal operations where the dams operate as a coordinated cascade, where major storage dams (Plei Krong, Yali Falls, Sesan 4a) are releasing active storage during the dry season for hydropower production and then recharging their active storage during the wet seasons. After the Lower Sesan 2 Dam became operational in 2018, a significant increase in total cumulative active storage became observable. The basin-wide cumulative operations curve is not as smooth as the Sekong Basin cumulative operations curve, and much of this variance is due to how the hydropeaking dams upstream and the Lower Sesan 2 dam are operated. If the Lower Sesan 2 dam is operated as a run of river dam, then the variance observed on the Lower Sesan 2 reservoir is to some degree driven by the operations of hydropeaking dams on the upper Sesan cascade, which means that the severe fluctuations caused by those hydropeaking operations also translate through to the confluence of the Sesan and Mekong affecting ecosystem services downstream from the confluence. However, a severe drop followed by a sudden recharge in active storage was observed at the Lower Sesan 2 reservoir in April 2020, January 2021, and May 2022. This unexplained erratic operations pattern of the Lower Sesan 2 Dam tends to be repeated each dry season.
During the wet seasons of 2018, 2019, and 2020, cumulative active storage tended to peak around 2 km3, with dry season cumulative storage nadirs ranging between .5 and .75 km3. On average, seasonal cumulative releases and restrictions during this period range from 1.25 km3 to 1.5 km3. However, these totals do not account for the temporal variance observed during each season, which is subject to severe fluctuations in both the wet season and dry season. From the wet season of 2021 through 2022, the Lower Sesan 2 and the Yali Falls reservoirs were operated at higher levels, likely due to the increased water availability of those wet seasons compared to previous years. As a result, cumulative storage peaks during the wet seasons of 2021 and 2022 were around 2.4 km3, an observed increase from previous years. In 2022, dry season releases reached a nadir of an estimated .784 km3, suggesting a cumulative 2022 dry season release of around 1.6km3 followed by a cumulative wet season recharge (restriction) of the same amount. Again, these cumulative totals do not account for variance occurring between the peaks and nadirs, which is significant across all seasons (although the 2022 wet season cumulative storage curve (increase) is relatively smooth).
https://datawrapper.dwcdn.net/qeGSY/8/
Figure 11 analyzes the impacts of cumulative dam operations on flow volumes at the Voeun Sai gauge across the period of record (2017-2022) for dry seasons (December-May) and wet seasons (June-November). Importantly, since the Voeun Sai gauge is located above the Lower Sesan 2 Dam, data for the Lower Sesan 2 Dam is excluded from this analysis. The indicators show a total stock (km3) of seasonal flow and a total stock of net cumulative dry season releases, which should also indicate the total stock of net cumulative wet season restrictions.
Dry season flow analysis shows lower stocks of dry season flow volume between 2019 and 2021, which is consistent with the knowledge that these years received significantly less precipitation in both the wet season and dry season. Observed flow (the total of the light blue and the dark blue in the chart above) was 4.38 km3 in 2020, the driest year on record for the Mekong Basin. This is significantly lower than other years in the record. Dam releases during the 2020 dry season—which are a function of active storage accumulated during the 2021 wet season—were higher than 2018, suggesting that dam releases are not entirely linked to climate patterns and water availability in their watershed, but also driven by demand for electricity. As such, during the lowest flow year of 2020, dams increased dry season flow at the Voeun Sai gauge by 13.02%, the highest addition of dry season flow observed across the record. During the dry years of 2019 and 2021, the impacts of dry season releases were 10.94% and 11.47% respectively, also suggesting that dam releases have a greater proportional effect on flow during years when river levels are low because of climate factors. This might at first appear as a benefit, but it is important to remember that the extra increases of dry season flow come at the expense of lower wet season flows during the previous wet season. This is demonstrated in Figure 12.
Figure 12 has an important difference from the dry season chart above. Total observed flow is not the total of the light and red values; rather, total observed wet season flow is the light blue value. When total estimated dam restrictions (red) are added to the lighter blue values, then the cumulative result shows what natural flow would have been for that wet season. A significant variance in observed flow is observed across the record, with wet season observed flows from 2019 through 2021 significantly lower than 2017 and 2019. This period is known to have been a period of wet season drought19 Note: https://www.mrcmekong.org/news-and-events/news/pr-13-1-2022/ . Interestingly, MRC river flow data indicates that although 2022 was not a drought year basin-wide, yet the river flow within the Sesan basin was lower than anticipated and within the same range as drought years from 2019-2021. During the 2019-2021 drought, dam restrictions were estimated to be significantly higher than in 2017 and 2018, meaning nominally they had a greater reduction of flow. When the proportional effects of these dam restrictions are considered, the impacts on 2019-2021 were even more significant. In 2019, 4.93% of estimated natural flow was removed by upstream dams. In 2020, the driest year on record, 6.01% of total flow was removed by upstream dams. And in 2021, 4.53% of flow was removed by upstream dams.
The core ecological flows of the Mekong system such as sediment transport and the transport of fish larvae and fingerlings occur during wet season as the flood pulse lifts and pushes these flows to the downstream floodplain. The Sesan’s wet season flow is also a critical conduit of these ecological flows. As such, flow should be at the least maintained or ideally maximized to promote downstream fisheries and agricultural production throughout the entire year for communities in the Sesan Basin. The proportional impacts of upstream dam restrictions during particularly dry wet seasons are obvious and large. As a recommendation, during particularly dry wet seasons, dam operators should not restrict as much water in order to consider downstream needs.
A monthly analysis of dam impacts in 2020 (the driest year on record) can further drive home this point.
In Figure 13, across the 2020 dry season, variance in dam releases and dry season natural flow estimates are observable, and on the whole, the observed flow increases from January to March and then decreases through May. However, a detailed review of the data shows that this trend is driven by dam releases rather than climatic patterns, particularly March’s releases which added an estimated 52.31% extra flow into the river! January and May releases were also proportionally high, raising the natural flow of the river by 31.16% and 34.33% respectively. If one subtracts the flow from dam releases, a somewhat normal pattern of dry season flow emerges across the five months with a decreasing natural flow trend from February through May. While seasonal analysis shows dams increased river flow that year by more than 13%, a monthly analysis shows how dam releases are much more significant when they occur over smaller temporal scales. It is important to note that December 2019 was not included in this analysis because a net dam release was not observed during that dry season month.
In Figure 14, the wet season months of August through November 2020 also demonstrate the severe effects that upstream dam restrictions can induce on wet season natural flow, particularly during wet seasons like 2020 which was the lowest flow year on record for the Mekong Basin and the second lowest wet season flow on record in the MRC database for the Voeun Sai gauge. The natural flow estimate (red+blue) shows a clear trend of wet season flow increase from August to November, with flow increasing in a non-linear fashion from month to month. This would be expected in line with wet season precipitation performance. However, observed flow (blue) does not entirely follow this pattern with a noticeable abnormality in October, when observed flow did not increase significantly compared to September.
Dam restrictions were the greatest in the month of October and were the main driver of a lack of natural flow during this period. Dam restrictions removed an estimated 27.34% of natural flow from the river at a time when its flow should have been expanding at an increasing rate to feed the river’s natural flood pulse and the natural flood pulse of the Mekong system. While restrictions across the remaining observed months ranged between 4-6% of natural flow (also significant numbers), these data demonstrate the severe effect on natural flow driven by choices of dam operators upstream.
By October 2020, it would have been very clear to dam operators that the 2020 dry season was one of the driest on record. Dam operators could have exercised caution when recharging their reservoirs during this month. Instead, their actions exacerbated drought downstream. Of course, institutional or legally codified operating rules for dams during times of drought could require or guide dam operators in their decision-making. Without these rules, one cannot expect dam operators to act in consideration of downstream needs.
Srepok Basin
The Srepok Basin is the largest of the three 3S Basins with a total area of 30,942km2. Like the Sesan, roughly half its area is split between Vietnam in the upstream (Gia Lak, Dak Lak, Dak Nong, and Lam Dong provinces) and Cambodia in the downstream (Mondulkiri and Ratanakiri provinces). The MRC provides complete or near complete flow data for the Srepok Basin for 23 years between 1965 and 2022 via measurements at the Lumphat Gauge. From these data, mean annual flow is determined to be 23.96 km3 (the lowest of the 3S basins); mean dry season flow from December to May is determined to be 3.80 km3 (the lowest of the 3S basins); and mean wet season flow from June to November is determined to be 20.45 km3 (slightly higher than the Sesan Basin). Like the Sesan, the Srepok is dammed on its upstream in Vietnam by a cascade of four dams. The Srepok is also dammed at its confluence with the Sesan River by the Lower Sesan 2 dam. The storage capacities of dams on the Srepok are considerably smaller than reservoirs on the Sekong and Srepok.
Figure 15 shows how cumulative active storage has increased in the Srepok Basin over the last 30 years. The Srepok 3 Dam (.06 km3) was the first dam built in the entire 3S Basin and was the only large dam on the Srepok mainstream until 2009 when the dams of Buon Tarah (.53 km3) and Buon Kuop (.01 km3) were completed. A year later, the most downstream dam in the cascade Srepok 4 (.01 km3) was completed.
The Buon Tarah dam is the most upstream dam and is the only dam in the cascade with significant storage. Its active storage makes up 86.89% of the active storage in the Srepok Basin and operates on a fairly predictable seasonal storage schedule, releasing most of its active storage in the dry season for hydropower production and then recharging its reservoir with flow restrictions during the wet season. Analysis of total active storage compared to seasonal flow suggests the Buon Tarah dam has the ability to increase mean dry season flow by 13.95% and decrease mean wet season flow by 2.59%. Data estimates for operations are only available from 2017 onward but the data suggests that the Buon Tarah reservoir has not filled to its normal service level of active storage since 2018, possibly reflecting lower than normal water availability during the 2019-2021 drought. Normal service levels also were not reached in 2022.
Operations estimates for the three dams downstream of Buon Tarah suggest these dams are operated as hydropeaking dams with erratic reservoir levels and no observable seasonal storage patterns. Cumulatively, the active storage operations of these dams could increase mean dry season flow by 16.5% and reduce mean dry season flow by 2.96%, suggesting that among the three 3S Basins, dams have the least influence on the seasonal hydrological cycles of the Srepok river. An examination of daily dry season flow at the Lumphat gauge positioned about 160km downstream of the Srepok 4 dam reveals how the operations of these dams have altered flow in the downstream reaches of the Srepok Basin across the period of record (1965-2022).
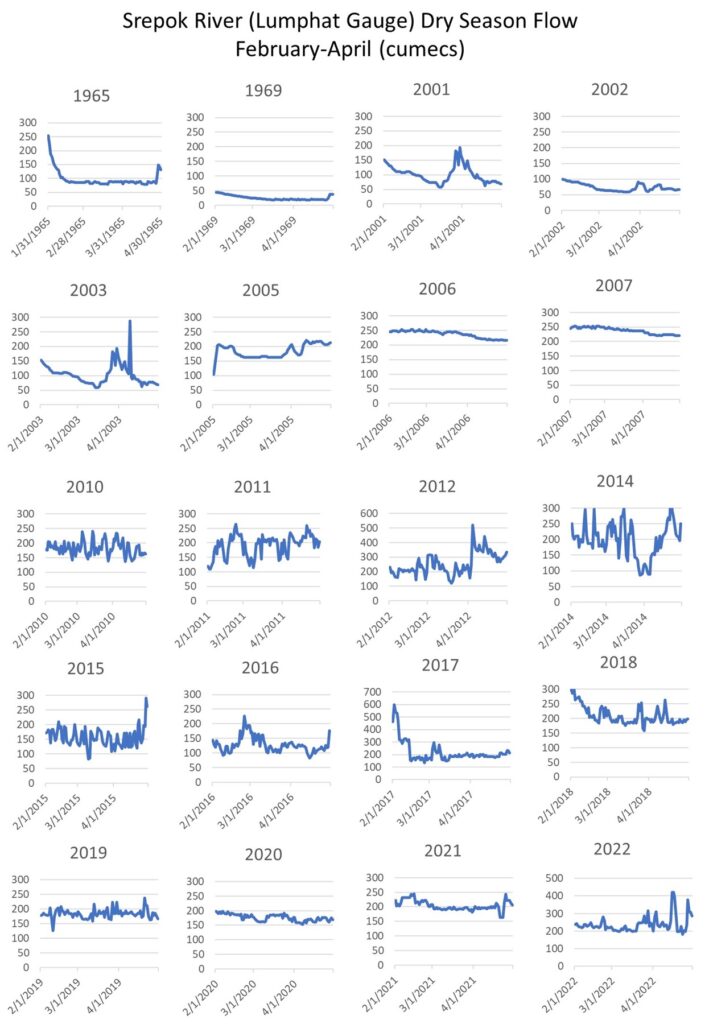
Figure 16 above shows the flow records at the Lumphat gauge for the dry season months of February through April across various years between 1965 and 2022 for which there are complete sets of data coverage for these months. The goal of this figure is to demonstrate the impacts to the Lumphat gauge of dam construction and operation on Vietnam’s upper Srepok cascade. February to April are chosen because these months represent a cross-section of data when the river should be running at a relatively flat, dry season flow speed with little variance across the entire dataset. Adding the dry season months of December, January, and May increases the range of seasonal variance which disables the ability to see day to day changes in flow during the months of February-April. The series above begins with selections from 1965 and 1969 (the only complete pre-2000 datasets for these months) and shows a predictable dry season flow regime which starts slightly higher in February and then reduces in a gradual fashion through April. The slight variance in each time series is likely related to natural factors such as the occasional rain shower or temperature change.
We are unable to use satellite observations to generate operations curves for dams prior to 2017, but through reference to the construction schedules of the dams on the Srepok River, one can infer that the data from 2001 through 2005 represent a period when the Srepok 3 dam was operating freely without the need to consider other dams. It is difficult to determine whether the extreme fluctuations observed during these years is due to hydropeaking effects or from unseasonable rains. However, in 2006 and 2007, a flat line emerges, suggesting that construction began on the dams above and below the Srepok 3, and that this necessitated the Srepok 3 to stop operating in order to not disturb dam construction downstream. Average flow volume also increased to around 250 cumecs during this timeframe, suggesting that higher levels of wet season storage were being utilized for dry season hydropower production.
From 2010 onward, all dams in the system were completed and a clear hydropeaking pattern and higher flow volumes are reflected in the data. This suggests sudden restrictions and releases of water from the cascade can have a profound effect on daily river levels over 100 kilometers downstream at Lumphat. As such, if ecological flows during both the dry season and wet season are to be preserved, the dam located farthest downstream should be operated as a re-regulation dam to reduce the extreme variance in daily flow. Further, these sudden changes in river level should be accompanied by early warnings to give downstream communities time to adapt to sudden changes. Interestingly, much less daily fluctuation is observed in drought years of 2017, 2019, 2020, and 2021 when compared to non-drought years post-2010. This could be a function of water availability or could be because dam operators applied additional considerations and legal obligations when making decisions about water restrictions. This pattern is not observed at the Voeun Sai gauge in the Sesan Basin, which of course has more dams and higher levels of active storage.
Figure 17 shows a cumulative operations curve for the four dams in the Srepok Basin. Clearly, the biggest driver of storage trends in the Srepok is the Buon Tarah Dam given that its active storage is multiple that of the other three dams in the system. The Buon Tarah Dam reliably operates as a seasonal storage dam, releasing much of its active storage during the dry season for hydropower production and then recharging its reservoir during the wet season. Most of the variance observed is attributable to the Srepok 3 and the Buon Tarah dams, with both showing changes week to week. This suggests that these two dams are the biggest drivers of the severe daily fluctuations in flow volume at the Lumphat gauge. All four of these dams were fully operational across the 2017 to 2022—unlike the similar charts for Sekong and Sesan Basins where new dam operations were introduced during the period of record— which makes it interesting to speculate why peaks and nadirs differ year to year across the five-year period.
The data suggests the 2017 and 2018 wet season storage peaks were much higher than subsequent years, likely due to low water availability during the 2019-2021 drought period. According to data for the Lumphat gauge, 2022 was an above average year for annual and wet season flow, suggesting the lower observed wet season active storage levels (which tracked similarly to 2019-2021) were not due to a lack of flow. Even more interesting is the total amount of reservoir recharge: the 2022 wet season cumulative active storage was lower than normal since the 2022 dry season nadir was much higher than all previously observed years.
The figures below analyzes the impacts of cumulative dam operations on flow volumes at the Lumphat gauge across the period of record (2017-2022) for dry seasons (December-May) (Figure 18) and wet seasons (June-November) (Figure 19). The indicators show a total stock (km3) of seasonal flow and a total stock of net cumulative dry season releases or a total stock of net cumulative wet season restrictions.
Dry season flow analysis (Figure 18) shows lower stocks of dry season flow volume between 2019 and 2020, which is consistent with the knowledge that these years received significantly less precipitation in both the wet season and dry season. However, dry season flow in 2021 was similar to that 2018 despite it being a low flow year overall for the Mekong Basin. Observed flow (the total of the light blue and the dark blue in the chart above) in 2020, the driest year on record for the Mekong Basin, was 2.72 km3. This is significantly lower than other years in the record. Dam releases during the 2020 dry season (which are a function of active storage accumulated during the 2021 wet season) were higher than 2019, suggesting that dam releases are not entirely linked to climate patterns and water availability in their watershed but also driven by demand for electricity.
During the lowest flow year of 2020 dams increased dry season flow at the Lumphat gauge by 11.02%, which is the highest addition of dry season flow observed by several percentage points. In 2018 and 2019, dry season additions increased flow by just over 7%. In the higher natural flow years of 2021 and 2022, dry season increases lifted volumes by 5.86% and 4.16% respectively. These increases to dry season flow might first appear beneficial, but it is important to remember that the extra increases of dry season flow come at the expense of lower wet season flows during the previous wet season. This is demonstrated in the chart below on total observed flow and estimated dam restrictions.
Figure 19 has an important difference from the dry season chart above. Total observed flow is not the total of the light and red values; rather total observed wet season flow is the light blue value. When total estimated dam restrictions (red) are added to the lighter blue values, then the cumulative result is what natural flow would have been for that wet season. When compared to the similar analysis of the Sesan Basin above, one factor is very apparent: dams in the Srepok Basin have much less influence over the river’s flow. Restrictions occupy rather small portions of missing flow, ranging from .94% to 2.39%, due to the relatively small amount of active storage in the basin compared to mean wet season flow. However, the greatest influences of wet season restrictions were still observed in the driest wet seasons of 2019 and 2020, suggesting these dams indeed exacerbated wet season drought conditions downstream, albeit much less so than what was observed in the Sesan Basin. Monthly observations (Figure 20) tell a similar story but also reveal greater degrees of influence from dam releases and restrictions over smaller temporal periods.
https://datawrapper.dwcdn.net/0H2nj/5/
Across the 2020 dry season (Figure 20), variance in dam releases and dry season natural flow estimates are observed but each indicator demonstrates different trends. When taken on the whole, observed flow actually increases from January to March and then decreases through May, but the data reveal that this trend is driven by dam releases, particularly March’s releases which added an estimated 41.25% flow into the river. January and May releases were also proportionally high, raising the natural flow of the river by 15.93% and 30.91% respectively. Without dam releases, a somewhat normal pattern of dry season flow emerges across the five months, particularly with a decreasing natural flow trend from February through May. While the seasonal analysis shows dams increased river flow that year by more than 11%, a monthly analysis shows how dam releases are much more significant using smaller temporal scales. It is important to note that December 2019 was not included in this analysis because a net dam release was not observed during that dry season month.
The wet season of 2019 (Figure 21) represents the highest observed level of wet season dam restrictions to reduce wet season flow (2.39%). Examining this effect on a monthly basis shows the greatest reduction of flow occurred in September of 2019 with a 4.06% reduction which is substantial. Unlike the Sesan gauge, these reductions were not substantial enough to change the overall trend of wet season flow, and a linear pulse effect was indeed observed from July through August with a rapid decline in October and November. While these reductions can reach observable levels (such as 4.06% in September), this example illustrates that maintaining relatively low levels of active storage compared to mean wet season flow can permit the natural flood pulse of the Srepok Basin to occur. If this natural flood pulse is to persist, Vietnam and Cambodia should avoid building more large storage dams in the Srepok Basin or develop storage up to but not beyond a to-be-identified threshold at which point the storage could erase or negate the flood pulse and bring significantly higher dry season flow levels.
Analysis of Cumulative Effects of 3S Hydropower Projects on the Mekong Mainstream
A logical continuation of the analysis above is to examine the impacts of dams to the 3S system as a composite river system. While this study has produced dam operations estimates and volume changes for major reservoirs in each of the three rivers, a lack of flow data for the Sekong system renders it difficult to make a 1:1 analysis of dam impacts to total flow of the 3S system. Table 3 below considers possible dam impacts to mean annual and season flow volumes for each river system and then compares the sum of the three means to total active storage to analyze total possible impact. Given an estimated total active storage of 6.597 km3 across 20 large dams in the system, we estimate these dams can hold 7.27% of mean annual flow of the system. If these dams released all of their active storage across the duration of the dry season, then this would significantly increase mean dry season flow by an estimated 41.32%. And if all dams restricted a full active storage volume of flow to recharge their reservoirs during the wet season, then this would reduce mean wet season flow by a total 8.74%.
Comparing the three rivers and their respective active storage, we see the Sesan has the greatest ability to impact mean annual flow and mean wet season annual flow. However, the data suggest the Sekong River has by far the greatest potential impact to increase dry season annual flow, by 62.06%. There are a few caveats to consider when interpreting this table. First, the Lower Sesan 2’s 1.037 km3 of active storage makes up a large portion of the Sesan Basin’s active storage (38.48%) and the data above demonstrate that it is not always run as a seasonal storage dam. Therefore, the Lower Sesan 2 has a low possibility of releasing all of its active storage in a dry season and recharging its reservoir during the wet season. Thus the maximum potential for active storage in the Sesan Basin to decrease wet season flow is likely much lower, and the same can be inferred for the dry season. This suggests that the Sekong could be the most manipulated basin in the system in terms of alteration to total seasonal flow, but more studies are required to establish this conclusion. A second issue with the Sekong annual and seasonal flow data below is that it is based on a much smaller sample size due to a lack of data, whereas annual and seasonal flow averages for the Sesan and Srepok Basin are likely much more accurate due to data availability.
Figure 22 shows a composite picture of all major dam operations in the 3S system from 2017-2022 with a categorical division across basins. The Sekong Basin is divided into four blue shaded areas based on where dams sit in the Sekong system: the A Luoi reservoir (barely noticeable due to its small active storage); Bolaven Plateau Reservoirs (Houay Ho, Huai Lamphang Gnai, Xenamnoy); and the Nam Kong cascade of reservoirs (Nam Kong 3, Nam Kong 2, Nam Kong 1). Green represents Upper Sesan Reservoirs (Plei Krong, Yali Falls, Se San 3, Se San 3A, Se San 4a), and the Lower Sesan 2. Finally, red represents the Upper Srepok Reservoirs (Buon Tarah, Buon Kuop, Srepok 3, Srepok 4). The reservoirs are listed in order from upstream to downstream with the Lower Sesan 2 at the bottom since it sits below the confluence of the Sesan and Srepok Rivers.
Interpreting the chart, it is clear that reservoir storage has not yet reached its full estimated potential of 6.595 km3. Maximum total storage volumes were observed in 2021 (5.59 km3) and 2022 (5.58 km3). Looking at changes to the time series, the addition of the Lower Sesan 2 in 2018 created an obvious increase in active storage, while later years are mostly bolstered by increases of storage in the Sekong Basin, particularly the Xenamnoy Dam and Nam Kong 3 dam. One might be quick to assume that much of the variance observed across the top line is driven by the Lower Sesan 2 dam. However, with the exception of the steep drops in active storage at the Lower Sesan 2, which typically occur once or twice a year, most of the variance in the Lower Sesan 2 comes from cascades upstream. As such, it is possible to conclude that the Upper Sesan Cascade is creating most of the variance across the top line since variance observed in the Sekong and Srepok basin-wide active storage time series above shows less variance than the Sesan.
Finally, Table 4 below sheds light on total manipulation across seasons by comparing maximum and minimum observed values and total possible change between maximum and minimum ranges. However, these values should not be considered as total season changes as the maximum and minimum values do not always correspond to changes in seasonal stocks of flow; in other words, seasonal stocks are the net active storage change from the first day of the first month of the season to the last day of the last month of the season. Minimum and maximum values could fall outside of those ranges and not capture total net active storage increases or decreases for the year in question. (Corresponding with the chart, both minimum and maximum storage volumes increase from 2017 to 2022, but a variety of factors such as climate, water availability and electricity demand drive variance in observed minimum storage volumes in individual years. Maximum levels display fairly consistent increases year on year. The largest absolute drop in active storage level was observed in 2022’s dry season (3.87 km3), and the largest absolute increase in active storage was observed in 2021 (4.59 km3).
Since river flow data is not available for the Sekong across the 2017-2022 time period, we used the robust data set of daily discharge (1912-present) at the Stung Treng gauge on the Mekong mainstream to assess impacts of 3S dams on the Mekong’s hydrological cycle. It is very important to remember that other dams in the Mekong basin upstream of the 3S system are also impacting seasonal flow by raising the Mekong River level during the dry season and lowering the river level during the wet season. Our team has discussed this with particular emphasis on the impact of China’s Lancang Cascade of 11 dams at Stung Treng, which will be discussed further below20 Note: https://stimson.org/2022/mdm-one-year-findings/ .
Figure 23 below examine the impacts of 3S dams to the Stung Treng mainstream gauge across dry and wet seasons. They compare the net stock of dry season releases to the total stock of observed flow for each respective dry season and then similarly compare wet season restrictions to observed flow for each wet season. Since the 3S River is the last large tributary system to enter the Mekong mainstream (with exception of the Tonle Sap), the impacts are much less noticeable than within the 3S basin. Yet, we do find that 3S dam operations have a measurable impact to the Mekong mainstream.
The Figure 23 suggests that under certain circumstances, dry season releases from 3S dams increased the total Mekong River flow at Stung Treng between 2-5.84%. Total observed Stung Treng flow is the total value of the dark and light blue colors, with light blue representing estimated total dry season reservoir releases and dark blue representing the difference of observed flow and dry season releases. As with analysis in sections above, flow is noticeably lower in 2019, 2020, and 2021. Dry season releases in 2020 were the same as 2022, but had a proportionately larger impact on increasing flow (5.84%) due to total flow being lower in 2020 than 2022. Importantly, the dark blue bar above is not representative of natural flow to the Stung Treng gauge, but rather includes dam releases from major storage dams farther upstream in the Mekong basin. Natural flow would be somewhat lower without those additional releases, and as such the percentages of extra flow from the 3S dams listed above are definitely under-estimates of impact to natural flow. With more time and resources, it would be possible to conduct a similar analysis to parse out impacts of other seasonal storage dams to the Stung Treng gauge using lagged flow estimates and thus pinpoint a more accurate influence of 3S dams and other dams on natural flow to Stung Treng.
A similar analysis of wet season flow (Figure 24) shows that impacts of wet season restrictions are measurable but much lower in terms of influence over total seasonal flow when compared to dry season restrictions. Total Mekong flow restrictions delivered by 3S dams range from .57%-1.48% across the 2017-2022 period of analysis. Like above, the greatest proportional influence of dam restrictions was observed in the extremely dry wet seasons of 2019-2021 (1.48%, 1.28%, and 1.44% respectively). These restrictions might appear to be minimal—but when added to the cumulative impacts of dam restrictions upstream then total wet season flow reductions can be significant, particularly during anomalously dry wet seasons.
For example, another study conducted by this team found China’s two largest storage dams reduced wet season flow by 11% at Stung Treng during the difficult drought of 2020’s wet season.21 Note: https://stimson.org/2022/mdm-one-year-findings/ However, if the flow reductions of upstream dam impacts to the Stung Treng gauge are added into the values above–effectively raising the value closer to that of natural flow—then the proportional impact of the 3S dams above shrinks. As such, we can conclude that the 3S dam operations are likely more influential over the region’s hydrological flow during the dry season than the wet season. However, dry season releases are dependent on wet season restrictions, and thus the two are interconnected. Further, the analysis above is limited in that it only considers the impacts on a seasonal timescale—drilling down to a monthly temporal scale reveals further insights.
Figure 25 below examines the monthly impacts of dam operations on individual seasons identified as most influenced by dam operations: dry season 2020 and wet season 2019. In March—the month when the greatest releases were estimated (1.34 km3)—the influence over Stung Treng flow was extremely substantial at 22.80%. Without the 3S dam releases in March, natural flow would have experienced a nadir in March. Yet due to March releases, the nadir occurred one month earlier and at a higher volume than the natural nadir. It is also interesting to point out the significant monthly variance in dry season releases in 2020, ranging from 0.00 to 1.34 km3 over the course of each month. We assume that daily variance is even greater. This kind of monthly and daily variance brings severe ecological consequences to fish migration practices, as fish rely on steady flows to determine migration timing and pathway, as well as for unnatural dry season inundation in the flooded forests below Stung Treng, which is known to kill plant species which normally thrive in the flooded forest.22 Note: https://stimson.org/event/mekong-data-discussion-flooded-forests/
Figure 26 also drives further home the point that dry season releases are much more visible and influential to flow regimes during the dry season when compared to the wet season. In most months below, the dam restrictions (red) are barely visible. September delivered the greatest nominal restriction at a time when natural flow was peaking, but it only reduced the Stung Treng flow peak by 1.76%. The greatest proportional reduction of flow occurred in November with a 3.16% reduction of total Mekong flow to Stung Treng. Arguably, a 3.16% reduction in flow is beginning to enter the range of significant flow reduction. When coupled with other flow reductions upstream, total cumulative reductions to flow can be even more substantial.
Conclusion and Recommendations
This study comprehensively examines how operations of 20 dams built throughout the 3S system are changing the hydrological cycles within the 3S rivers and the Mekong as a whole. Data gaps in the Sekong Basin present challenges to measure specific hydrological impacts and these challenges translate through to impact other aspects of this study. However, data is robust enough to conclude that dry season releases from seasonal storage dams are delivering a measurable increase of river flow and wet season restrictions from the same dams are delivering a measurable decrease of river flow, with the greatest effects in the Sekong and Sesan basins. Hydropeaking operations throughout the system, but most noticeably on Vietnam’s cascades on the upper Sesan and upper Srepok are causing severe fluctuations of downstream river flow observable in daily and monthly data. The data suggest that operations of seasonal dams and hydropeaking dams are determined with little to no consideration of downstream ecosystem impacts or early warning for sudden releases of water which can cause flash floods. Giving these findings, we make the following recommendations:
- Authorities in Cambodia and the Mekong River Commission should restore physical gauges reporting at the Siempang gauge on the Sekong River. No daily discharge data is available for this gauge after 2012. The Sekong River is responsible for approximately 10% of total Mekong annual flow and given its importance, needs proper infrastructure to monitor its hydrological conditions in real time. Additionally, a gauge located on the composite 3S River below the confluence of the Sekong and Sesan and before the river enters the Mekong mainstream would be useful to measure and study total 3S Basin discharge and flow alteration from upstream dams.
- The use of dams for hydropeaking purposes is damaging to communities and ecosystems downstream. Mitigation measures such as adjusting operations of the most downstream dam in a cascade to emulate natural flow or reduce severe and sudden alterations of flow can mitigate the effects of hydropeaking. Re-regulation dams can be built for this purpose as well.
- Effective early warning systems are needed at the transboundary scale to communicate when hydropeaking operations or sudden reservoir drawdowns due to emergency management procedures at the dam site release water that can cause a flash flood in communities downstream. This is necessary in all 3S Basins as well as on their tributary rivers which have communities living below and between dams.
- To maximize downstream fishery productivity and agricultural production, minimum and maximum flow thresholds for seasonal storage dams should be determined in order to reduce the impacts dams deliver to seasonal flow regimes. Importantly, these flow regimes should be respected during wet seasons which are anomalously dry. In these times of wet season drought, dam operations can support a crisis management plan to increase flow during the wet season instead of reduce it and exacerbate drought.
- This research sheds light on hydrological manipulation of dams in the Sekong Basin, a basin often portrayed as a free-flowing river system since currently no dams are built on the Sekong mainstream. While the Sekong mainstream remains free-flowing for the time being (until the Sekong A Dam is completed in the coming years), more study into how dams impact the Sekong’s hydrological regime and ecological flows are necessary. The same can be said for the Sesan and the Srepok rivers. At best, dam operators should provide operational data to the Mekong River Commission and to the public to allow for the study and increased understanding of impacts of dams. With more data and research, it is possible to develop optimization models for cascade operations which generate ample electricity and reduce downstream impacts.
- The data suggest 3S dams can reduce monthly wet season flow for the Mekong mainstream to Stung Treng, Cambodia by more than 3%. This 3% flow reduction is on top of flow restrictions from dams upstream which can cumulatively reduce flow by 10-20%. The data also suggest 3S dams can increase monthly dry season flow of the Mekong mainstream by at least 22%. Vietnam is unlikely to build more large dams in its upstream portions of the 3S Rivers, but Laos and Cambodia do have plans for significant hydropower expansion. If newly developed dams have significant active storage, then the mainstream Mekong flow reductions and increases above will worsen. Acceptable limits for flow alteration to the Mekong mainstream at the monthly and seasonal levels should be determined and agreed upon prior to the buildout of new dams if a robust wet season flood pulse is to persist.
Methods
To develop estimates of descriptive features of these 20 reservoirs and a time series detailing their operations from 2017-2022, we use remote sensing and satellite imagery inputs to estimate reservoir level (meters above sea level) and GIS processes to convert reservoir level estimates to volume estimates.
Calculating reservoir level estimates (altimetry published in meters above sea level)
Reservoir levels calculations use a modification of in Gulácsi and Kovács23 Note: Gulácsi A, Kovács F. Sentinel-1-Imagery-Based High-Resolution Water Cover Detection on Wetlands, Aided by Google Earth Engine. Remote Sensing. 2020; 12(10):1614. https://doi.org/10.3390/rs12101614 method to classify reservoir shorelines using Sentinel-1 SAR data and Google Earth Engine and generate altimetry estimates on ArcGIS. The method is described in detail on the Mekong Dam Monitor’s methods page. This method and volume estimates are calculated using methods described on the Mekong Dam Monitor’s methods page. Validation processes demonstrate this method produces a mean elevation shoreline typically within +/- 2.5 meters of actual reservoir levels. A final spot-check using Planetscope 3 meter optical resolution imagery improves the accuracy of the estimates to within about +/- 1 meter of actual reservoir level. The aforementioned error results were confirmed by a blind validation process conducted through an analysis of reservoir levels across the year of 2019 for the Nam Khan 2 dam in Laos.
The following dams (Table 3) analyzed in this study do not require virtual gauge estimates because daily reservoir altimetry estimates are available via Electricite Du Laos (EDL) and Electricity Vietnam (EVN) public data portals. We tested these published altimetry estimates using the virtual gauge process to check on their accuracy and believe what is reported via these portals to be accurate. Among the dams listed, only the Houay Lampang Ngai dam produces volume estimates as well as reservoir altimetry. Therefore, volumes for all other dams are still determined by the “Calculating Volume Estimates” process below.
Calculating Reservoir Volume Estimates (volume published in cubic kilometers)
Volume level estimates are arithmetically calculated using elevation readings from the ALOS digital elevation model (DEM) and established full reservoir levels. This process is described in more detail on the Mekong Dam Monitor’s methods page. The established reservoir levels at full storage capacity determine the maximum altitude in meters above sea level for each given reservoir.
The project team has derived look-up tables detailing reservoir volume at one-meter increments for all dams monitored on the Mekong, corresponding to the altimetry estimates of reservoir levels. Volume readings are used to estimate dead and active storage levels. Dead storage is the volume of water held behind a dam wall and below the outflow level, and thus is likely permanently stored upstream. Active storage is water that is above the outflow level is available to flow through the dam for hydropower production or put to other uses. Active storage is calculated by finding the difference between the total volume reading for a given week and the known or estimated dead storage level for each reservoir. For reservoirs which were filled prior to the publication date of the ALOS DEM, it is impossible to calculate dead storage levels since the bottom elevation of the DEM does not capture the original elevation levels of the undammed river. Therefore, in this study, we only focus on publishing active storage data which can be gleaned from reservoirs which filled prior to the publication of the DEM.
Importantly, some dam operators and investors publish descriptive information regarding storage volumes for reservoirs. However, information is often inconsistently published, fails to clearly define how quantities are determined, and contradicts reservoir values from other sources such as sovereign governments or power utilities, leading to confusion. For instance, some published information specifies quantities for active storage volumes, but other published information will only list total storage quantities or may mislabel active storage as a total storage. Publications often do not specify whether total storage is determined by bottom of the reservoir to a normal service level, maximum flood level, or the top of the dam. Because of this lack of continuity and standardization in published information on reservoir volumes, we prefer setting maximum and minimum levels of storage using the method above due to its consistency. We reference published information while calibrating lookup tables, but we do not rely on it.
Acknowledgements
The authors of this paper would like to thank the USAID Wonders of the Mekong Program for the support of this study. This study was completed using processes established by the Mekong Dam Monitor project which his supported by the Mekong-US Partnership’s Mekong Water Data Initiative, the Chino Cienega Foundation, and the Prudence Foundation. The authors of this study would also like to thank the Mekong River Commission for its public access data portal as well as Electricity Vietnam and EDL-Gen for making their reservoir indicators available for public access. The authors also thank the peer reviewers of this study who provided useful commentary which significantly improved the accuracy and impact of this study.
Recent & Related


Find an Expert
Home to more than 100 scholars and global affiliates, the Stimson Center is proud to be a magnet for the world’s leading experts on the most pressing foreign policy and national security issues of our time. Explore our experts and their work.


Community Adaptation for a Water Festival Without Clean Water