Check out the Mekong Dam Monitor’s biggest update with lots of new features that make the MDM’s information more accessible to a wider audience of Mekong Watchers. From local language versions to smart phone accessibility and much more, this newest Mekong Dam Monitor is easy to access and understand. It’s also faster and ready for use on your smartphone. See details below.
Local Language Versions:
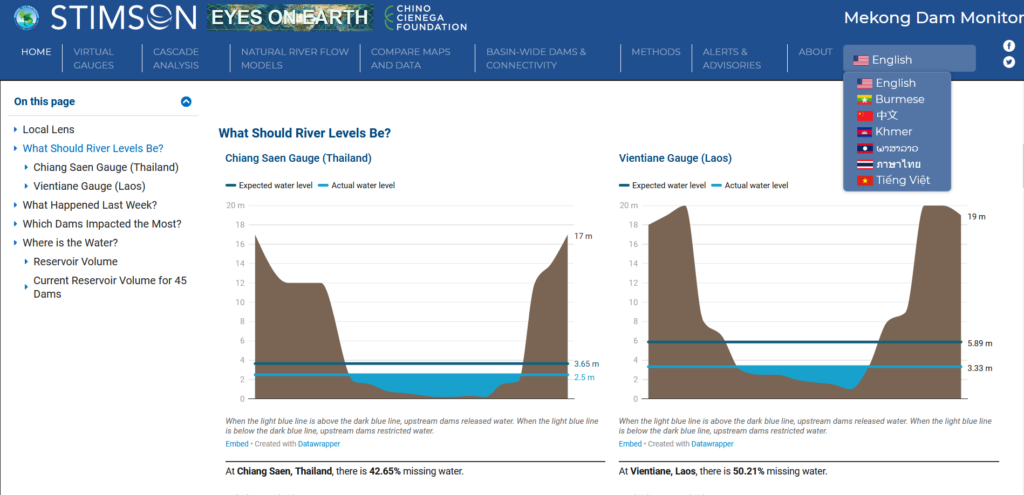
All features on the Mekong Dam Monitor are now viewable in SEVEN languages. Locate the language box on top menu to choose from Burmese, Chinese, Khmer, Lao, Thai, and Vietnamese language versions. Big thanks to the MDM translating team for getting the local language versions ready for launch.

New Home Page:
Check out the MDM’s new landing page filled with interactive features designed for the average viewer. After numerous rounds of focus groups and consultations, this home page has everything you need to get a full picture of how dams are impacting the Mekong.

Local Lens
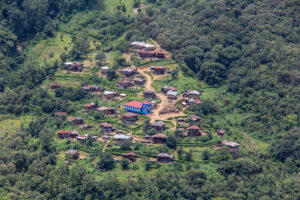
Each week you’ll see photos submitted by local Mekong citizens showing livelihoods, culture, and the environmental situation along the Mekong. One photo will serve as photo of the week, and photos will be cycled out after a month.

Click on the “Share your photos” button to submit your own photos.
What Should River Levels Be?
Here you can easily compare how much water should be in the river against how much water is actually in the river. The example below shows river levels at Chiang Saen, Thailand. The current level is 2.5 meters, but Eyes on Earth estimates the level should be 3.65m. Why the difference? Upstream dams are restricting river flow in their reservoirs.

Check out new river level comparisons for Stung Treng, Cambodia and Chau Doc, Vietnam.
What Happened Last Week?
Each week, you can read a 250-word summary of what happened last week. You can find out which dams produced the greatest impacts, how much water is missing from the Mekong, and where extreme conditions of drought and flood were found in the basin. Sign up for weekly email delivery of these summaries at the top of the home page.
Which Dams Made the Most Impact?
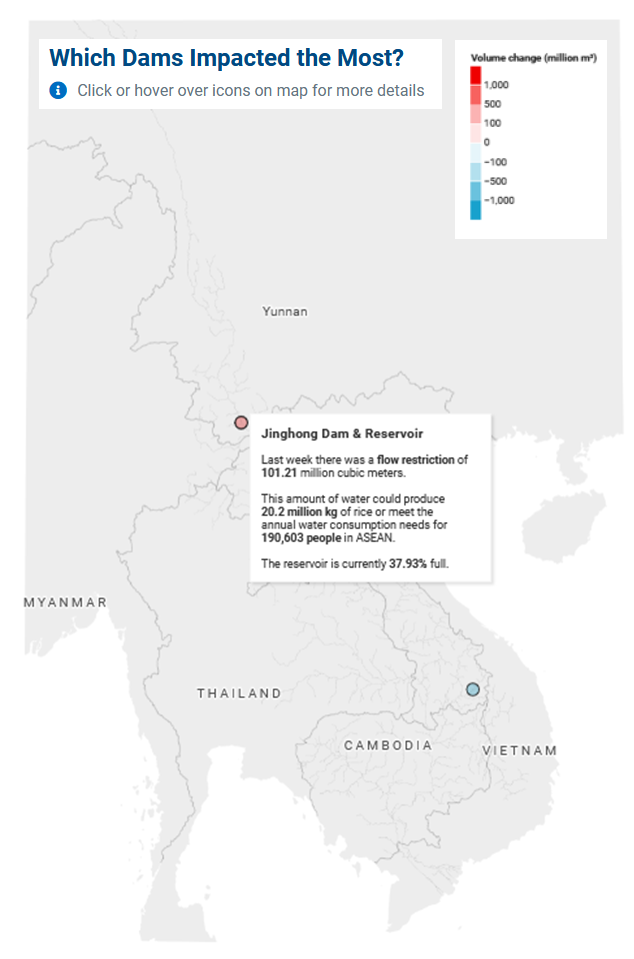
This feature shows the location of dams which released (blue) or restricted (red) more than 100 million cubic meters of water last week. Click on the locations to see how much water they released or restricted and how that could impact water use and rice production.
Where is the Water?
This is one of the MDM’s most valuable features. It tells you an estimate for how much water is currently stored in the reservoirs of all 45 dams we monitor and shows changes week to week.
See how the total usable water is around 40 billion cubic meters at the end of November 2021 but in early July is about 10 billion cubic meters? The difference is the amount of water those 45 dams stored over the course of the 2021 wet season – about 30 billion cubic meters! That’s a lot of water and when the downstream experiences wet season droughts, that water could be used to relieve drought. Instead, it will likely be released during the dry season for hydropower production.
Note how China’s Xiaowan Dam (blue) and Nuozhadu Dam (green) at any one point in time each hold about the same amount of water as the 40 dams in grey? That shows just how large Xiaowan Dam and Nuozhadu Dam are! The reservoirs of these two dams are huge, and they wield a lot of power to restrict or release flow to the downstream.
There’s an interactive list of dams below this chart which shows how much water is currently in each of the 45 dams we monitor.
Easily View Satellite Images of Dams and Sites Along the River
Satellite images are now easily accessed by clicking on the name of the dam you’re looking for in the list on the Virtual Gauges page – or by clicking on dam location on the map.
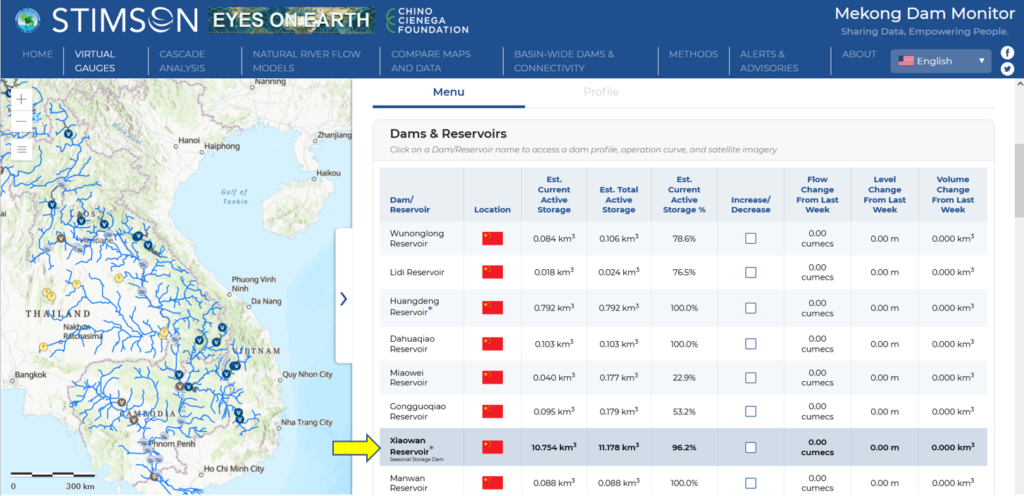
Scroll below the operating curves to see the most recent satellite image of a dam or river site.
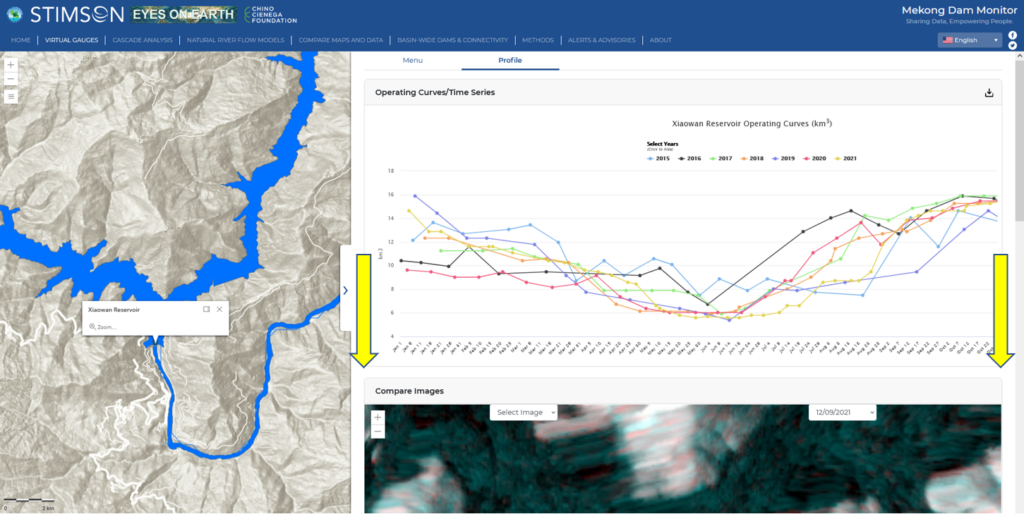

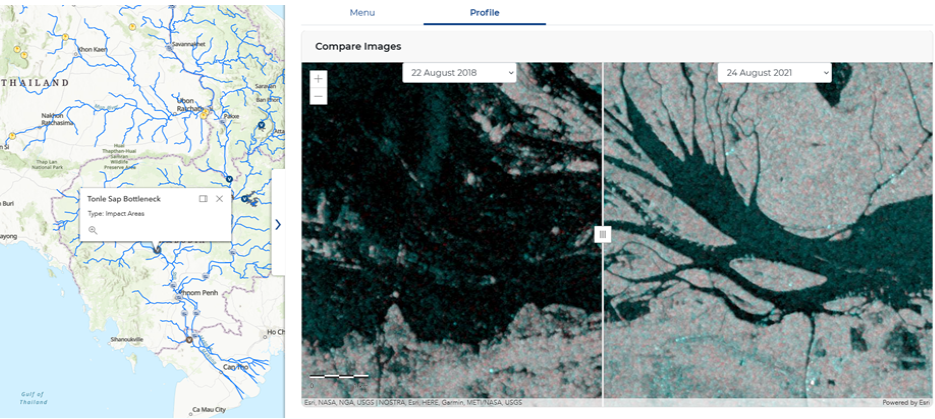
Use the pull-down menus to compare two satellite images from over five years of historical images.
More Dams!
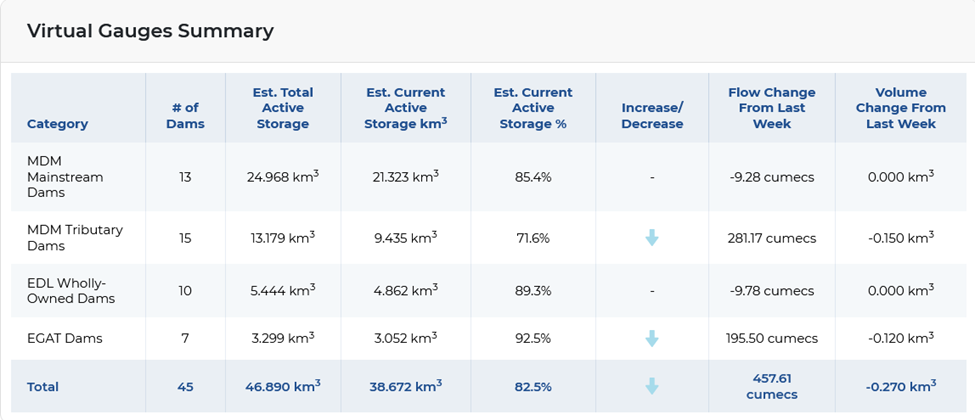
The Electricity Generating Authority of Thailand (EGAT) and Lao PDR’s Electricité du Lao (EDL) each have public facing websites that provide hourly and daily information about dams. By incorporating data on 10 EDL dams and 7 EGAT dams into the MDM, you now have a better picture of how much water is being stored or released from major reservoirs throughout the basin.
| EDL Dams | EGAT Dams |
| Nam Ngum 1 | Ubol Ratana |
| Nam Khan 2 | Sirindhorn |
| Huoay Lamphan Ghnai | Chulabhorn |
| Xeset 1 | Huai Kum |
| Xeset 2 | Nam Pung |
| Nam Leuk | Pak Mun |
| Nam Mang 3 | Lam Tak Khong |
| Nam Sana | |
| Selabum |
With this information, you can find important summary information about water availability throughout the basin across 45 dams monitored. Check out the new summary table on the Virtual Gauges tab which shows useful information like current amount of active storage (usable water) available on a weekly basis, percentage amount of active storage, and volume and flow changes.
Better Maps!
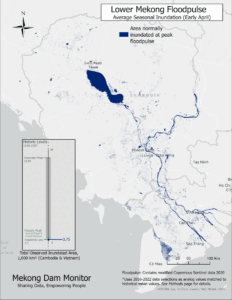
No more Wetness maps with large pixels! Now all new maps available in our Compare Maps and Data Tab are at a 9X higher resolution. This includes Wetness Anomaly, Precipitation Anomaly, Temperature Anomaly, and Snow Cover Anomaly.
You can see the difference in comparing a before/after images of the Wetness Index Anomaly. See how much more detailed the new maps are?

Please take time to explore the new MDM – and try it out on your smart phone!
Many thanks to Anna Belani and all those who participated in focus groups and consultative processes to develop this update. And we're grateful to the Mekong-U.S. Partnership, Chino Cienega Foundation, and The Prudence Foundation for funding to support this and other updates into the future.

