 Alert: 02/22/2025
A sudden release of water at dams in China will cause the Mekong River to rise 0.50 meters at Chiang Saen, Thailand on February 24.
Alert: 02/22/2025
A sudden release of water at dams in China will cause the Mekong River to rise 0.50 meters at Chiang Saen, Thailand on February 24.
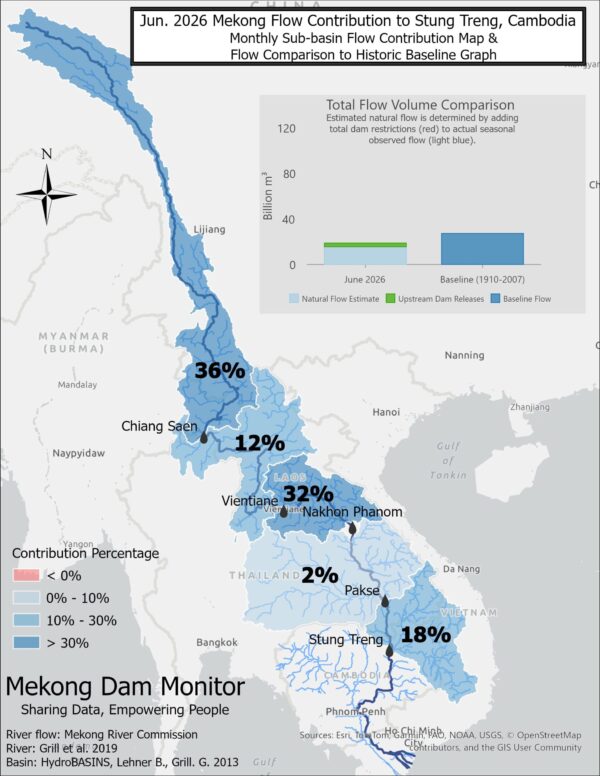
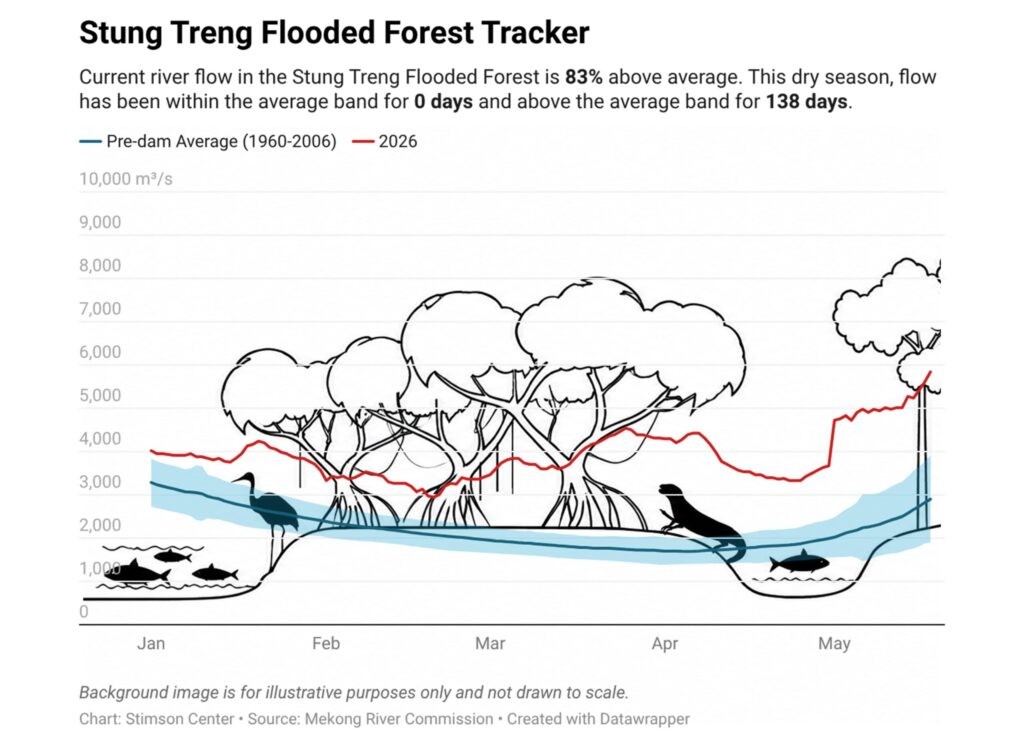
June Mekong Natural Flow Extremely Low
The 2026 Mekong Wet Season is not off to a good start. The chart in the image below shows that 15 cubic kilometers of natural flow would have passed by Stung Treng, Cambodia in June 2026 compared to the normal pre-dam mean of 27.16 cubic kilometers. Dam releases in June actually contributed to higher river levels, raising the river to nearly 19 cubic kilometers of flow–still far lower than the pre-dam average. Low river levels are the result of a weak monsoon forming so far this wet season. Rainfall contributions from Thailand’s portion of the Mekong are particularly low. Scientists estimate that the forecasted El Nino will result in lower than usual rainfall during the later months of the wet season. This means that the 2026 wet season could be abnormally dry. Until rainfall conditions improve, dam operators should exercise restraint when filling their reservoirs to protect the Mekong fishery and seasonal agricultural productivity downstream.
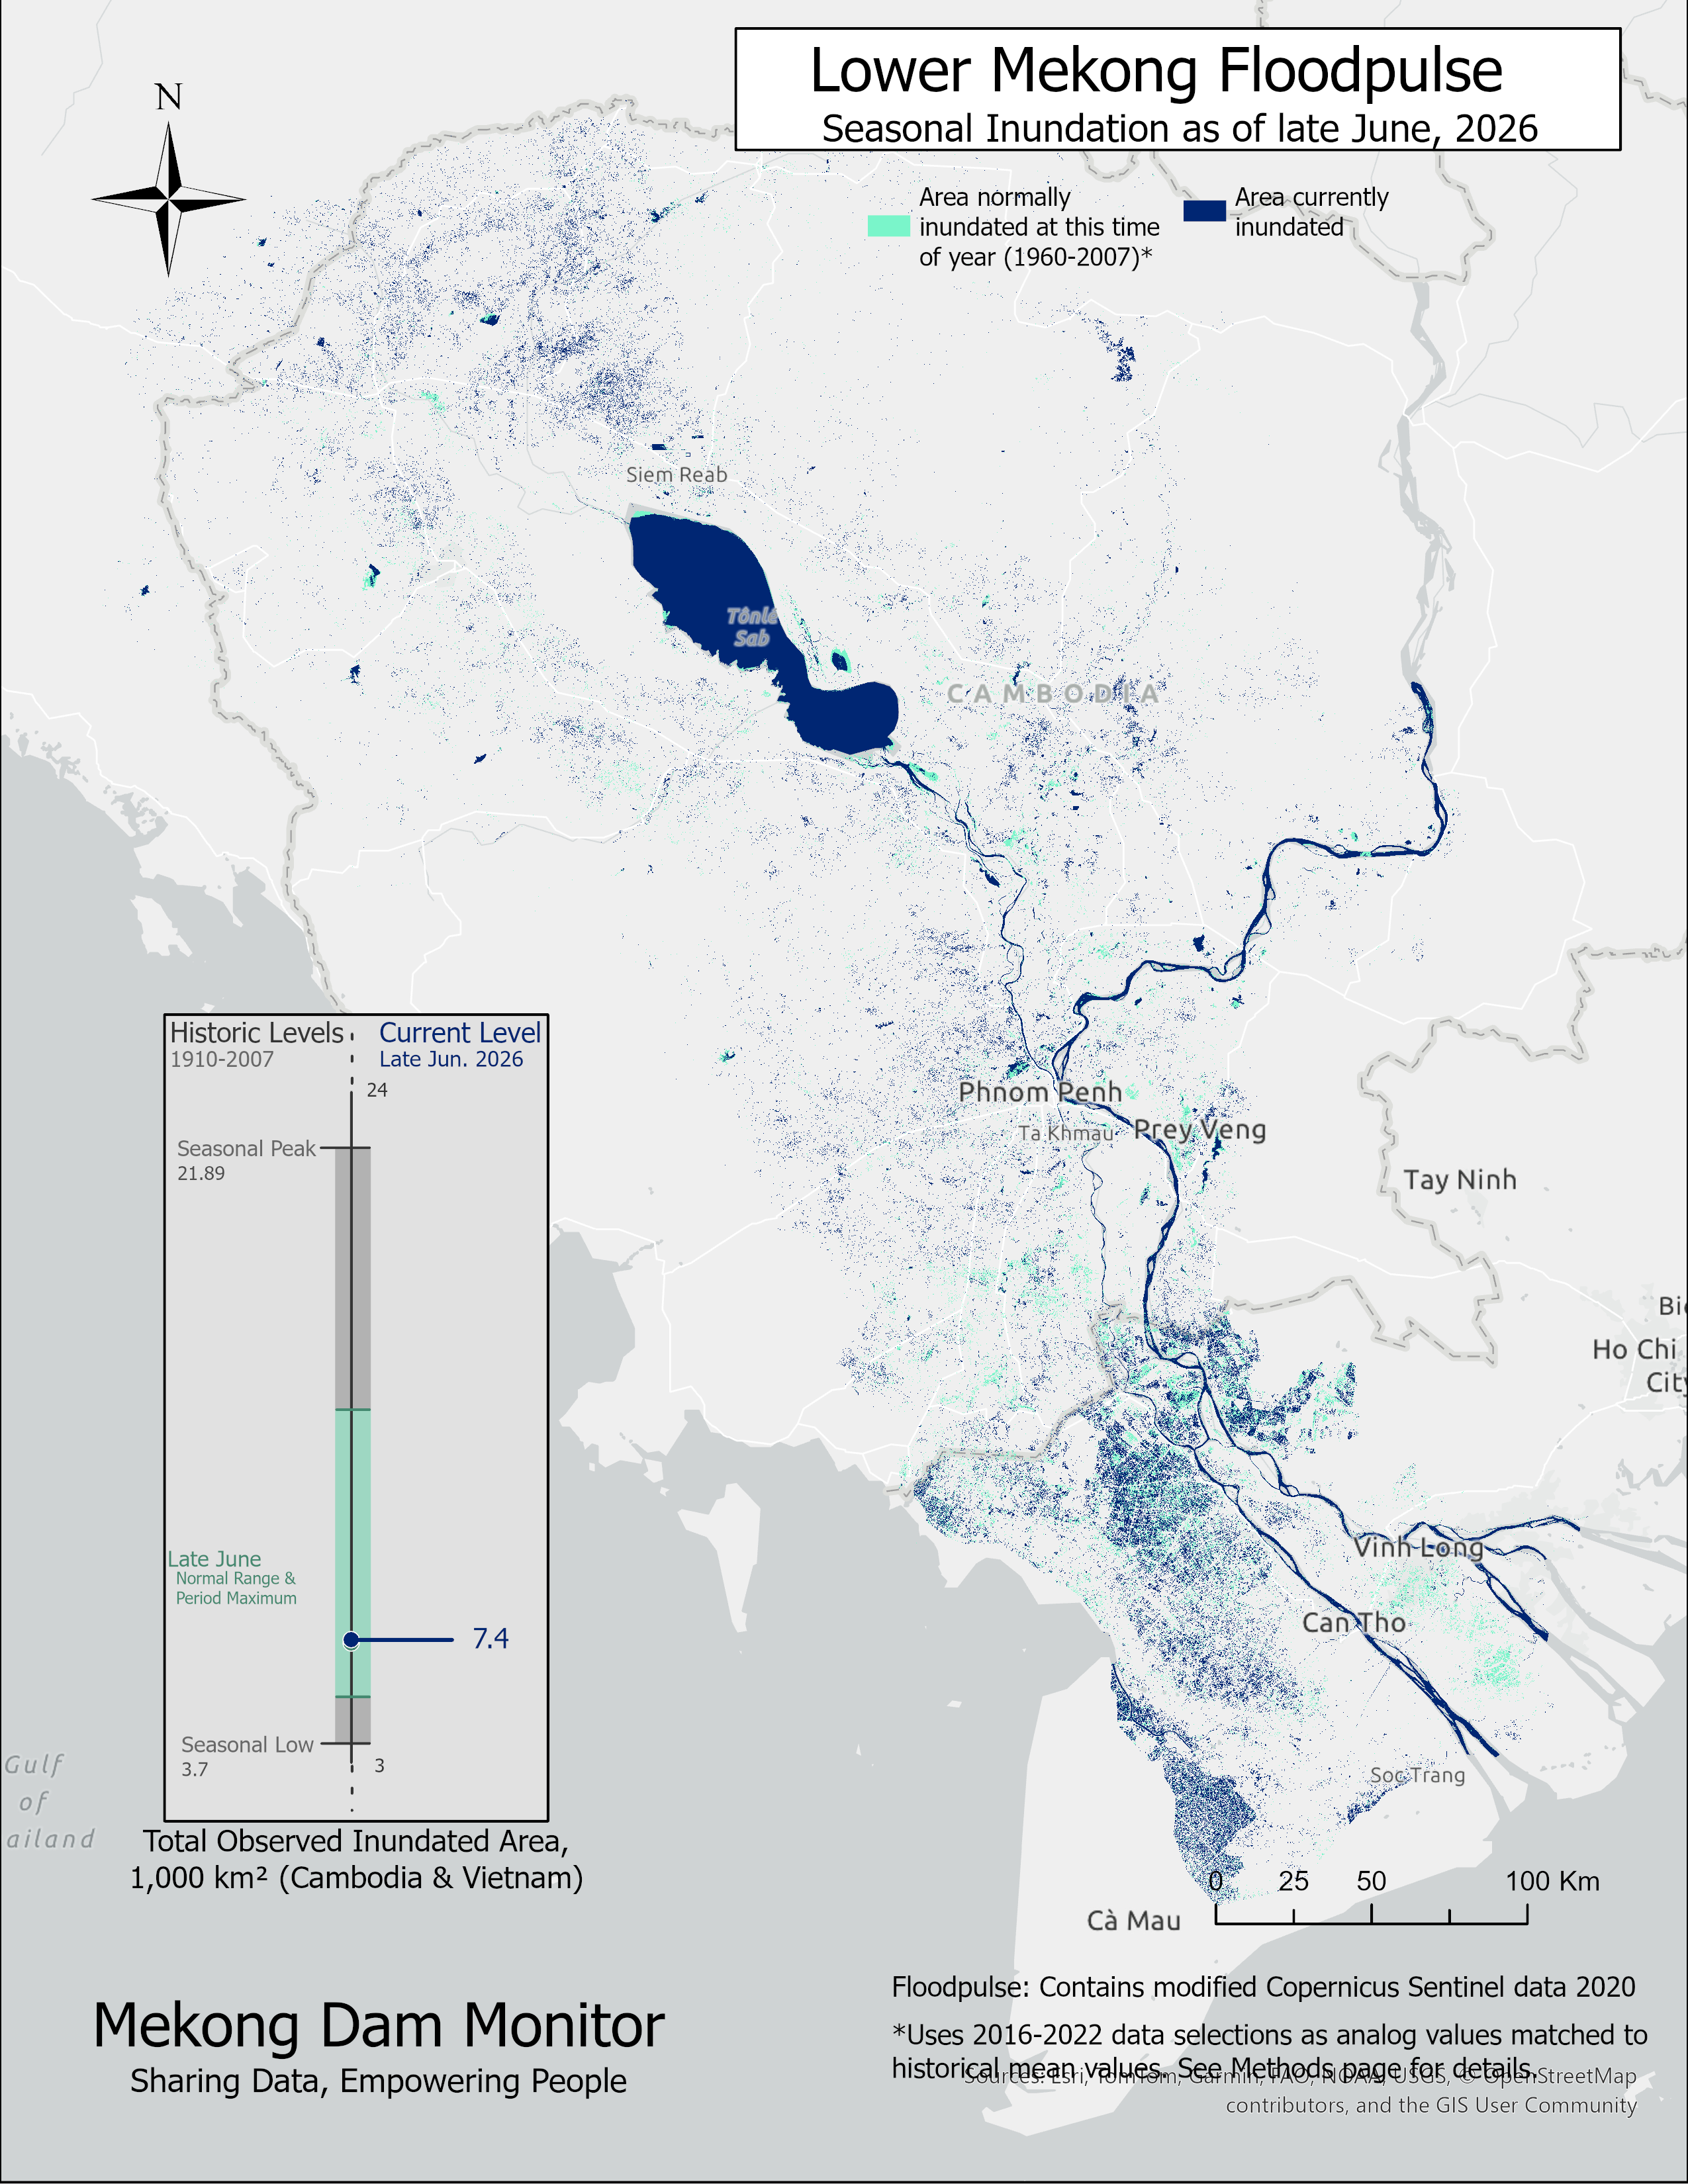
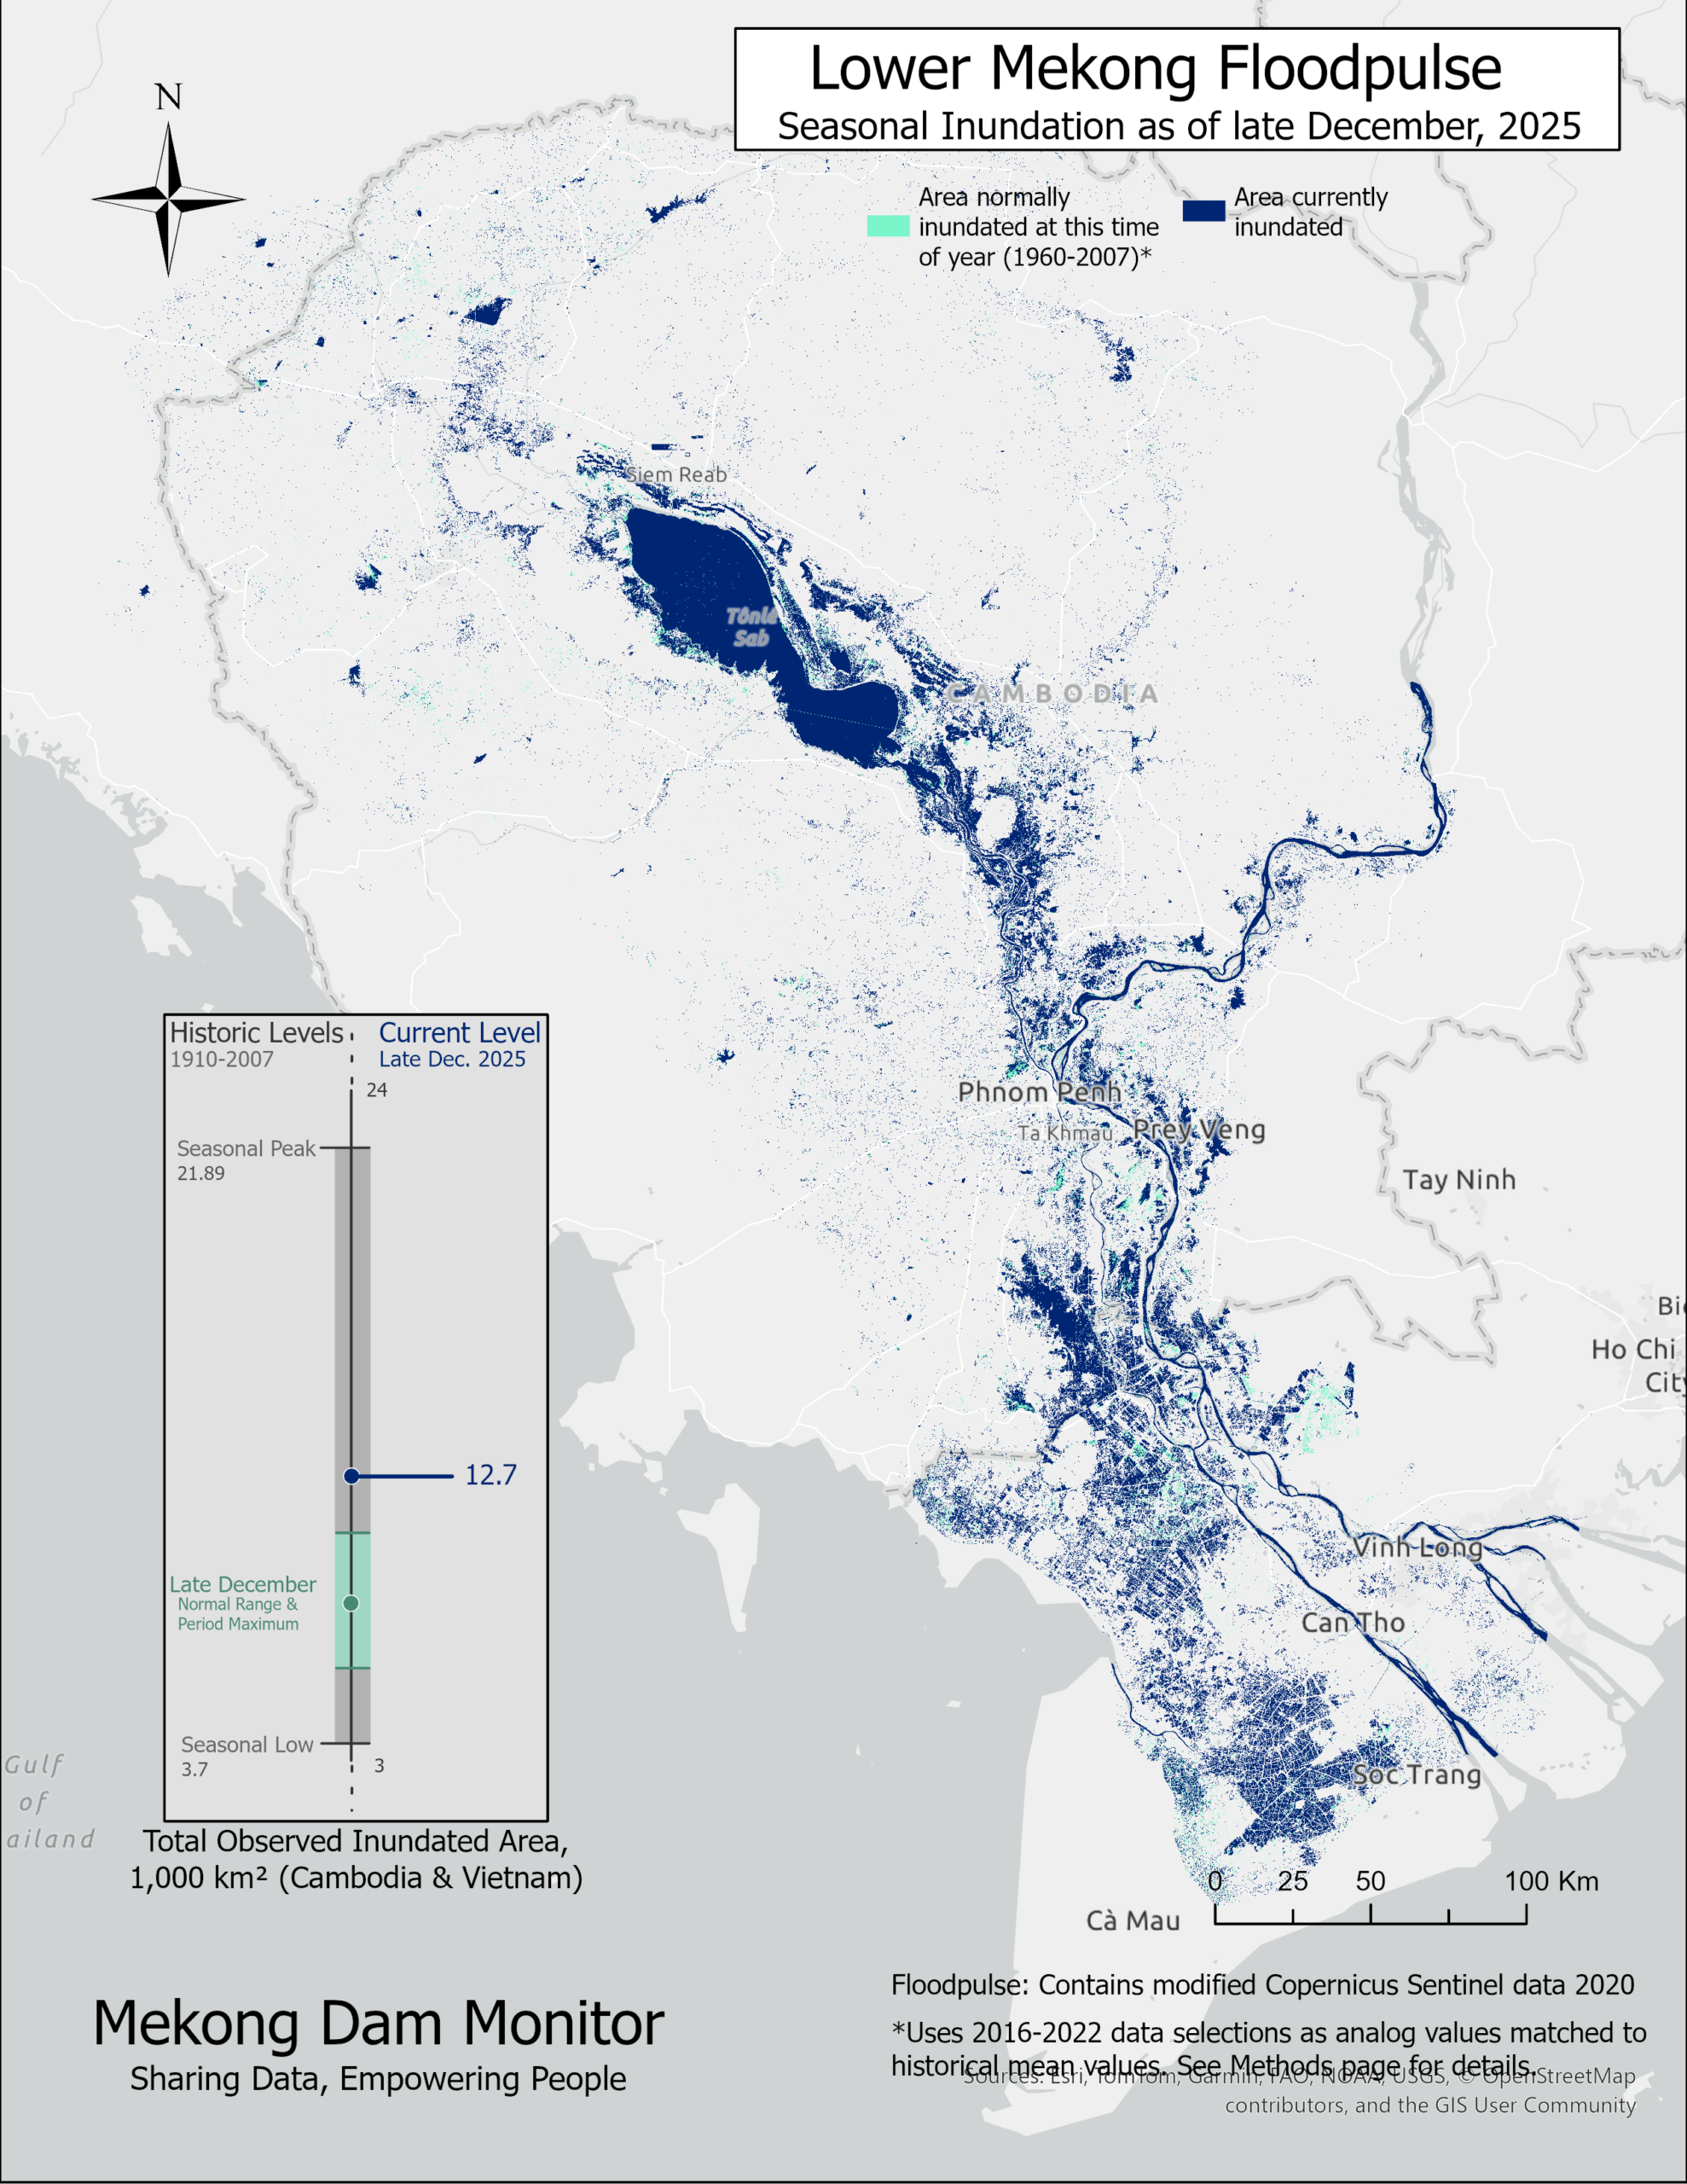
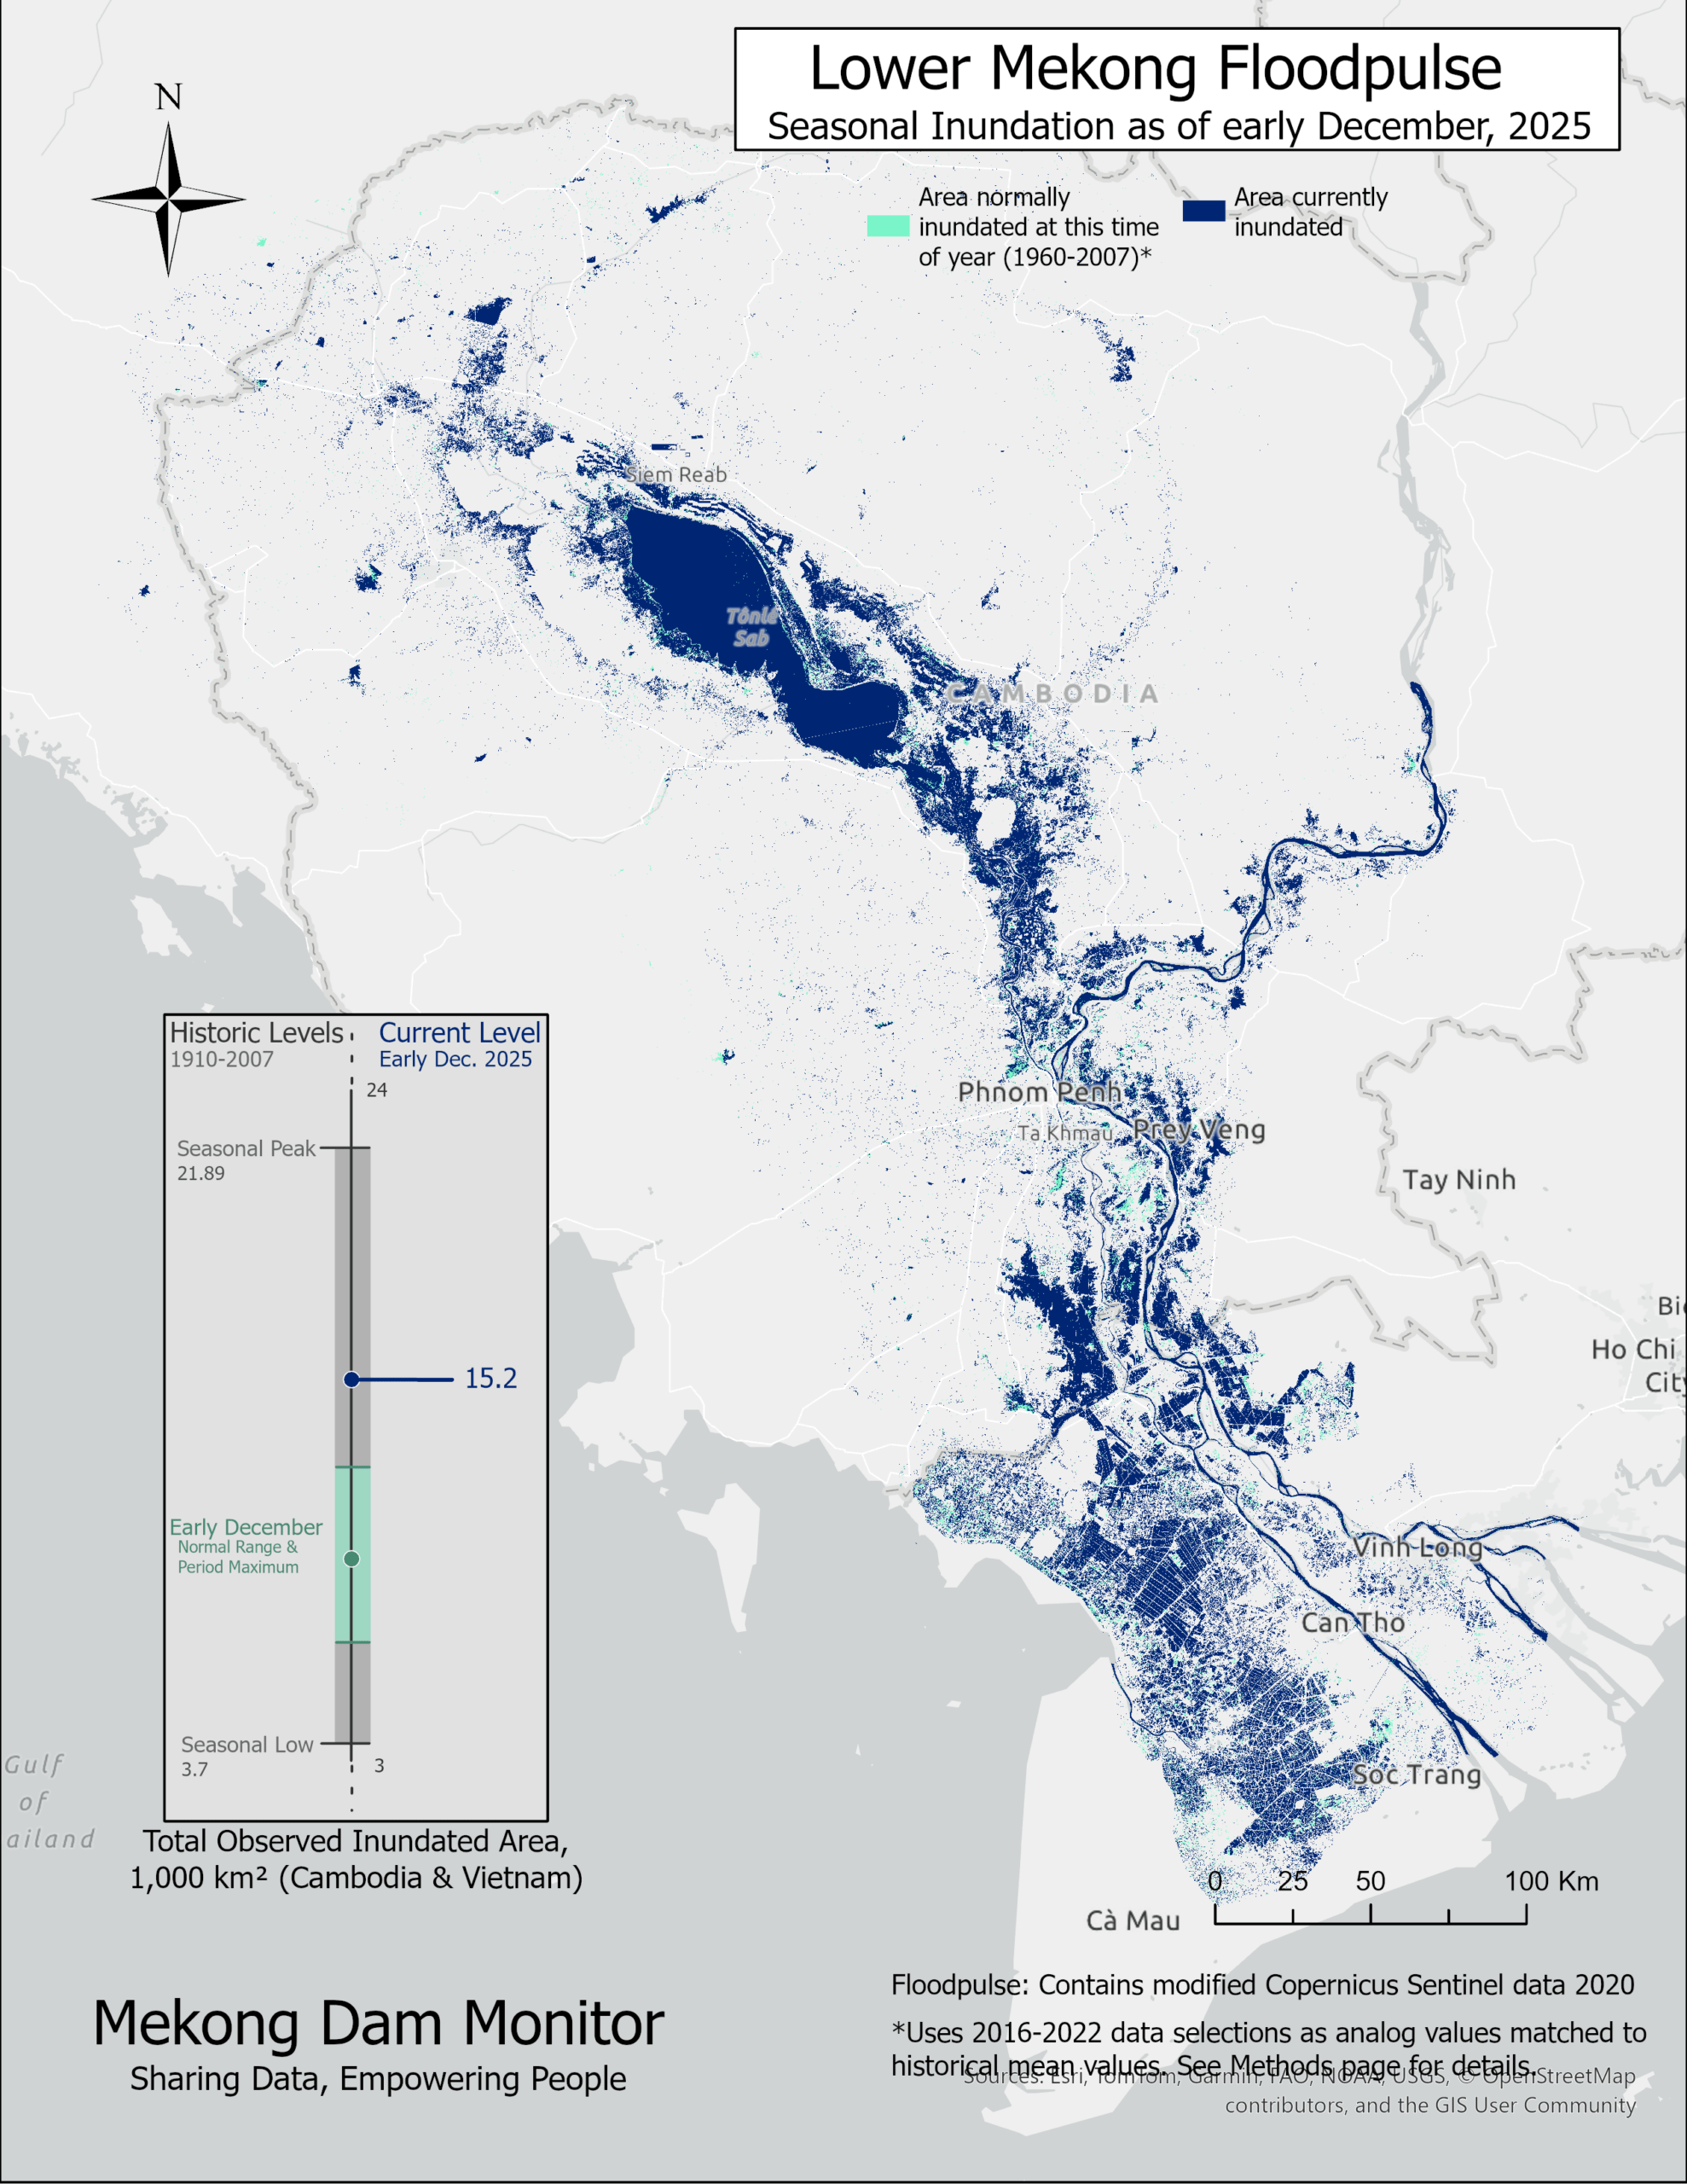
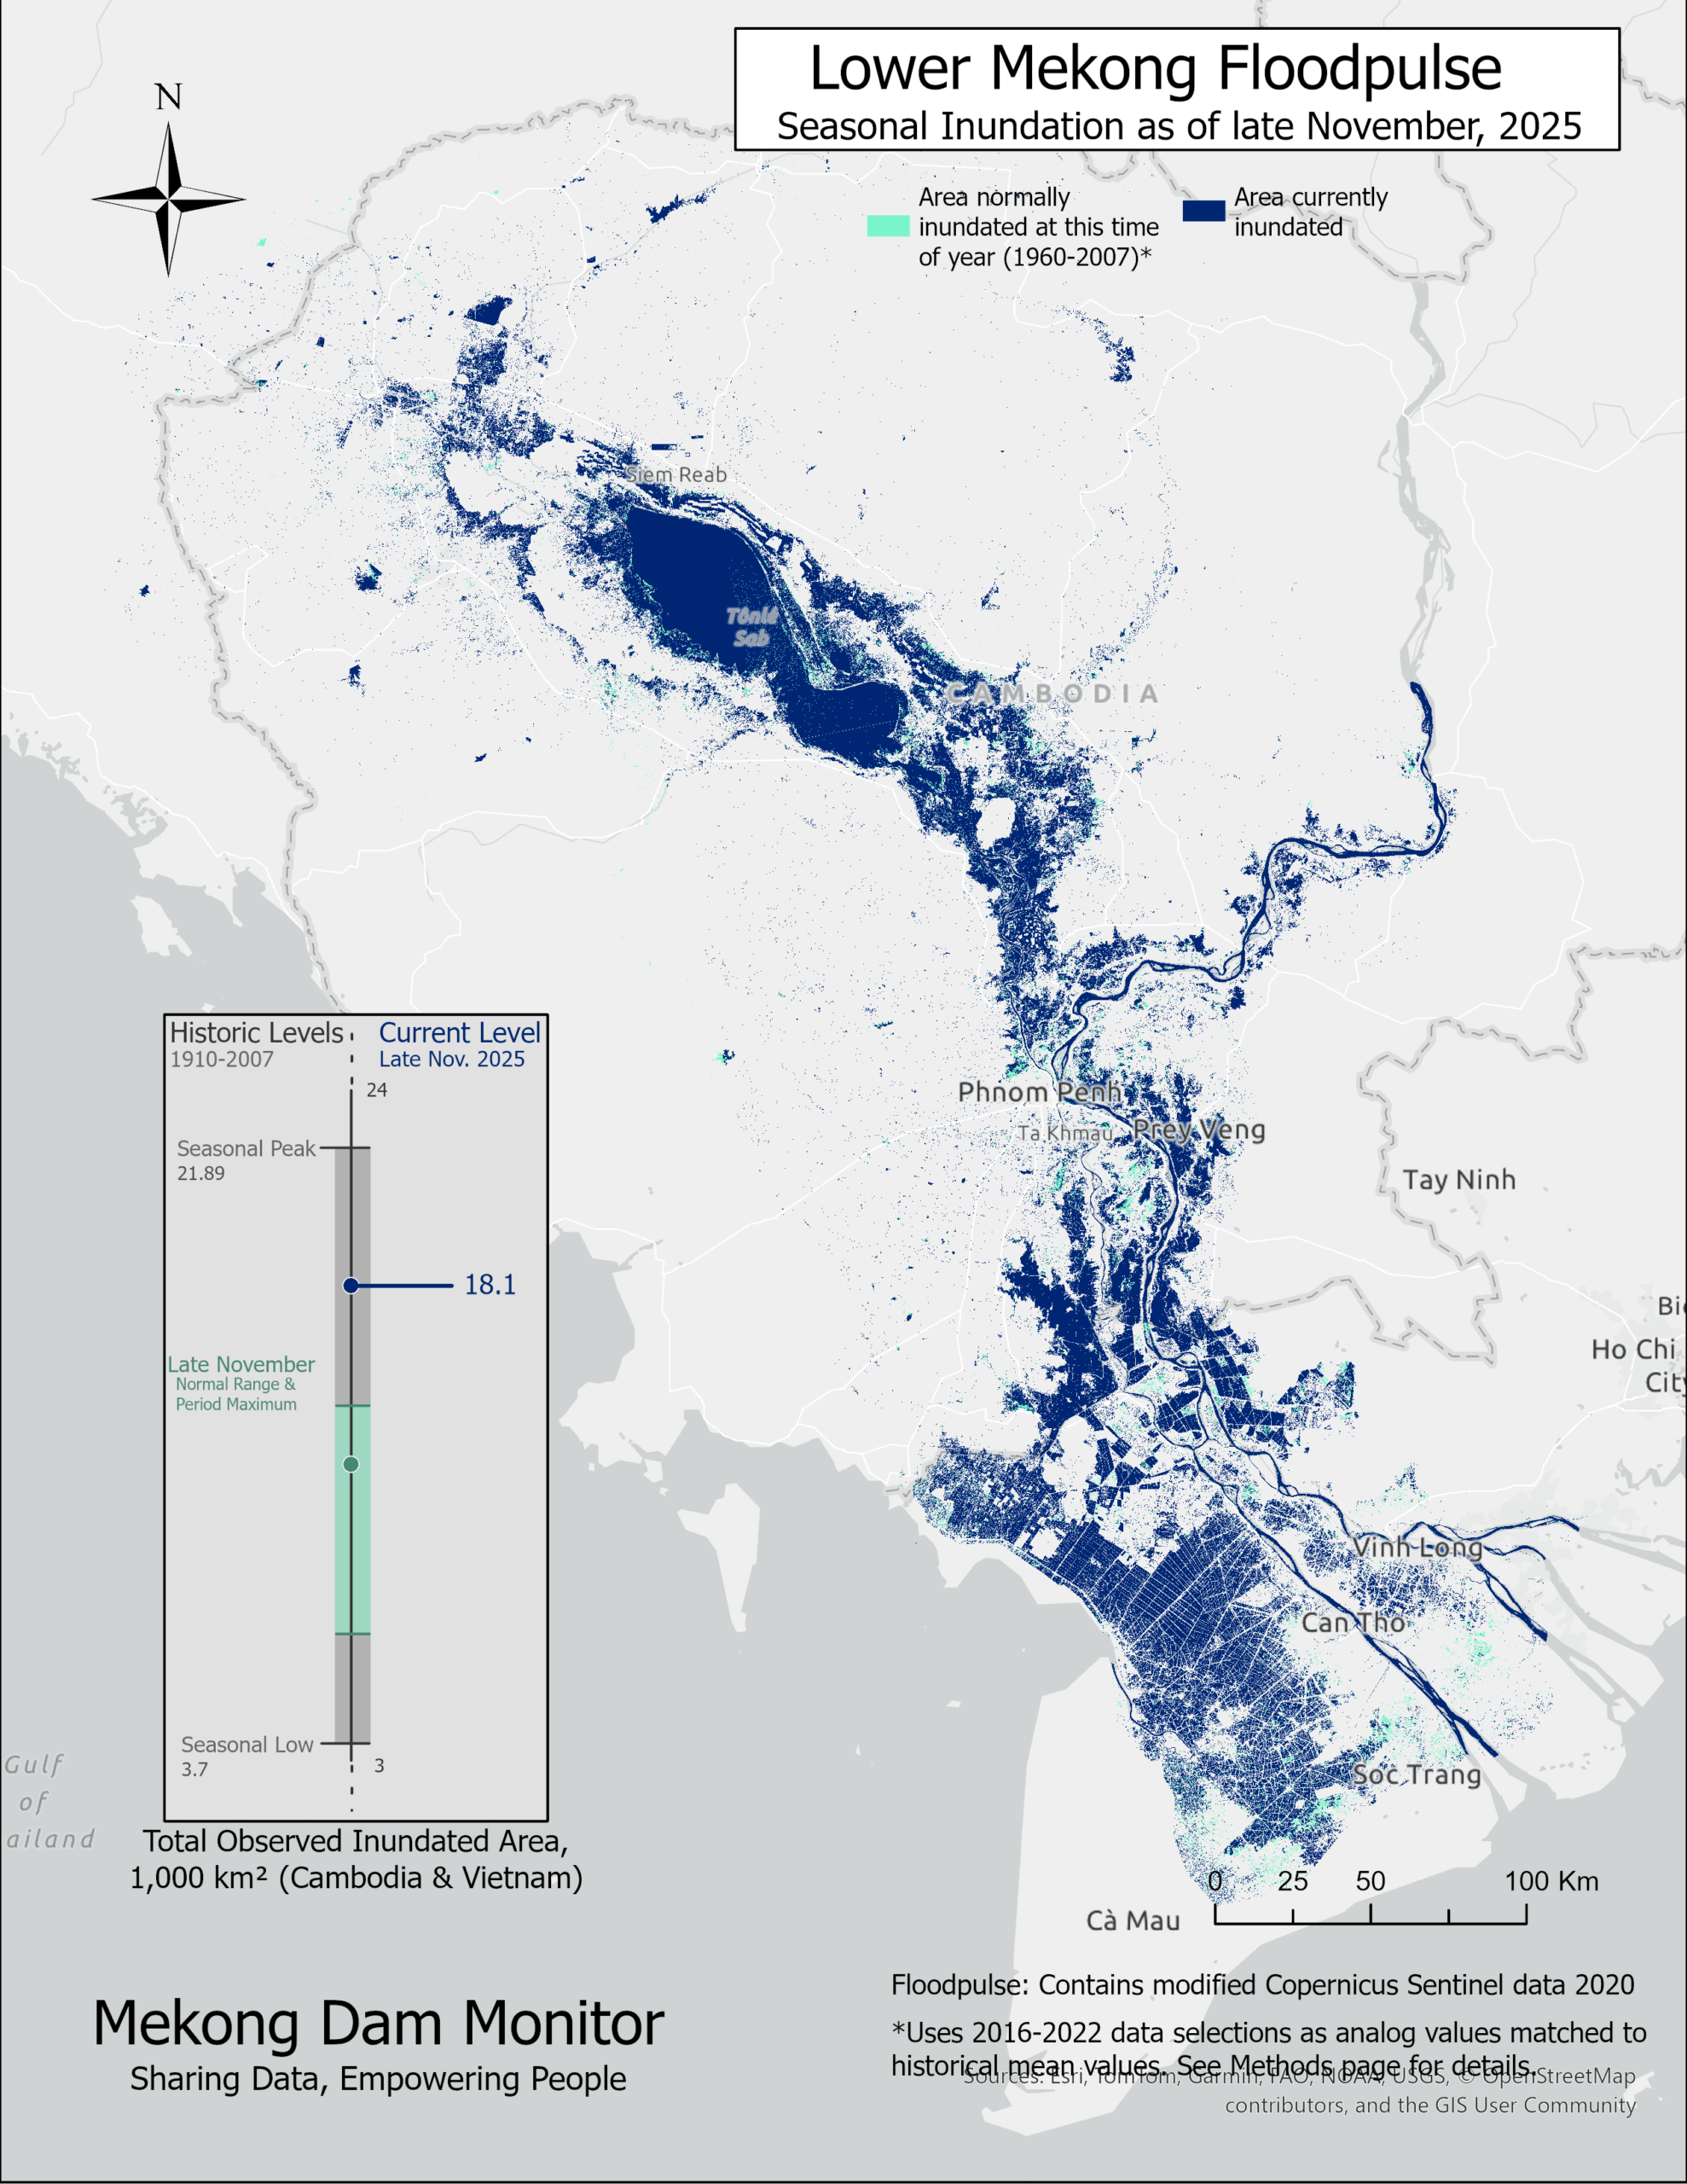
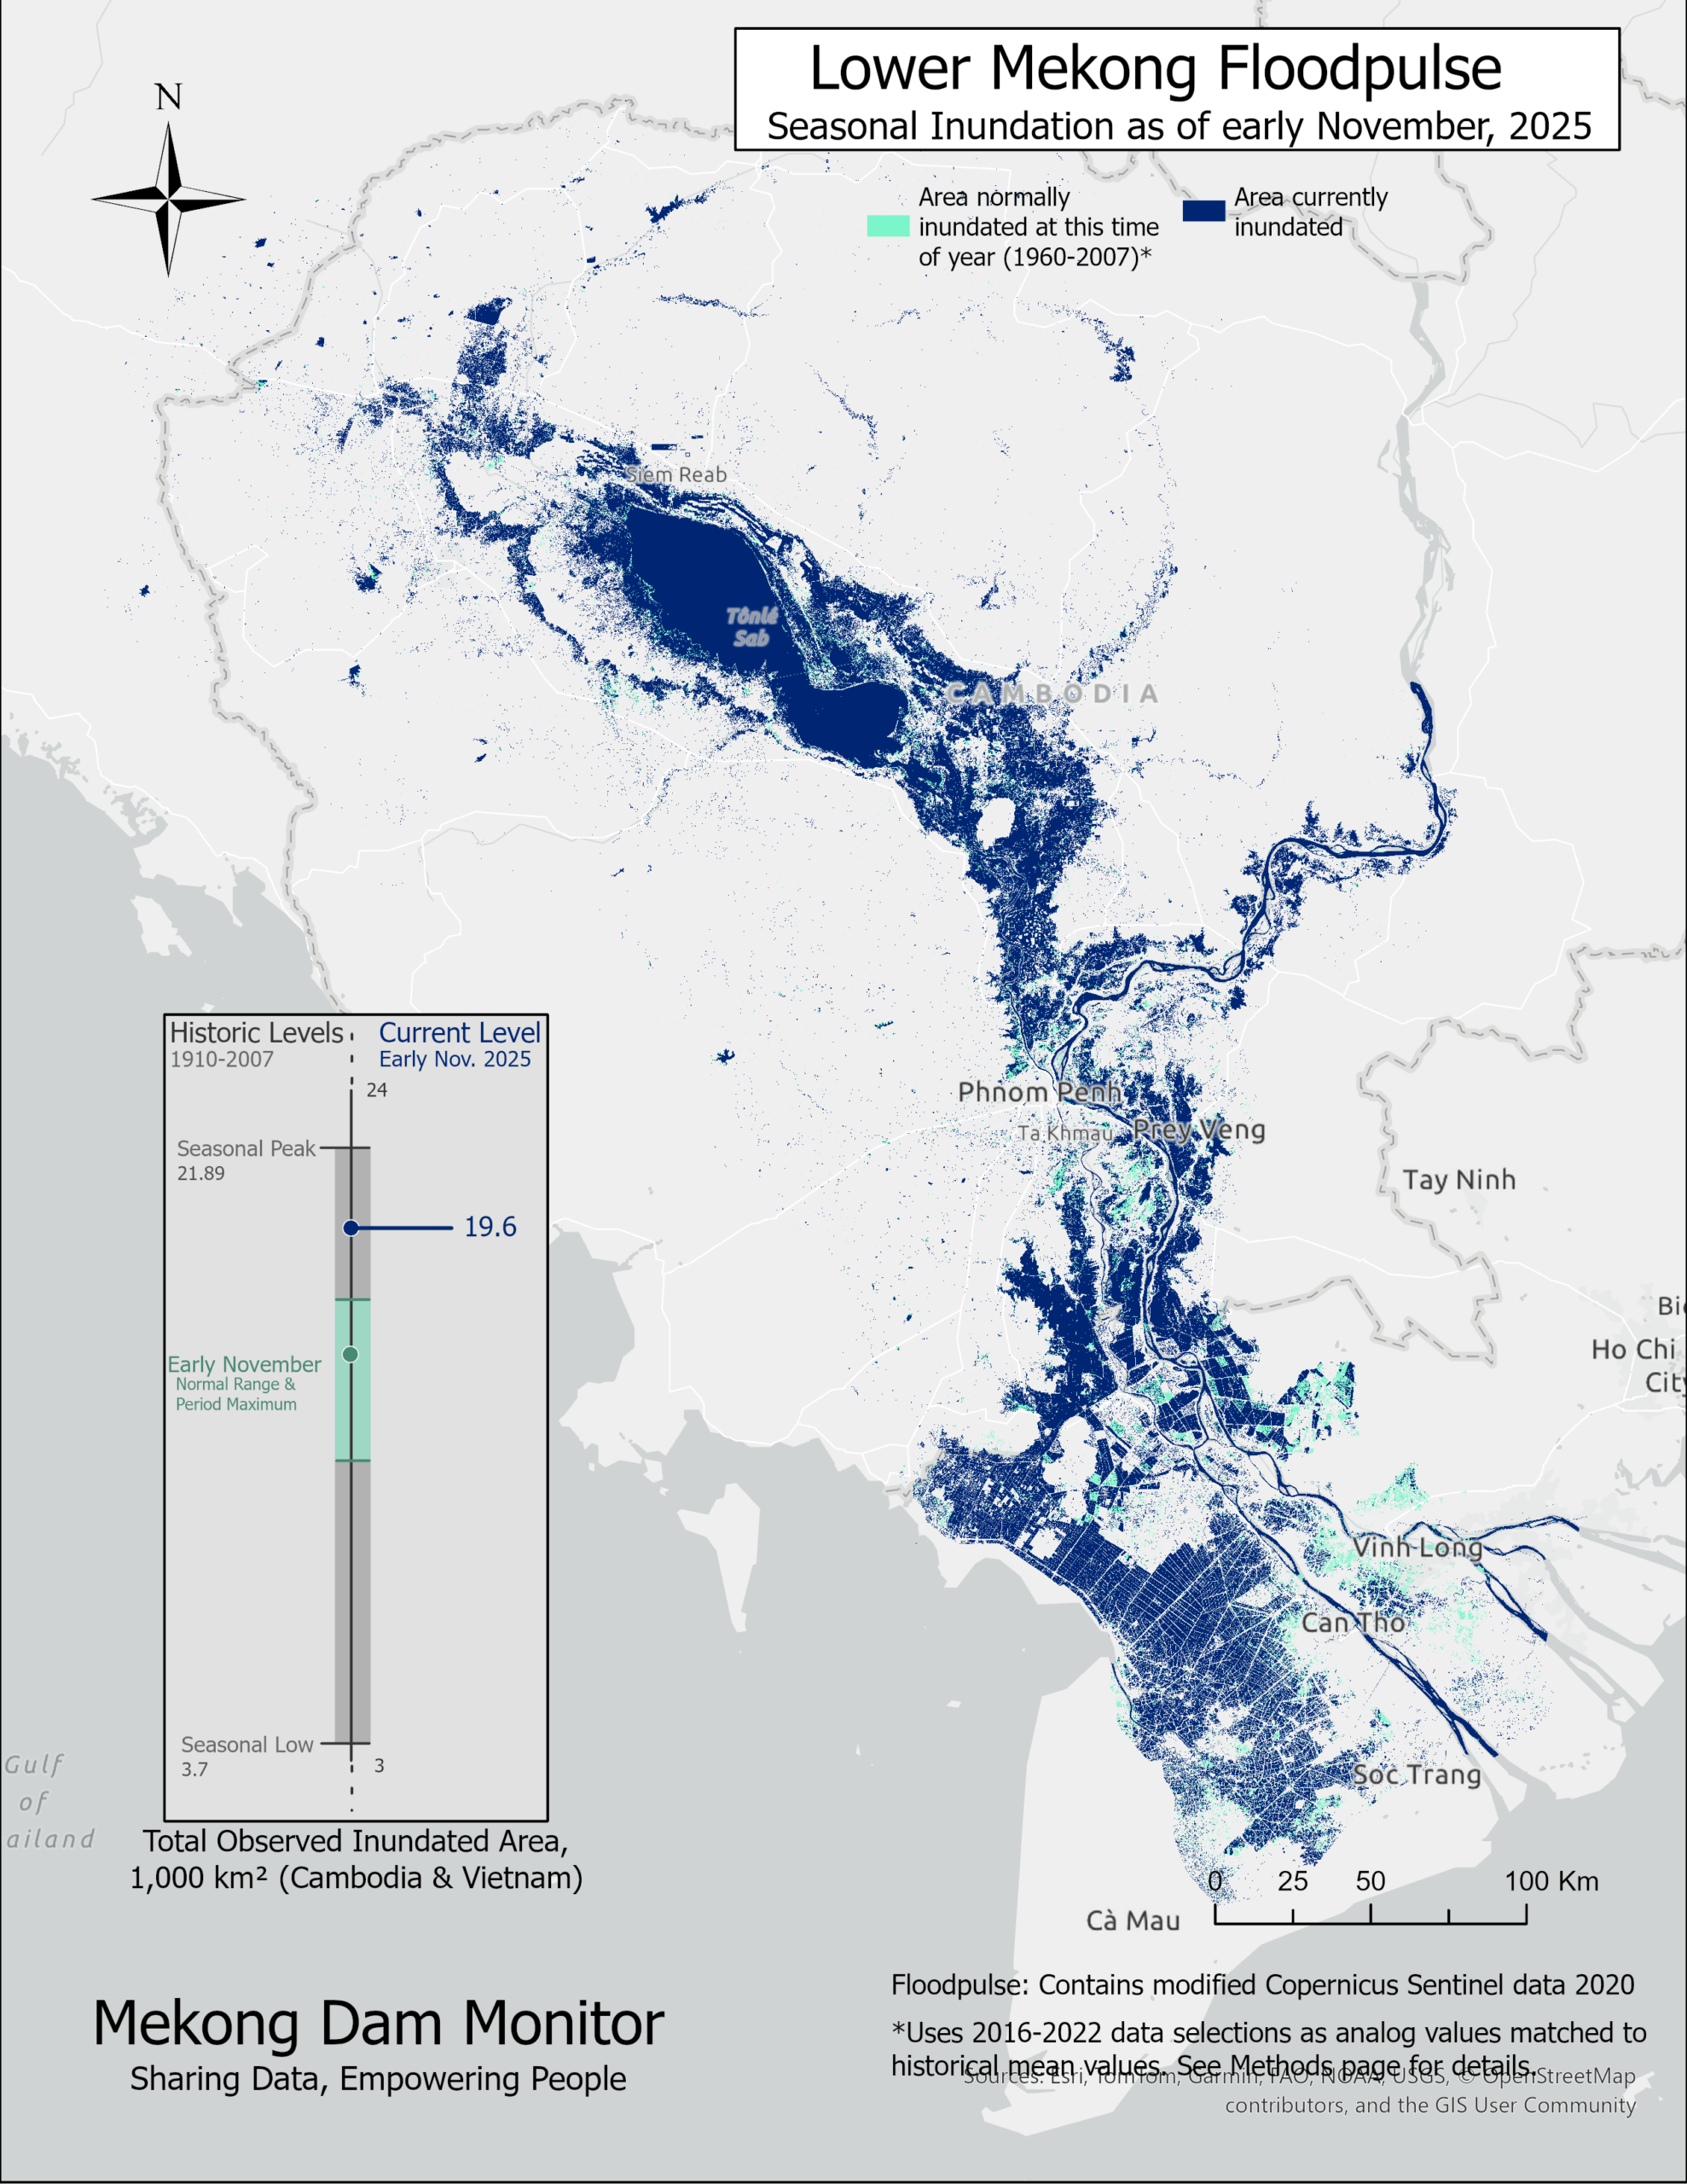
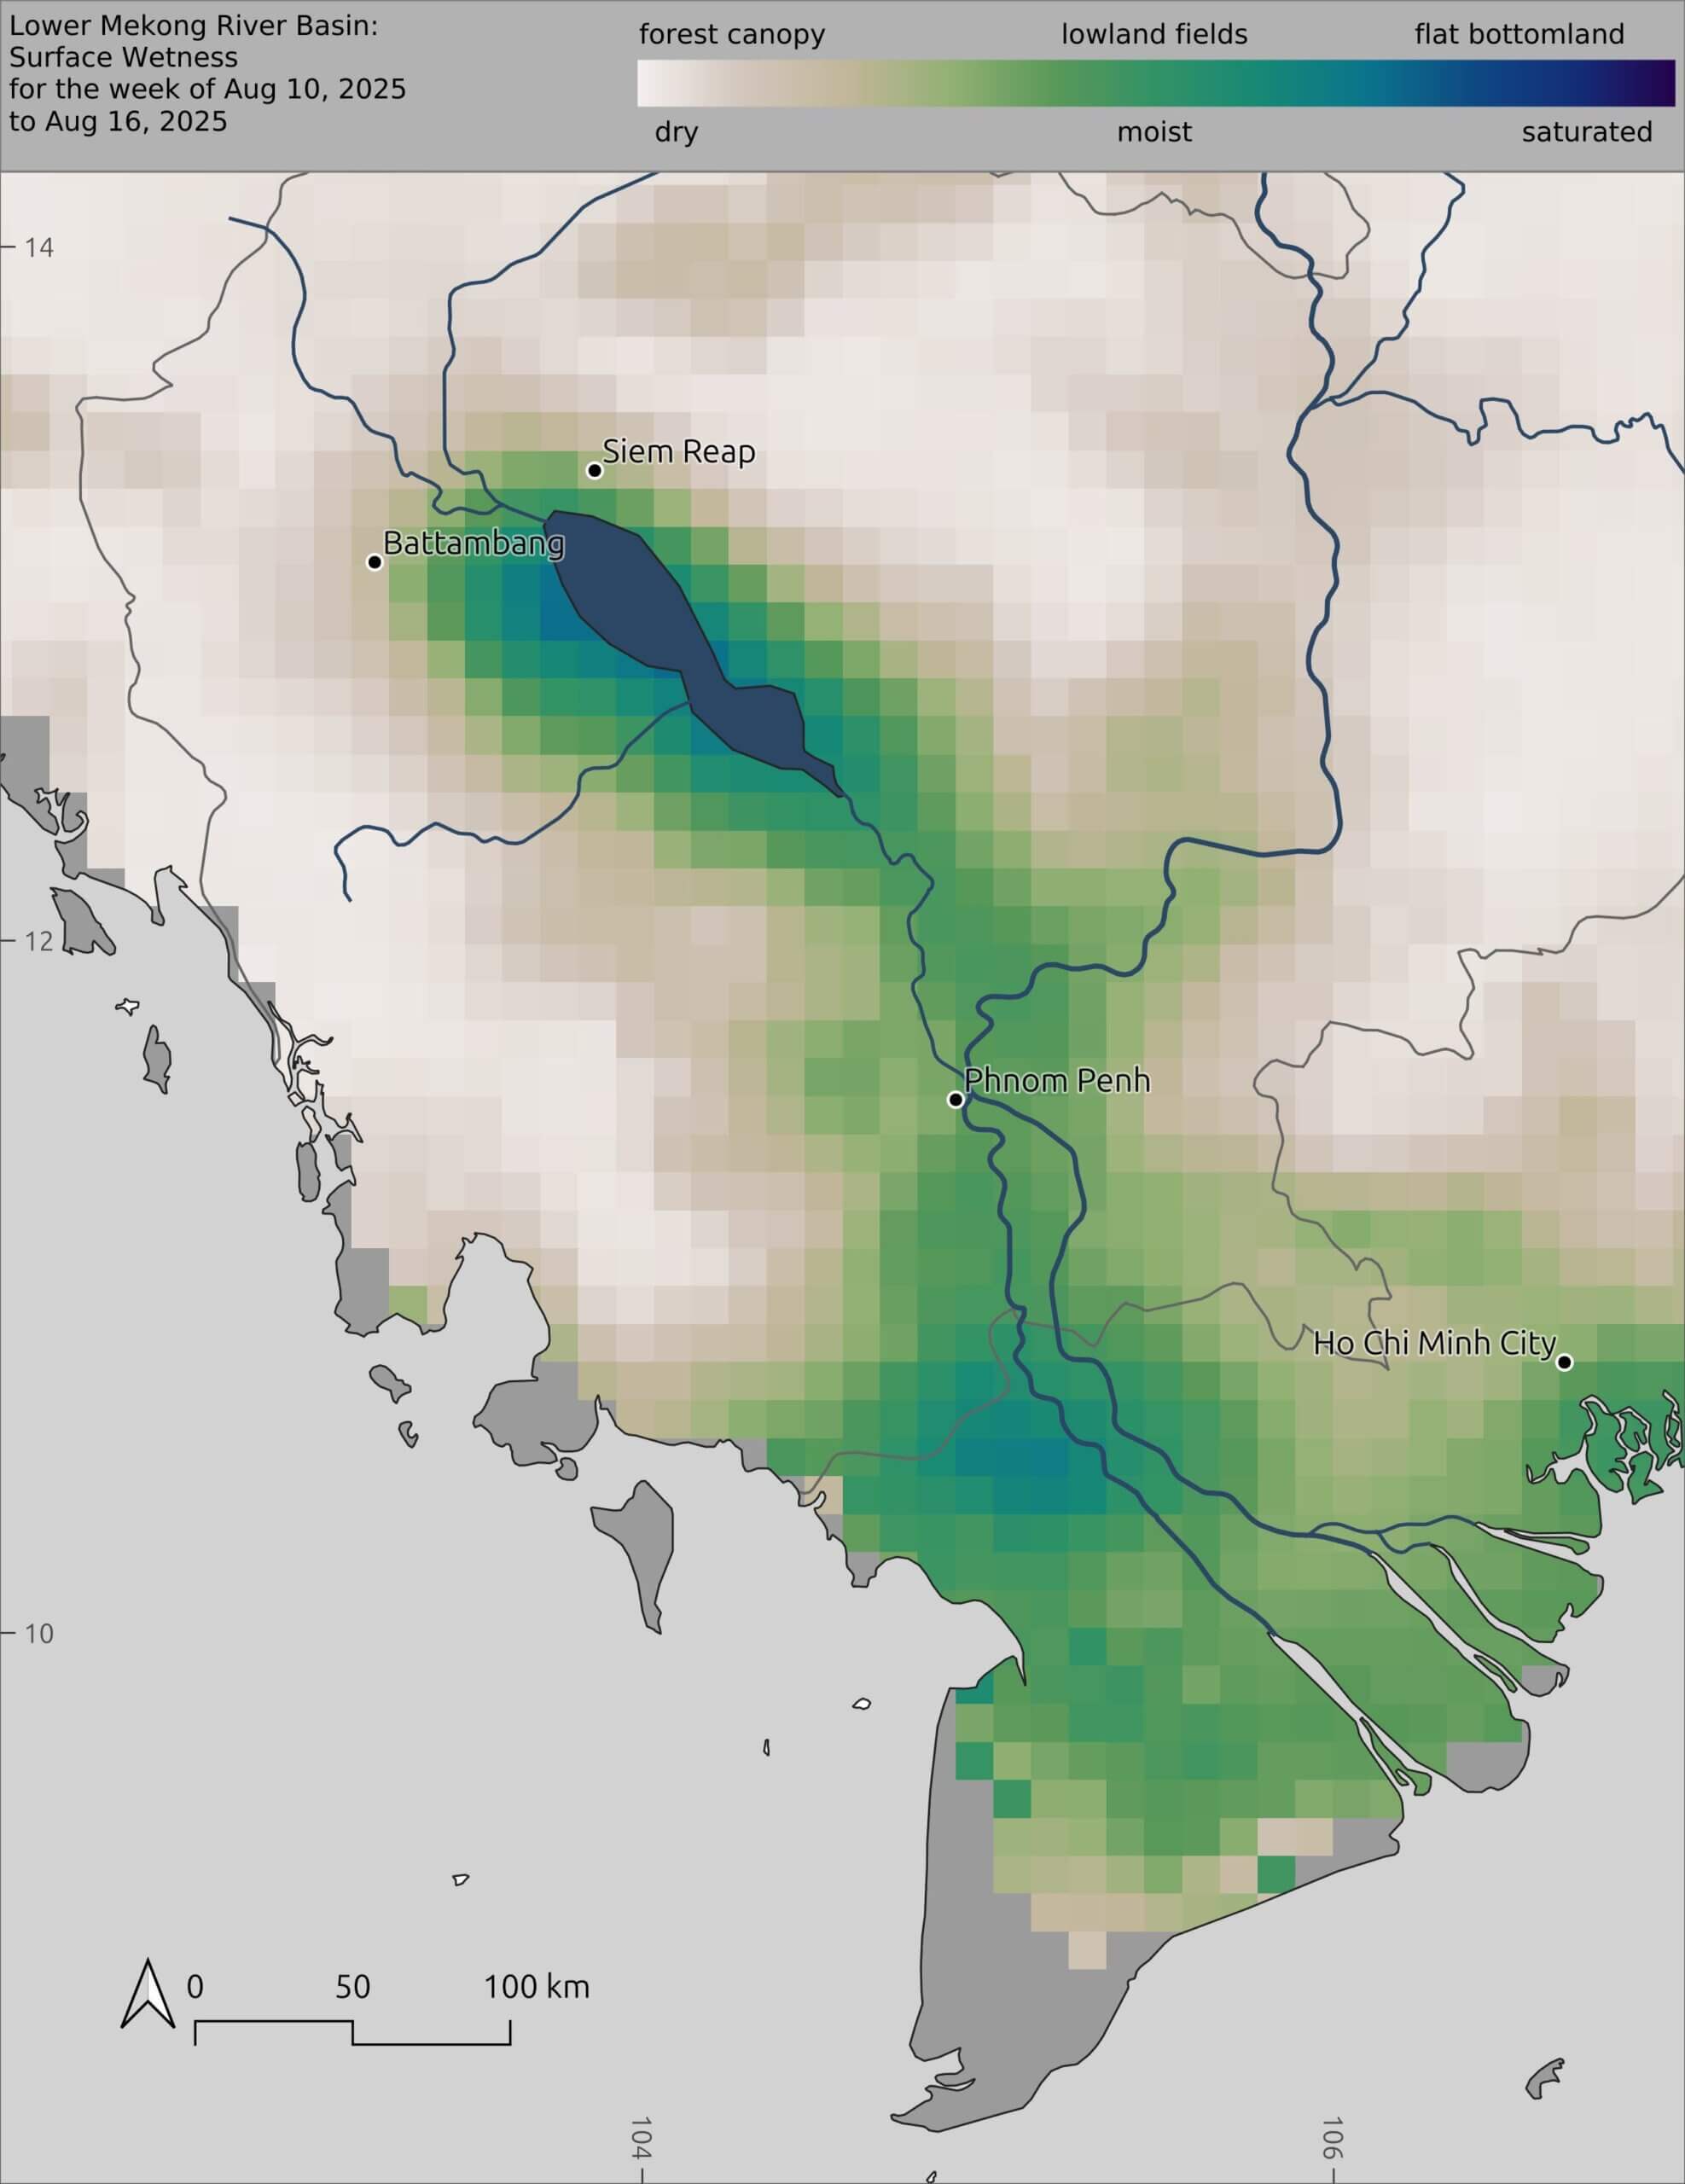
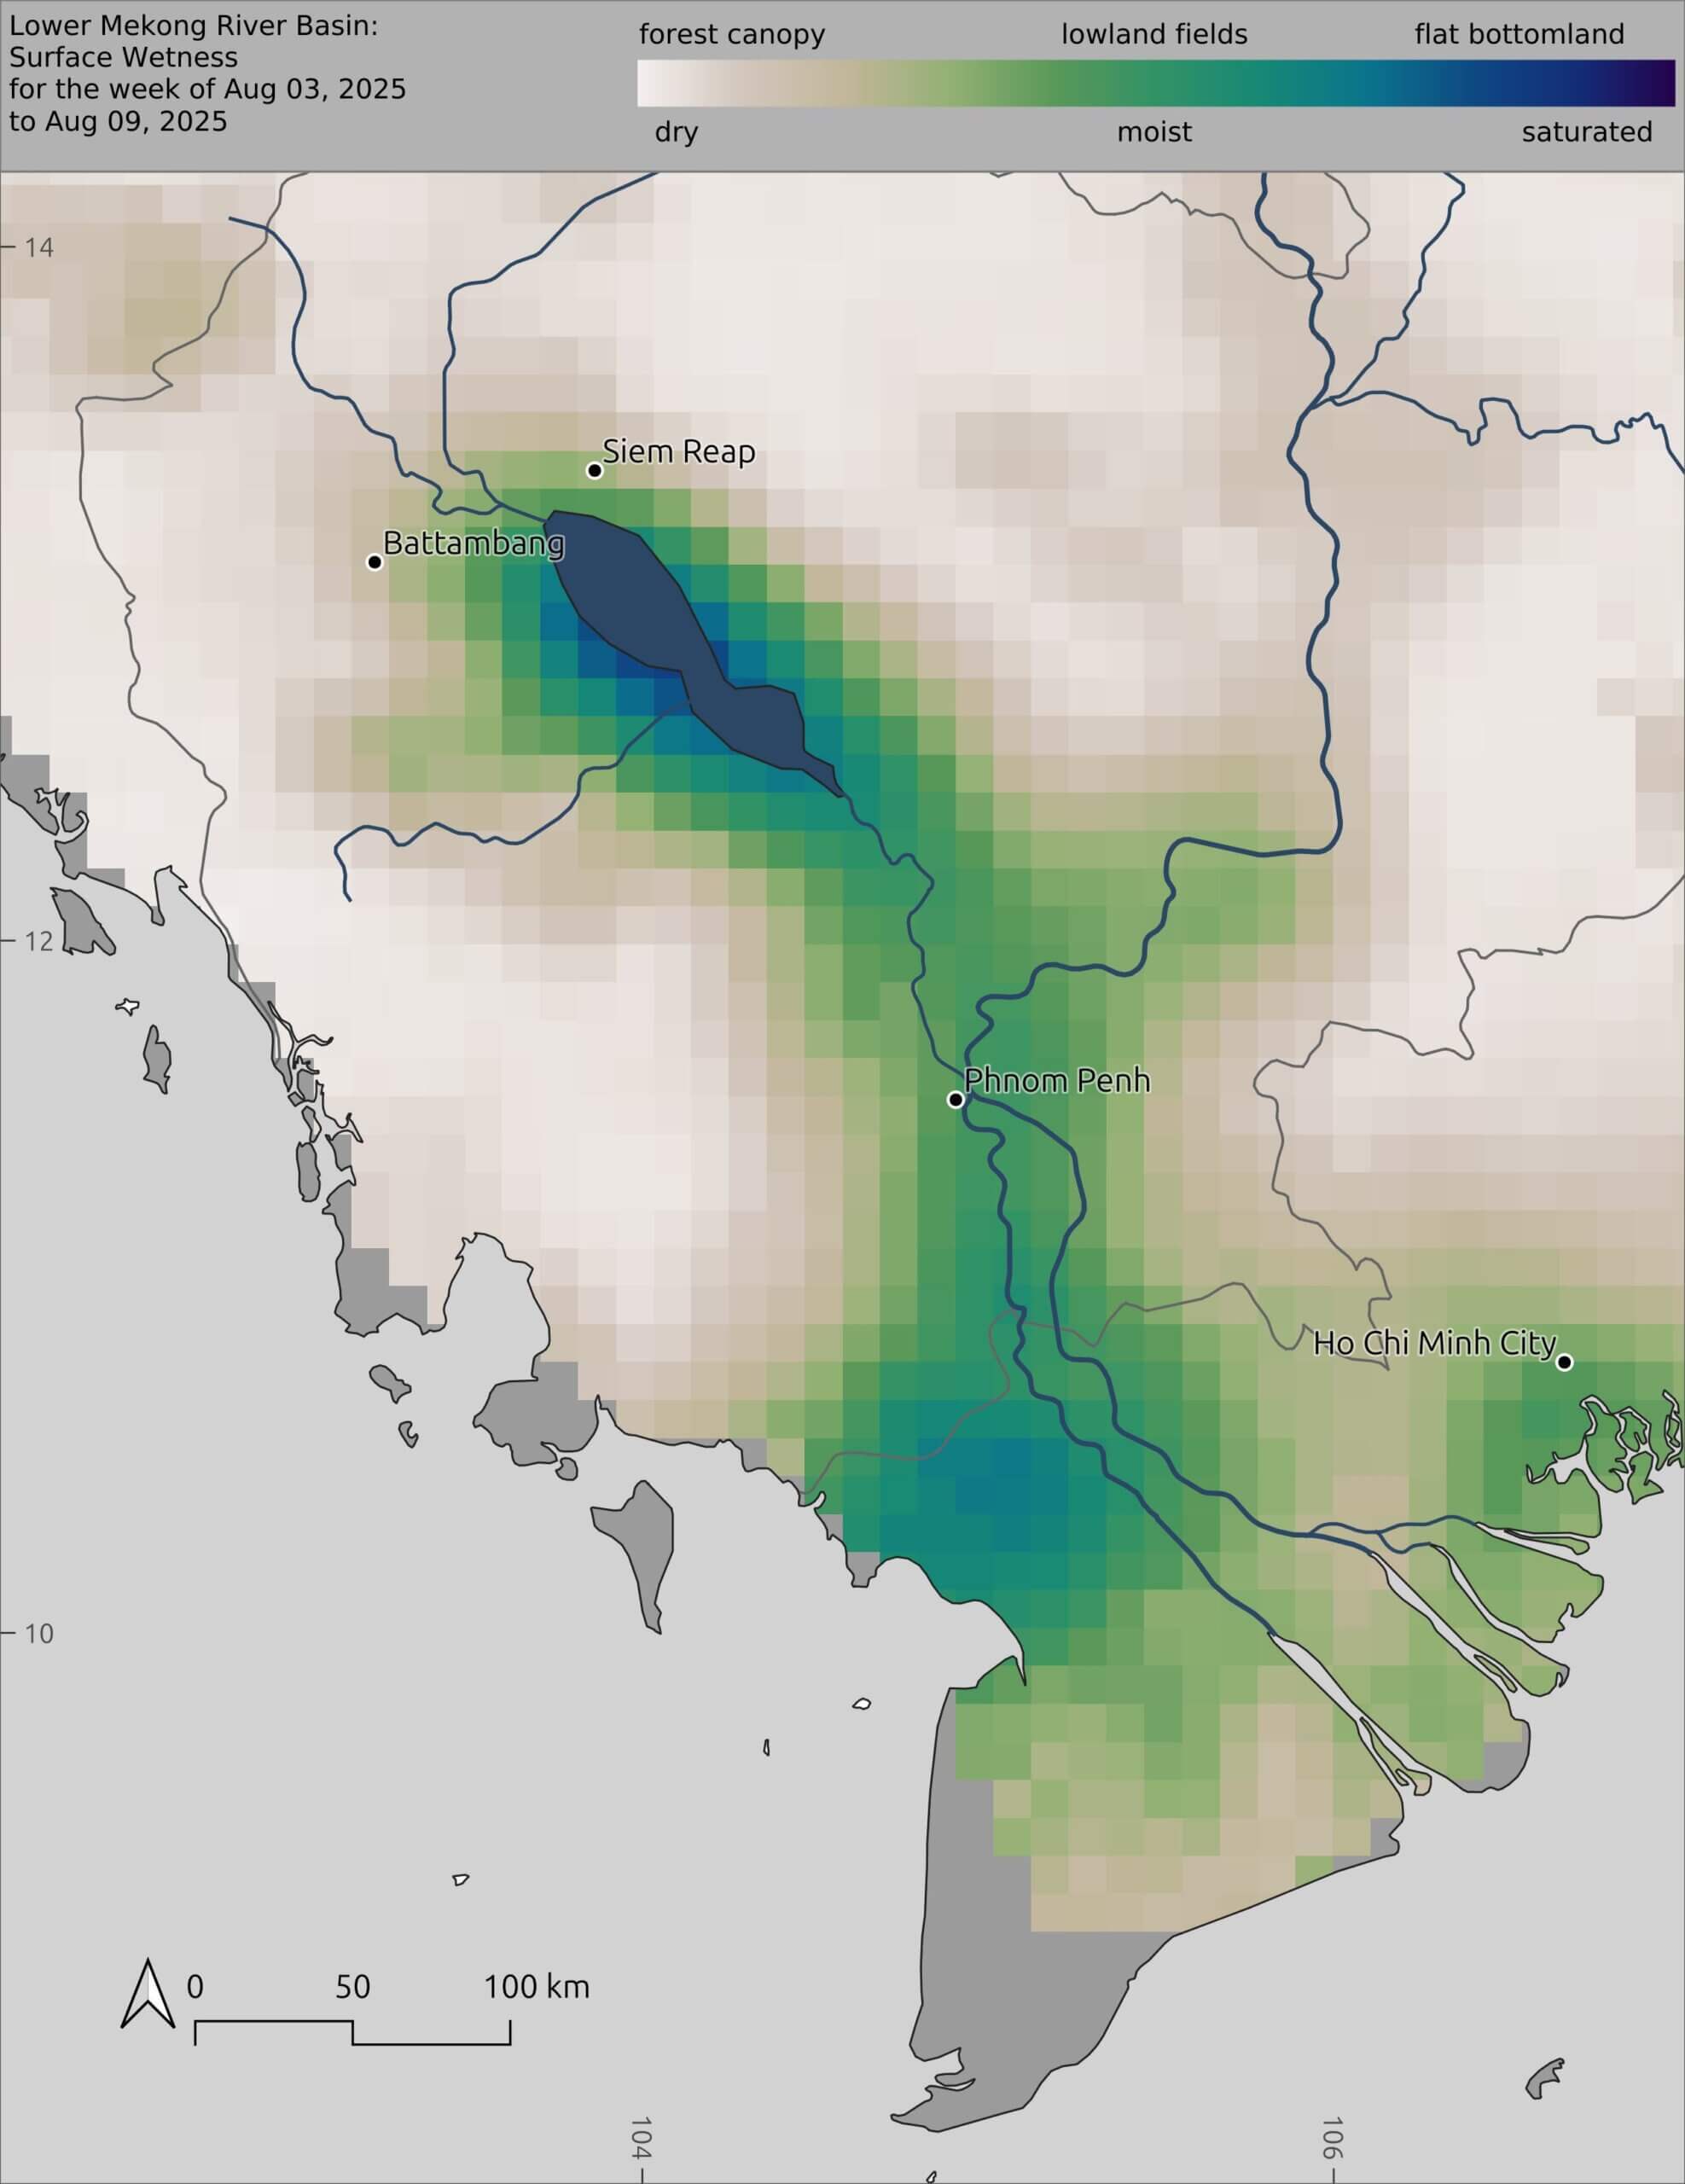
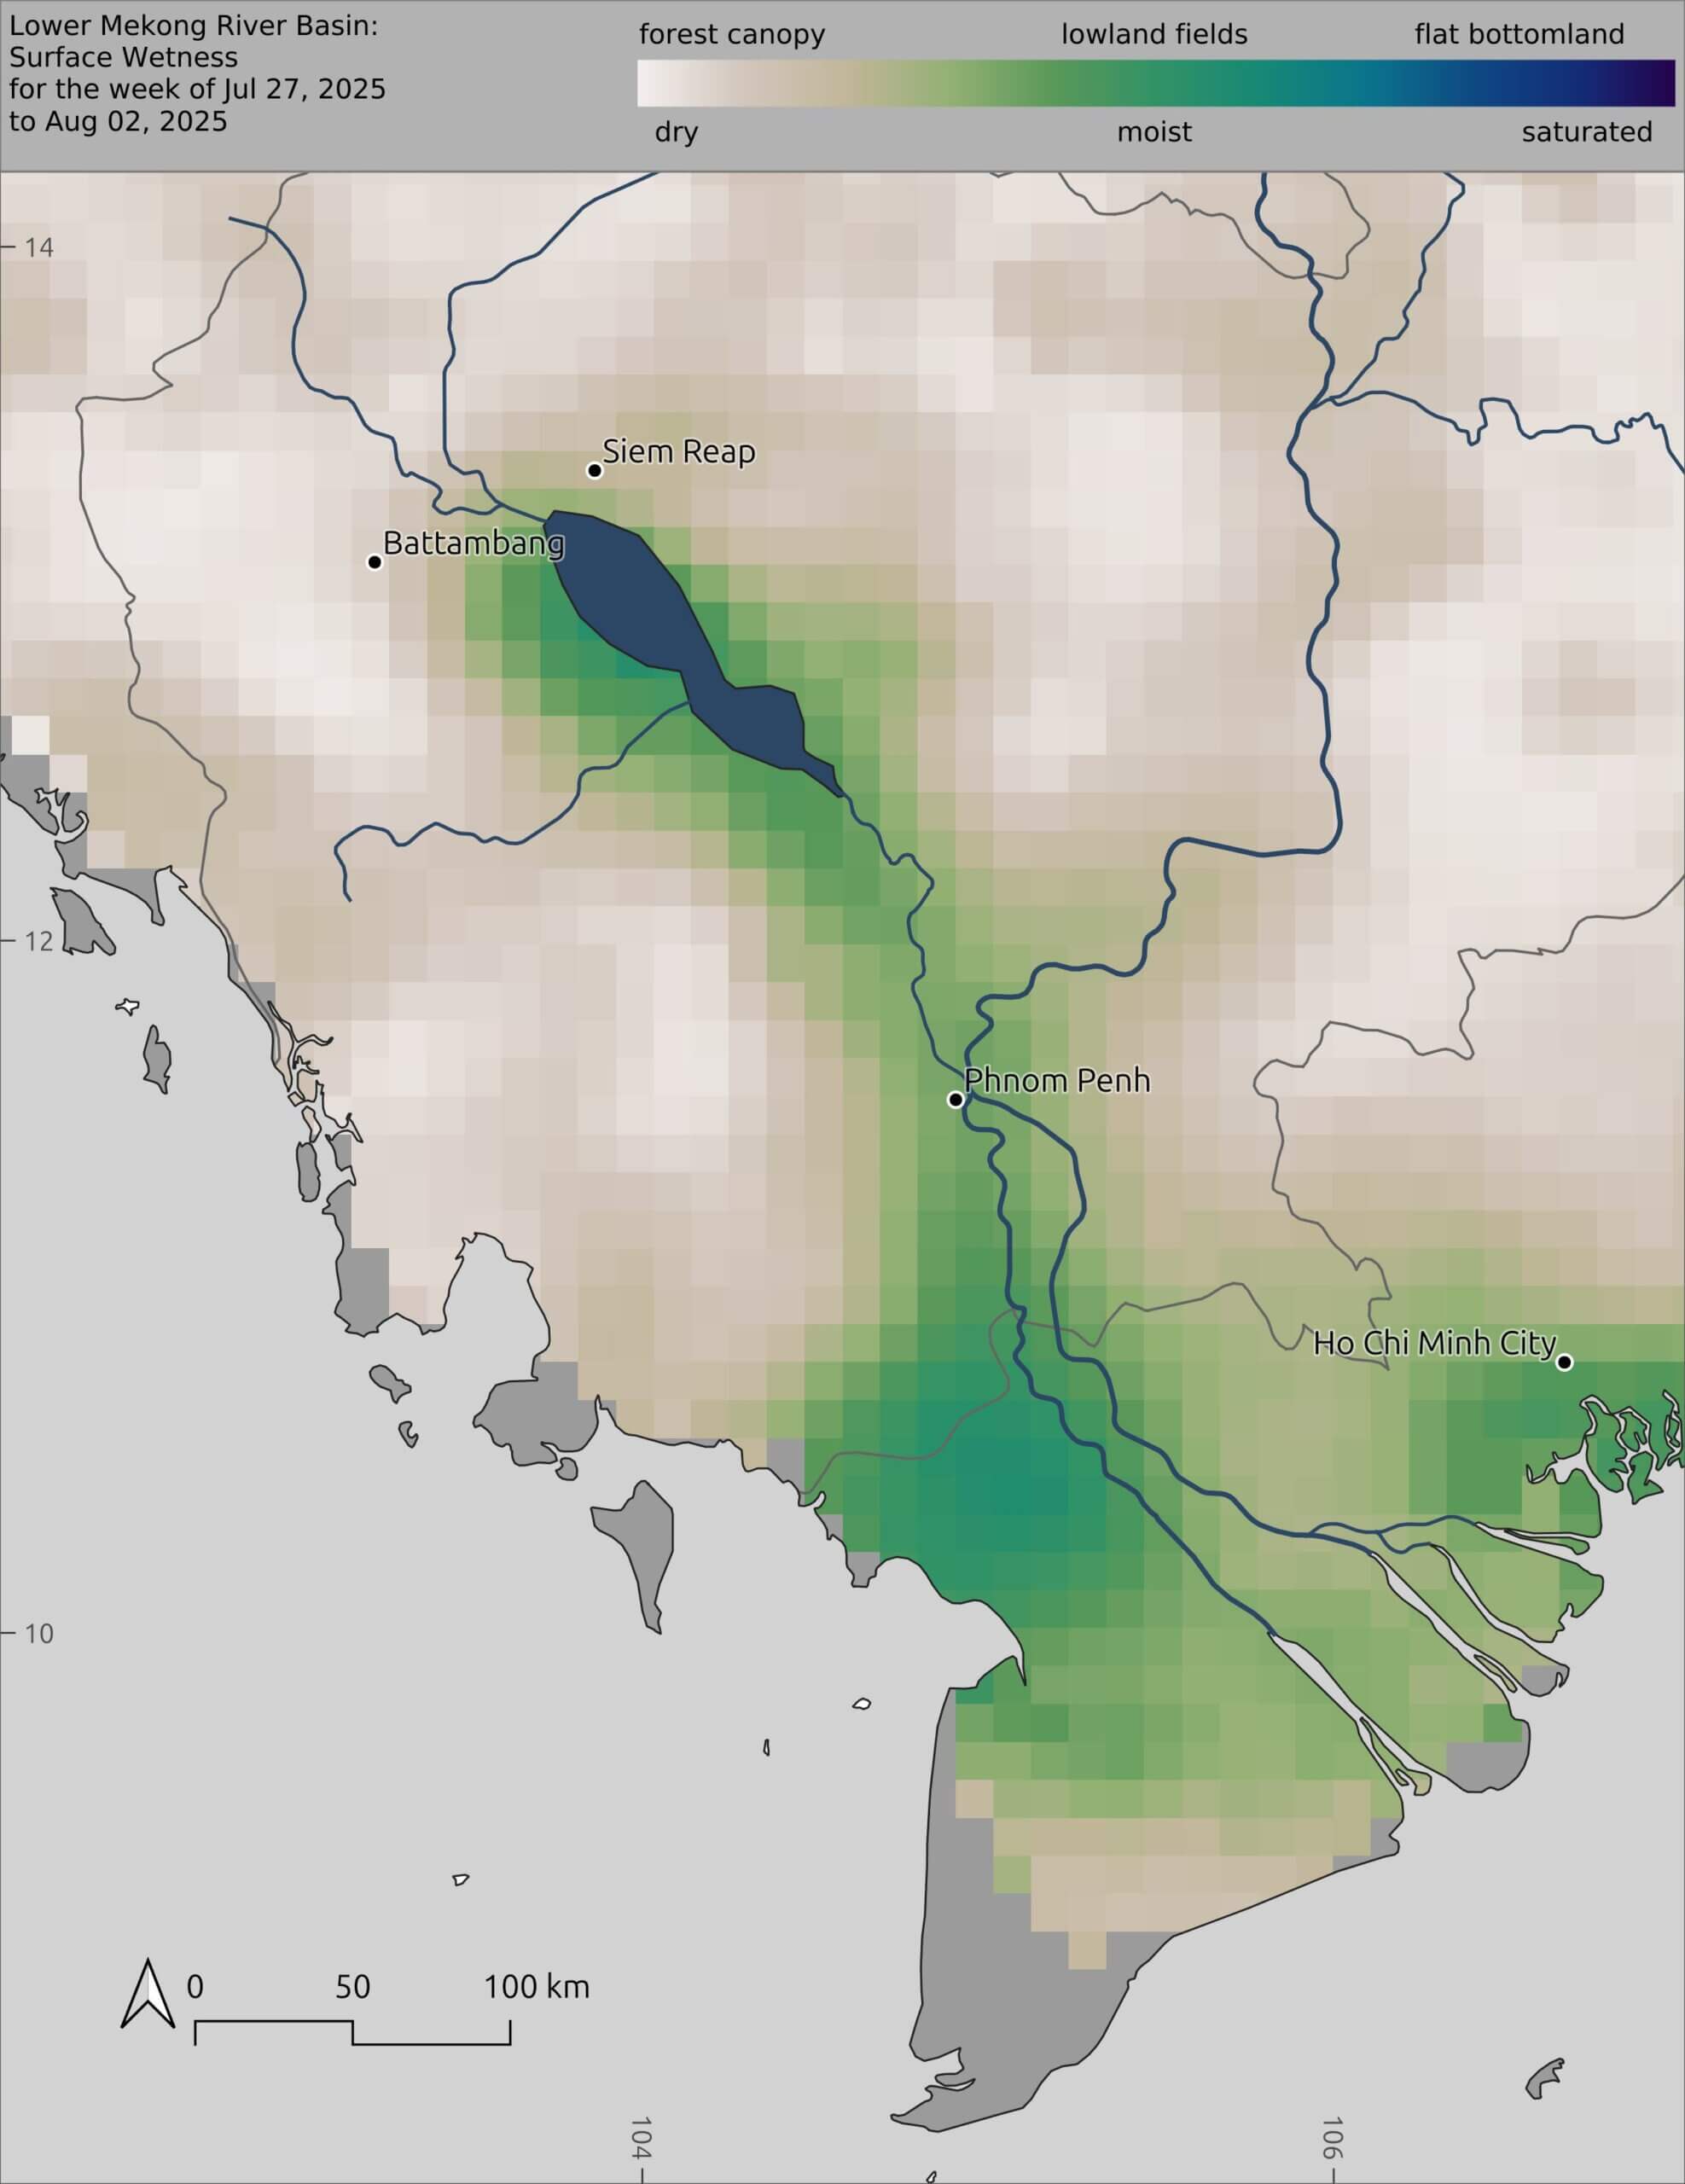
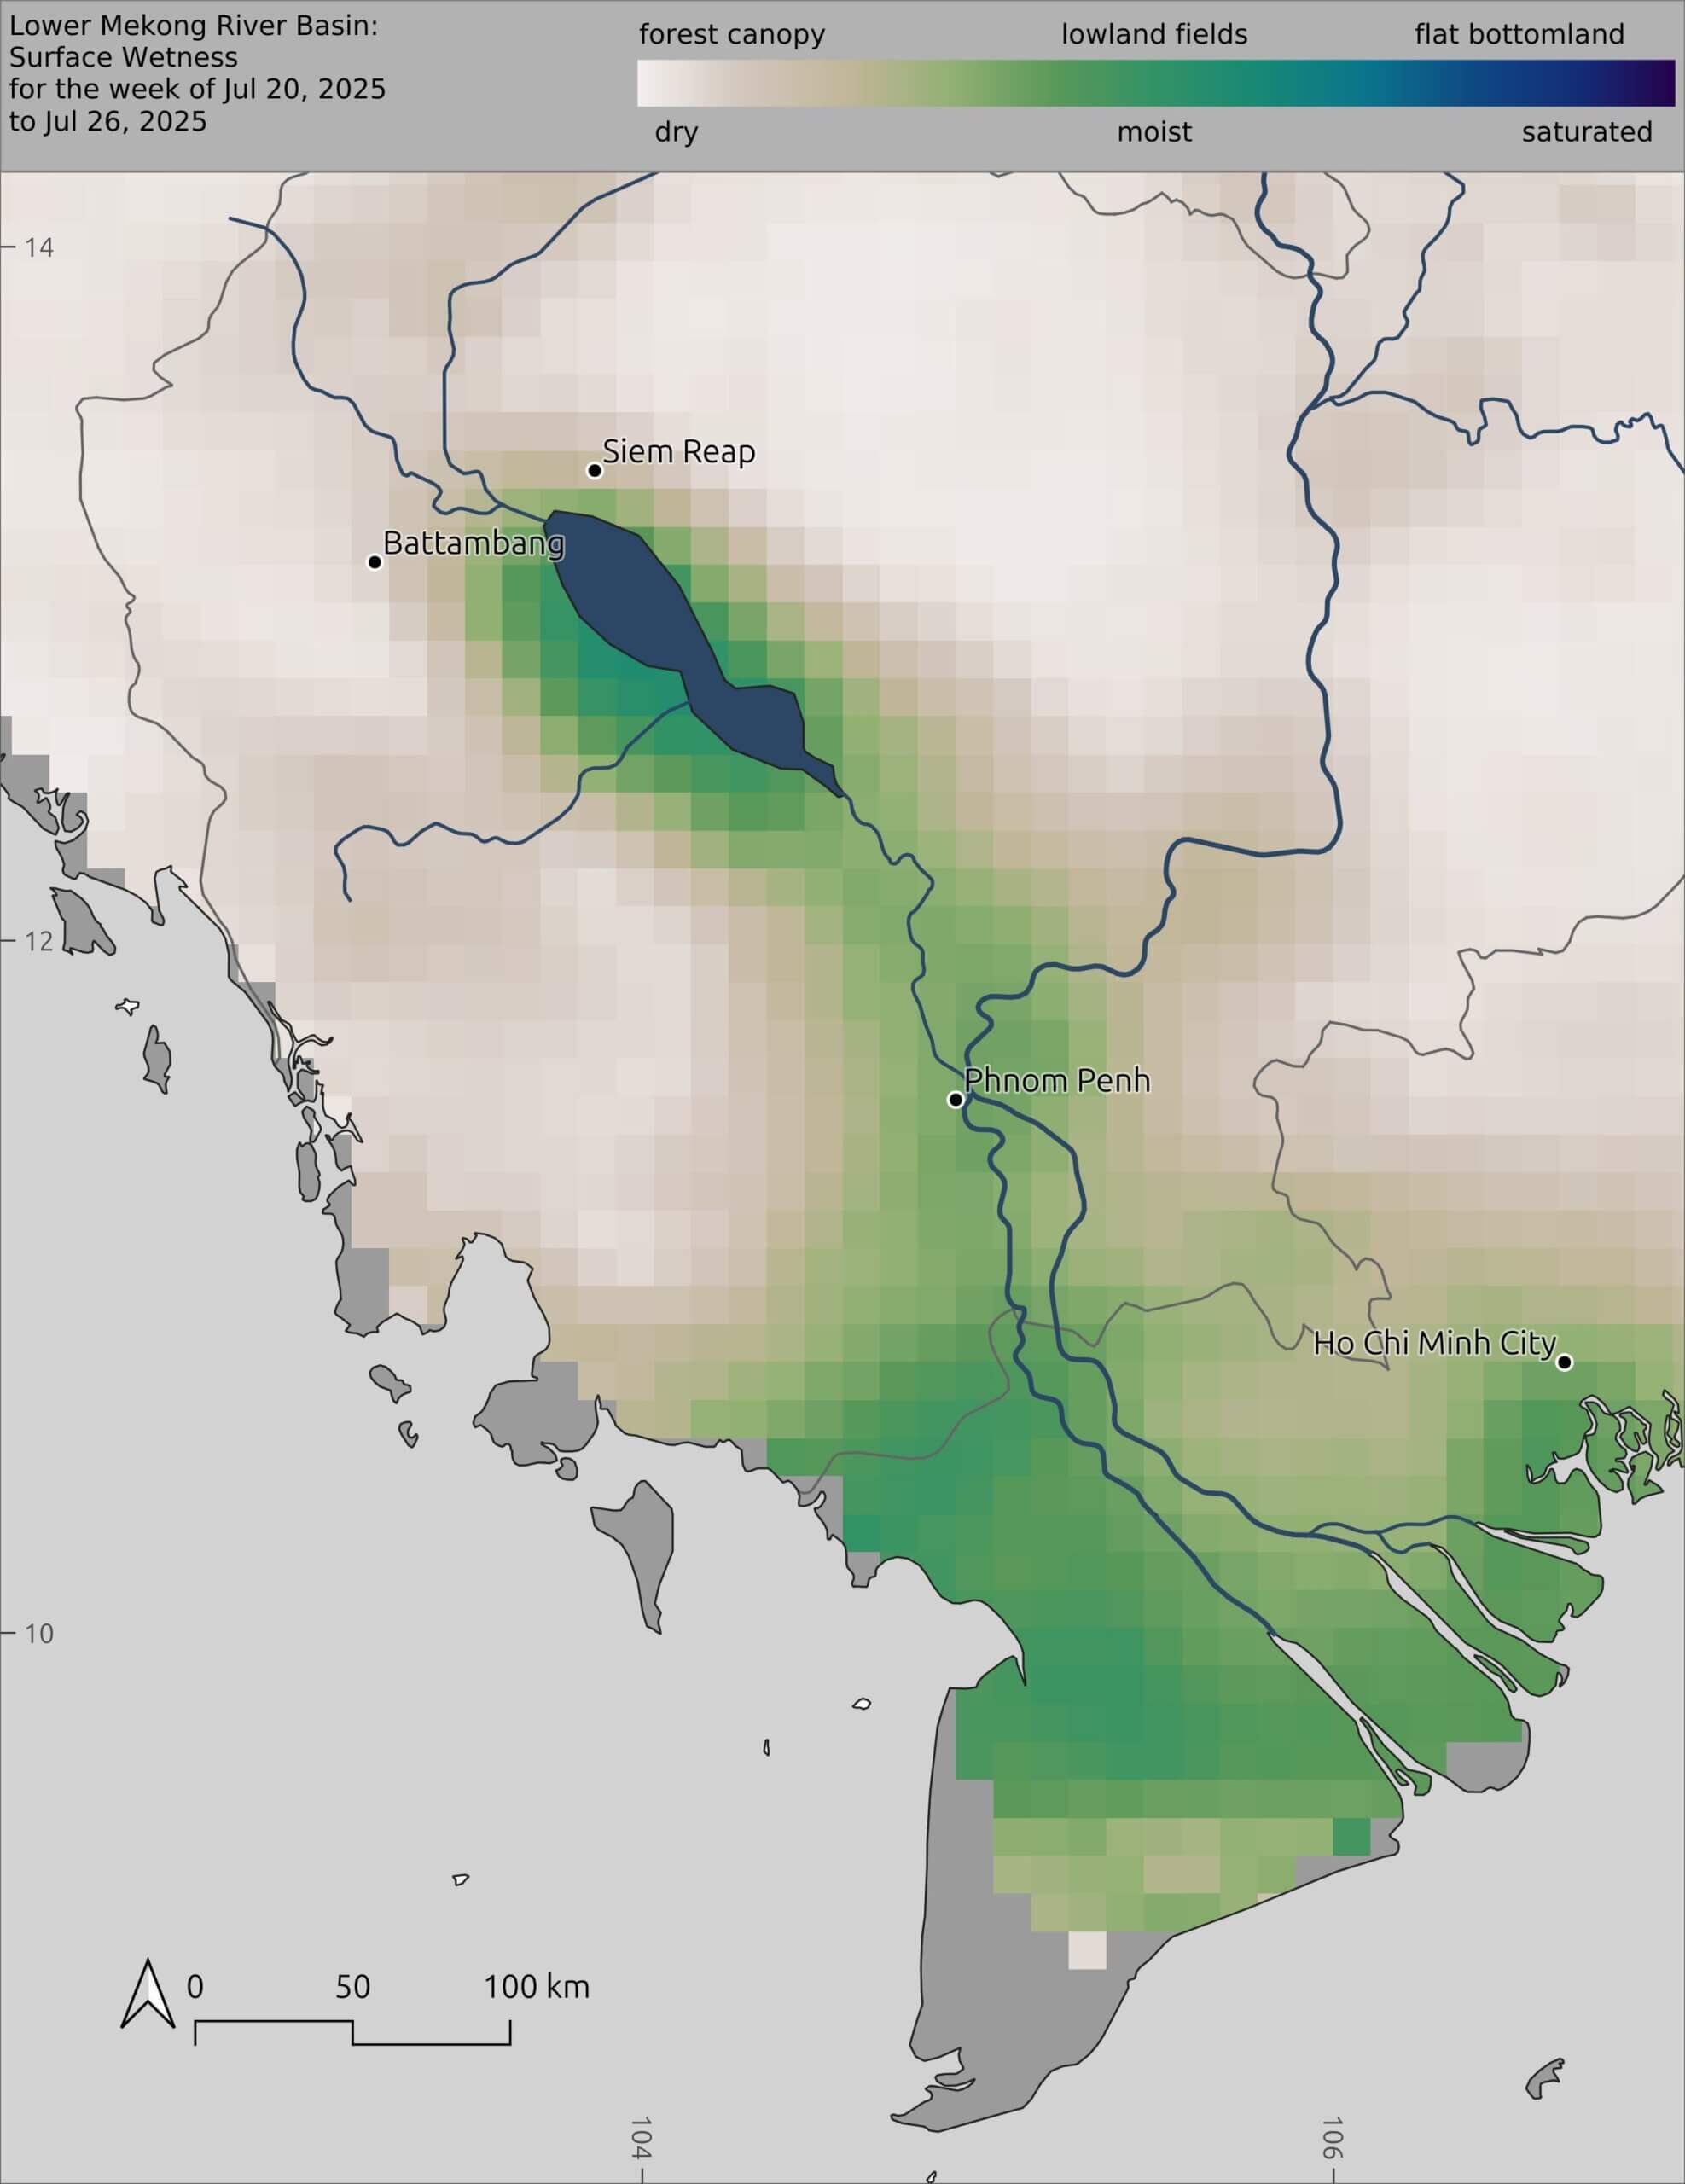
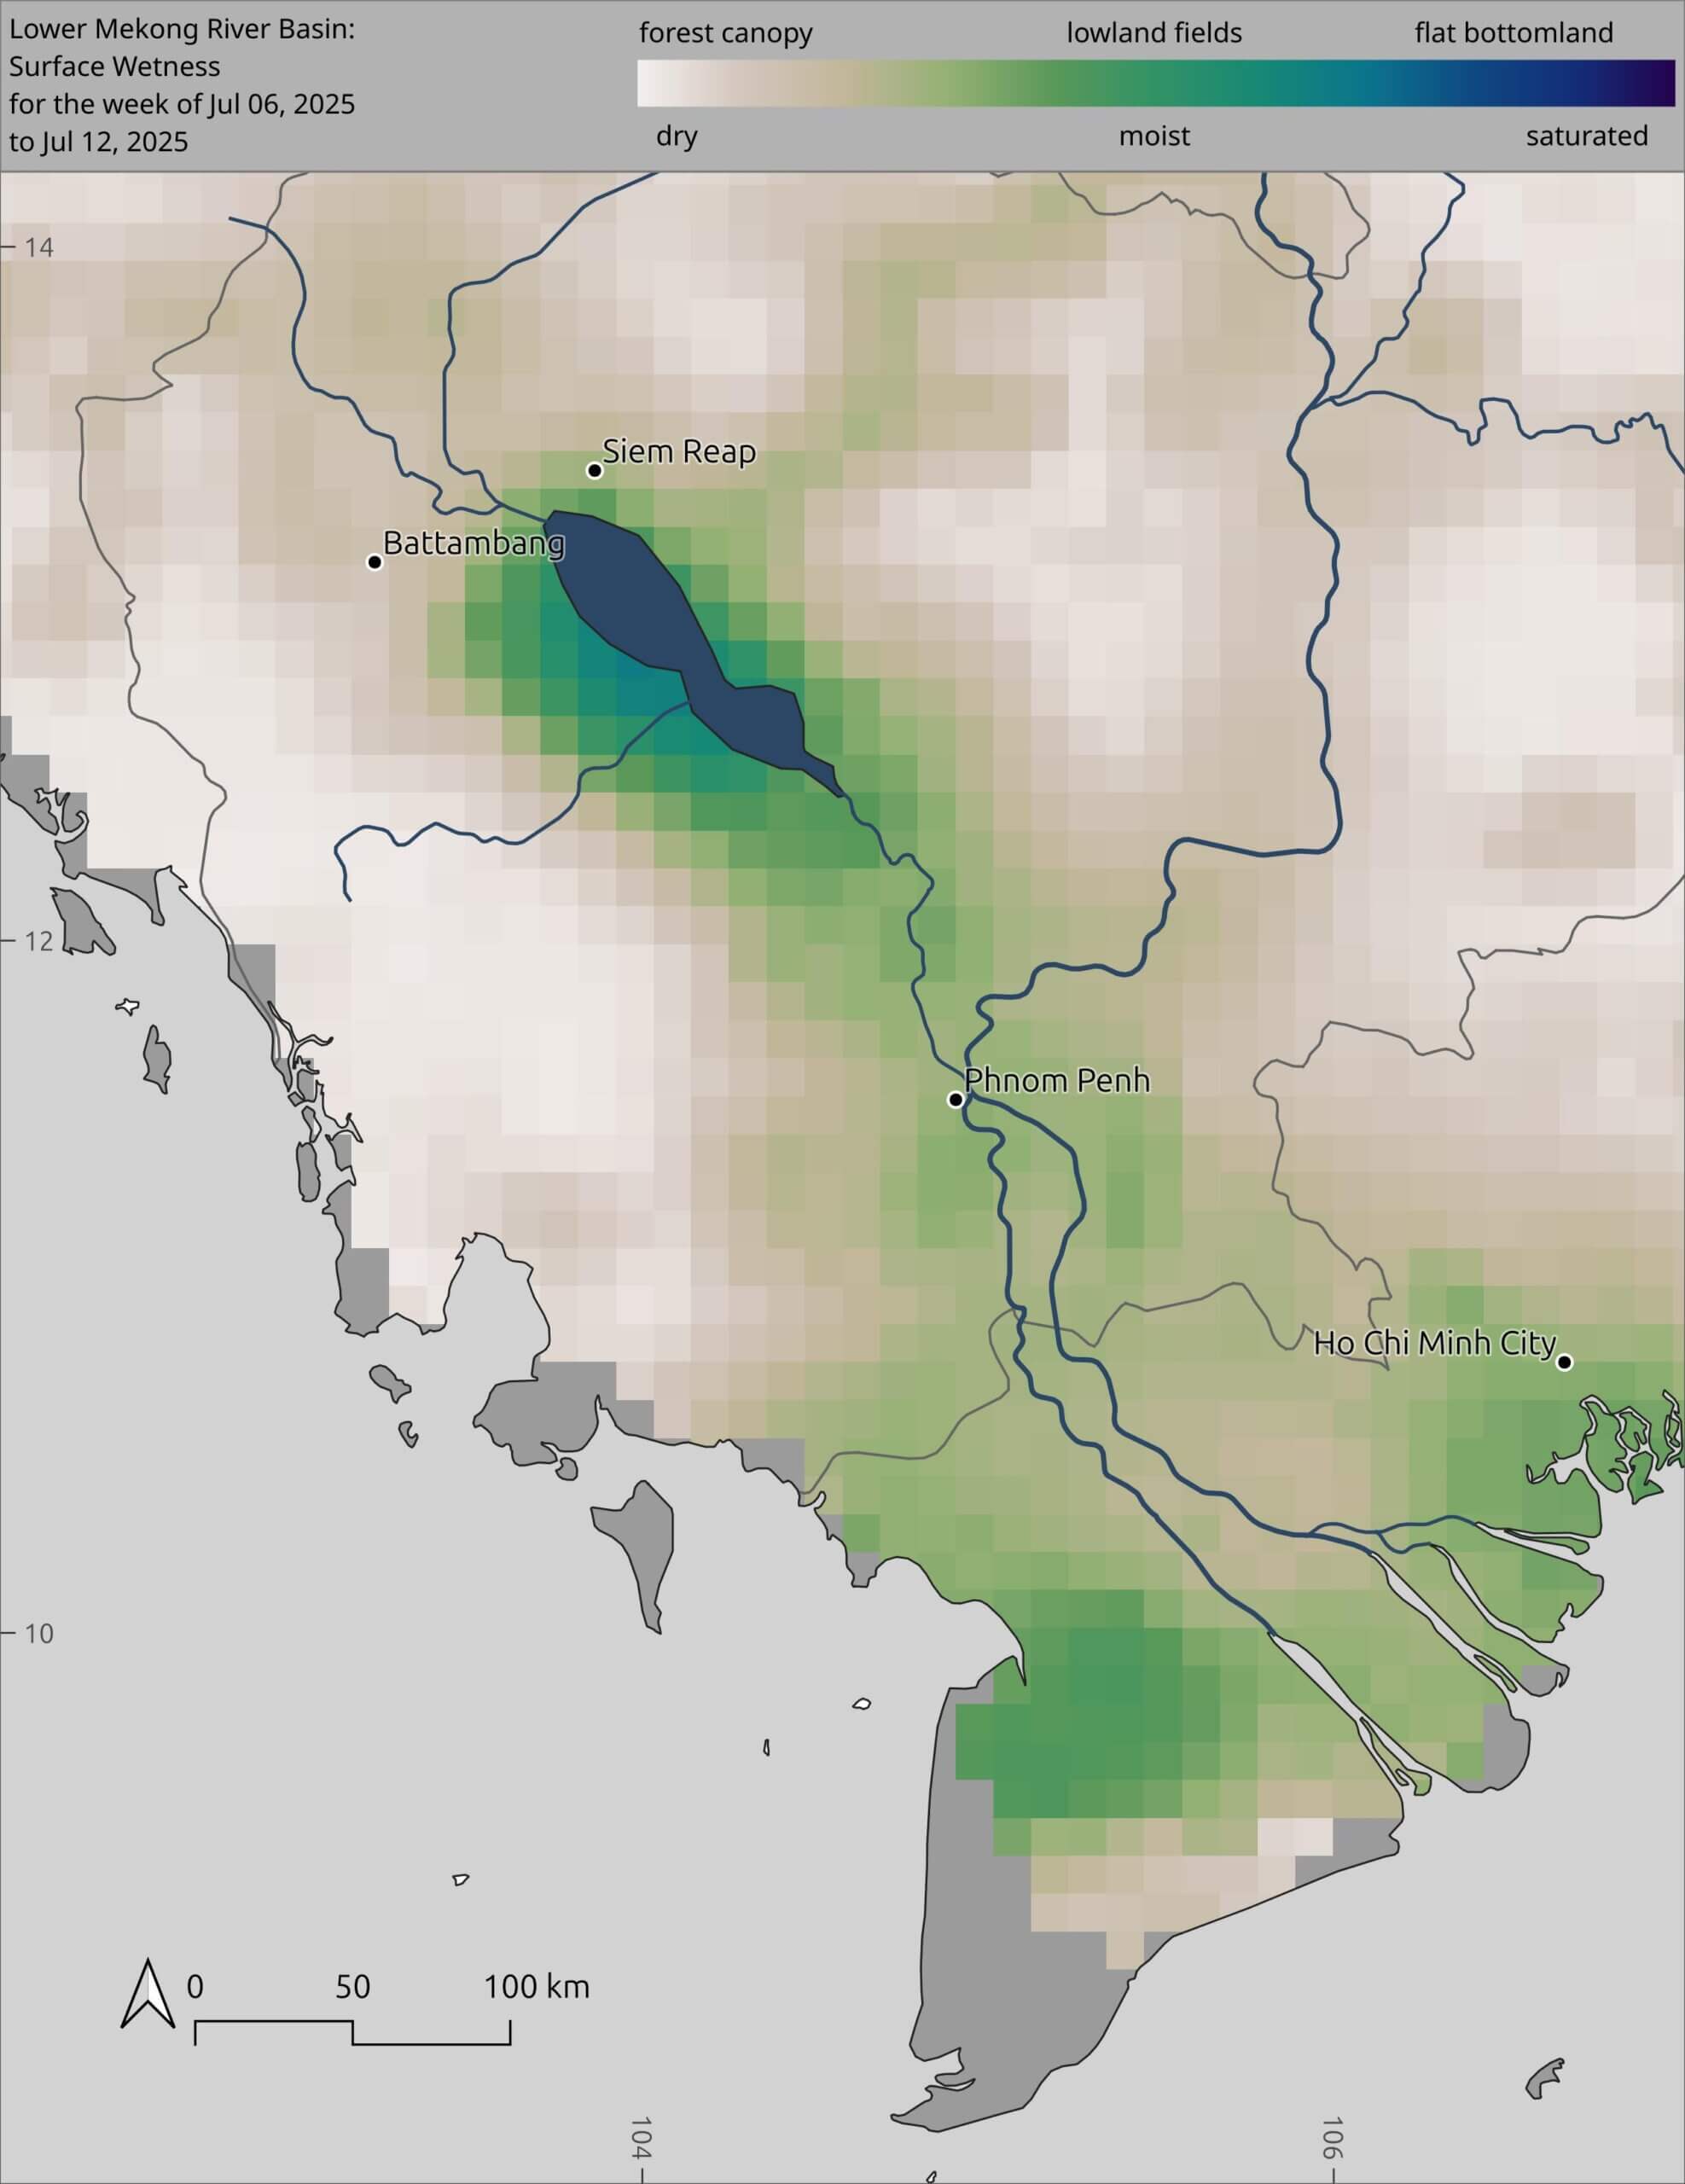
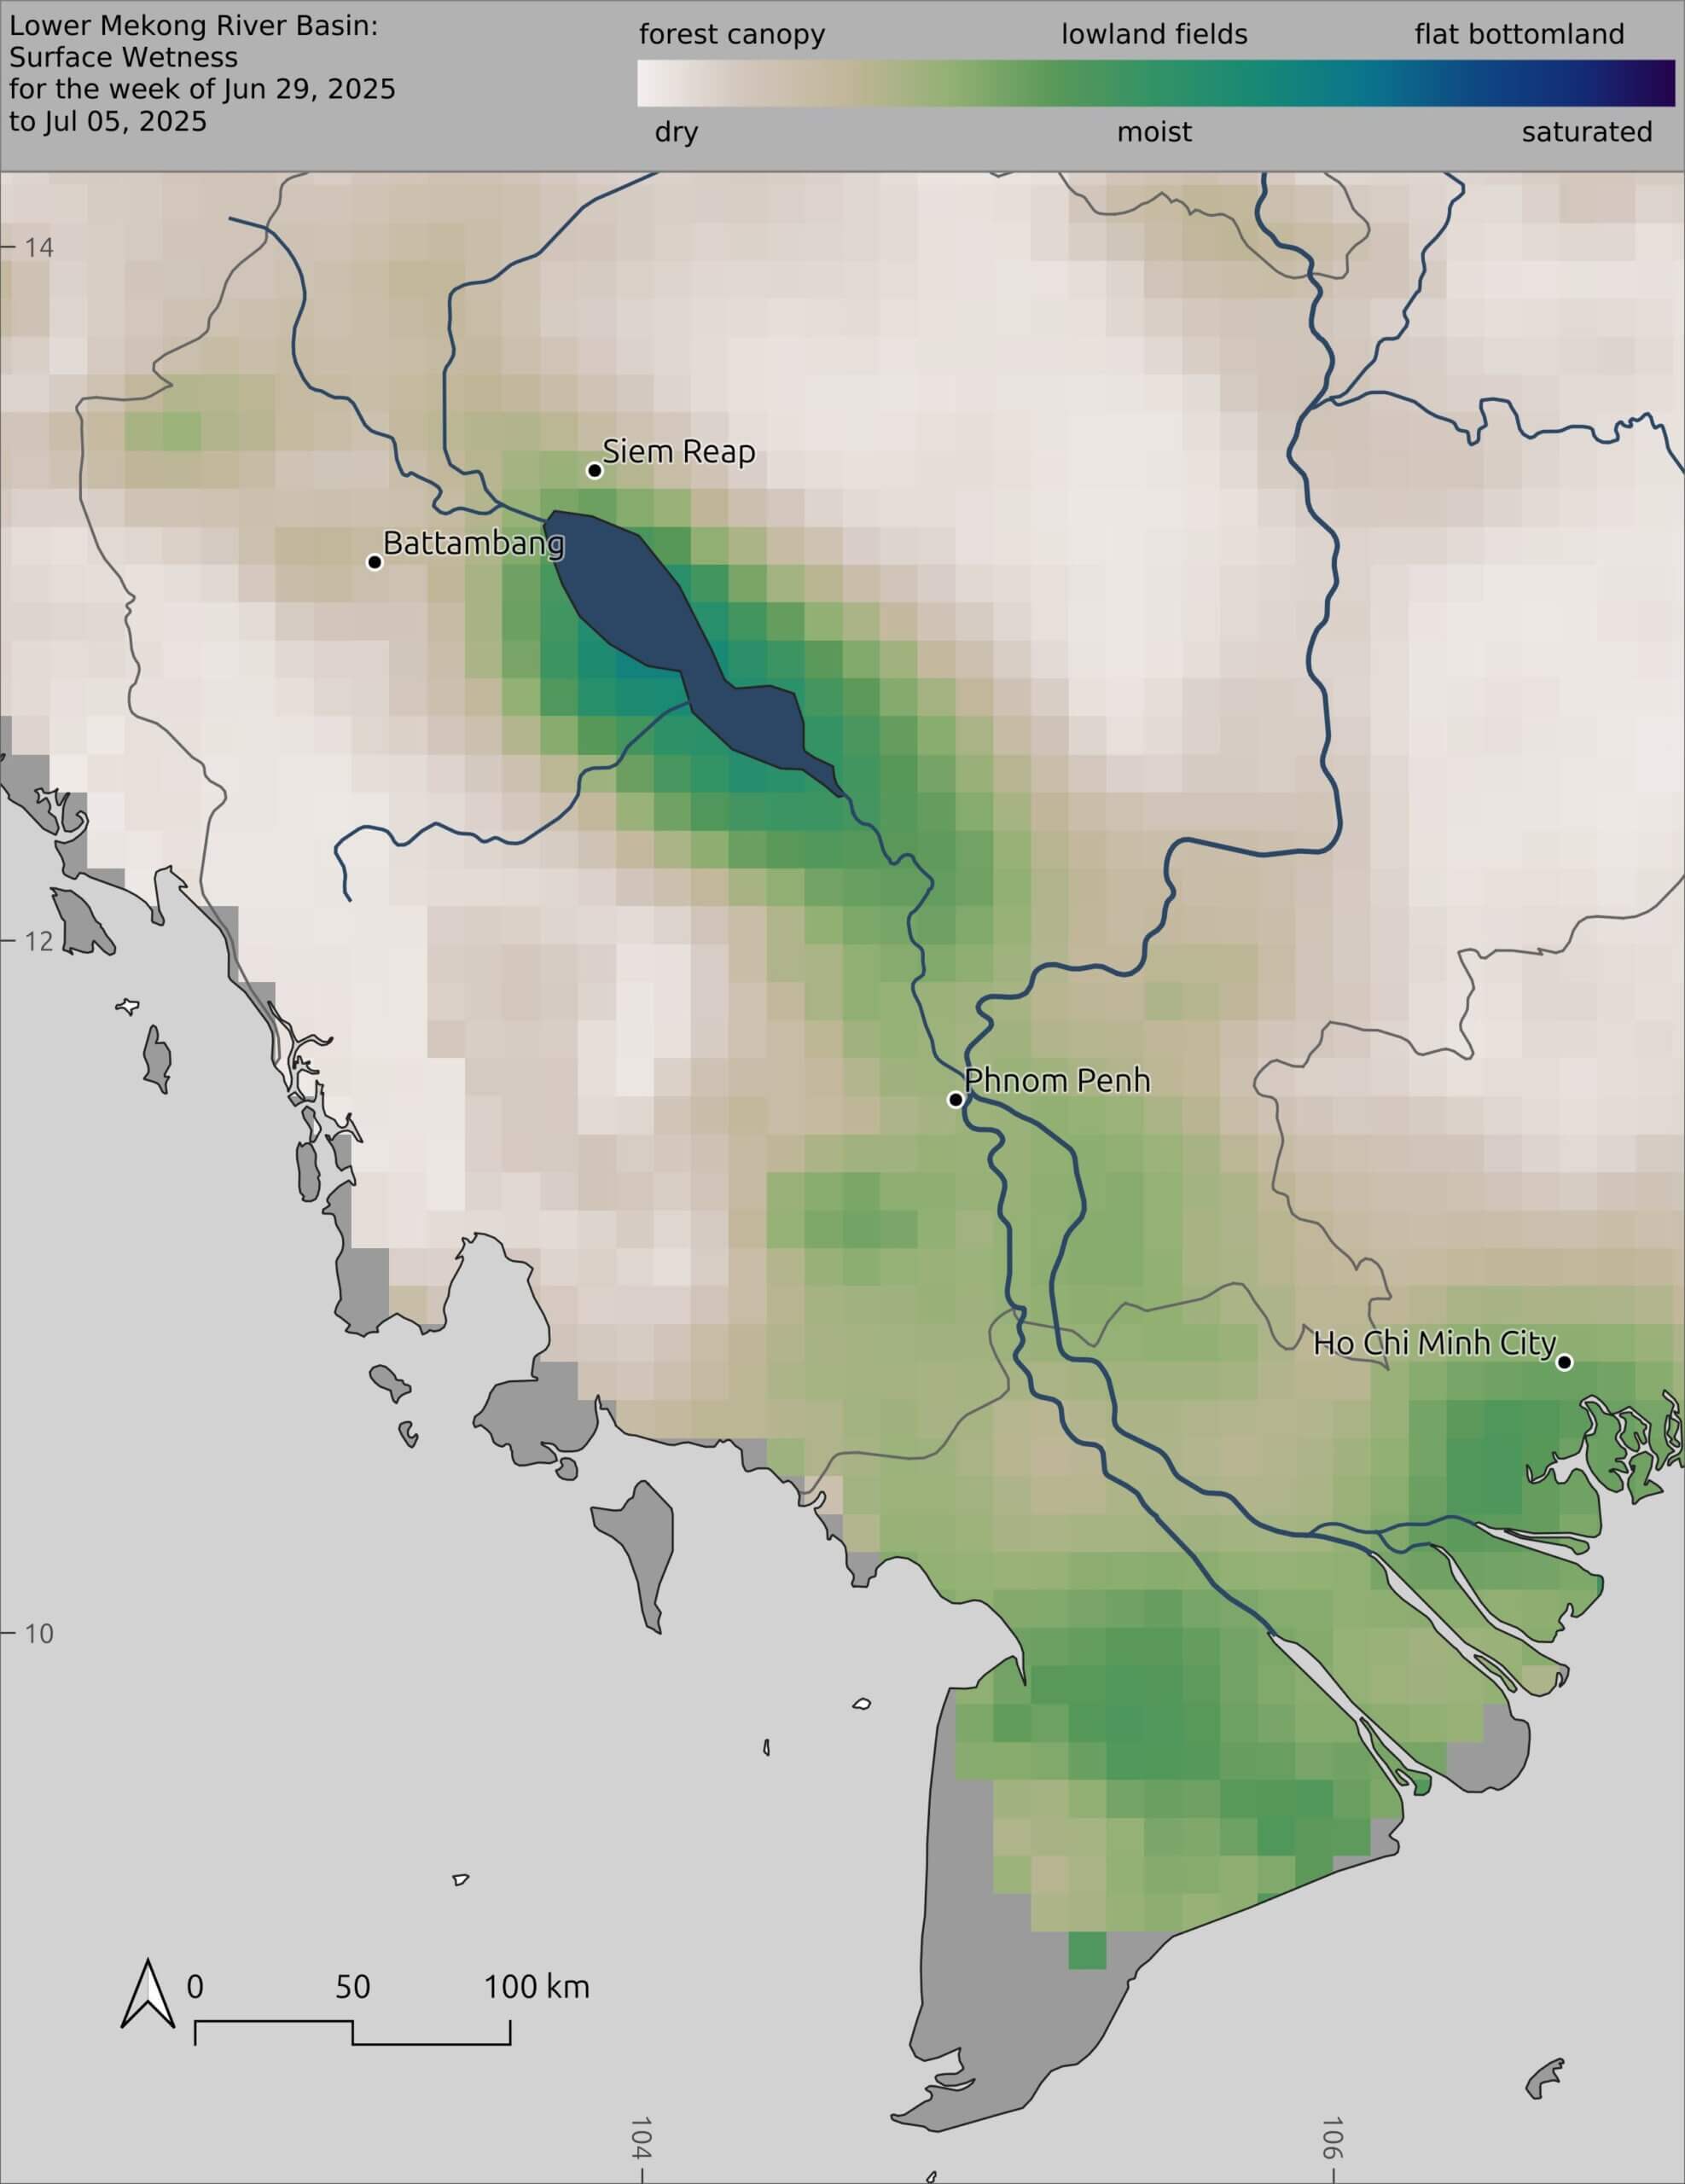
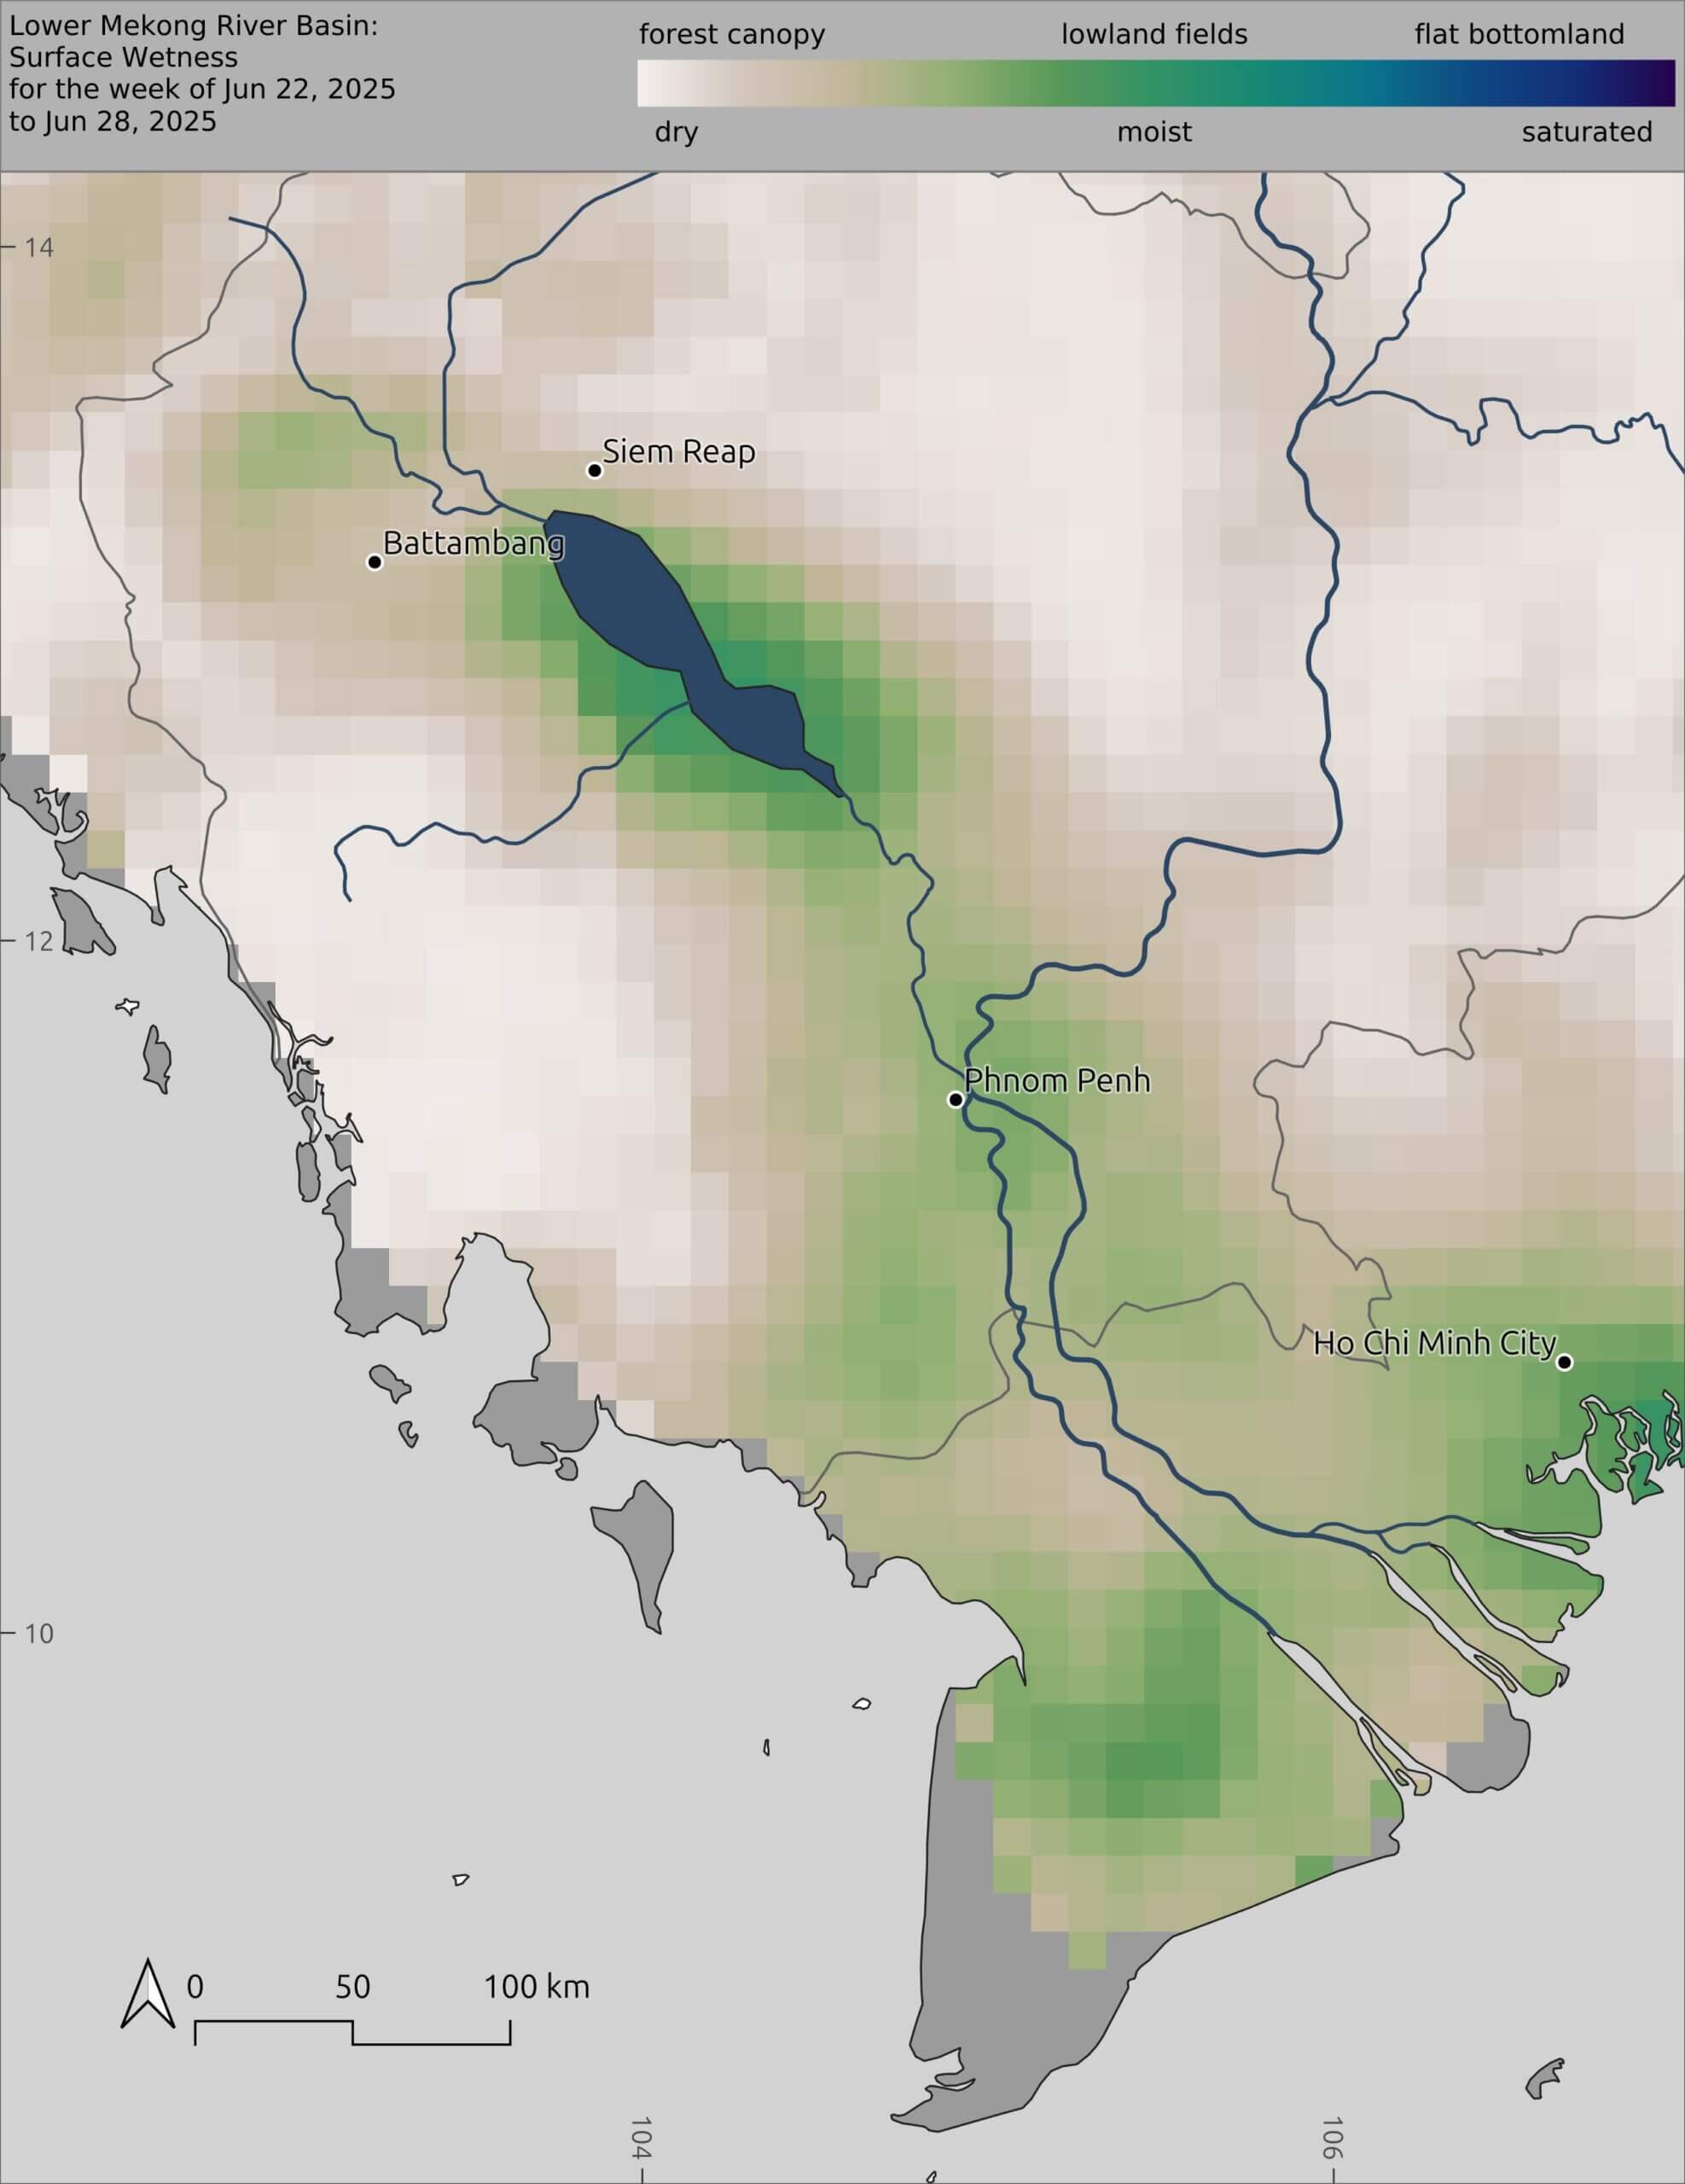
Floodpulse is still normal but likely driven by irrigation
Satellite radar imagery estimates 7,400 square kilometers of inundation throughout the Mekong Basin placing the Mekong Floodpulse well within normal bounds, but much of this inundation is likely from pumped irrigation in Vietnam’s Mekong Delta. River levels throughout the Mekong are extremely low, and currently the Tonle Sap Lake is near historical low levels for this time of the year. Currently, there is no sign of the Tonle Sap Reversal. The Tonle Sap Reversal, which typically happens in late June or early July, occurs when the water flowing out of the Tonle Sap Lake reverses direction and flows back into the Tonle Sap Lake. This amazing reverse flow process is the key driver of the Mekong Floodpulse and the productive Mekong fishery. So far, conditions do not look good for a normal Mekong wet season in the lower floodplain. Dam operators should exercise restraint when restricting flow and filling their reservoirs over the next month until more favorable conditions appear.
Current volume (billion cubic meters) of usable water across the 45 largest reservoirs in the Mekong Basin.
For more info, click Natural River Flow Models in the top menu.
For more information, click Compare Maps and Data in the top menu.
Reservoirs with an estimated change of more than 50 million cubic meters (m³) of water over last 7 days.
For more info, click Virtual Gauges in the top menu.
For more info, click Virtual Gauges in the top menu.