Introduction
The Mekong Infrastructure Tracker dashboard is a regional collection of infrastructure datasets aimed at providing its user community a comprehensive database of infrastructure development projects, descriptive information on project finances and state or private involvement, and geographical coordinates. Through the dashboard, users can locate and access data on approximately 1,750 power generating projects and more than 178,000 kilometers of linear infrastructure across the Greater Mekong Subregion (Cambodia, Laos, Myanmar, Thailand, Vietnam, and southwest provinces of China). By publicly providing this information, the Stimson Center hopes to cultivate a need for data transparency, regional cooperation, and an active user community that will contribute to the database’s growth.
This document will provide a detailed walkthrough on how to use the Mekong Infrastructure Tracker including the use of dashboard widgets, the creation and use of graphics, and exporting outputs derived from the Tracker’s database. For additional information or questions, users may visit the FAQ page or contact the Mekong Infrastructure Tracker’s support team at [email protected].
Video Tutorial
Walkthrough
Front page functionalities
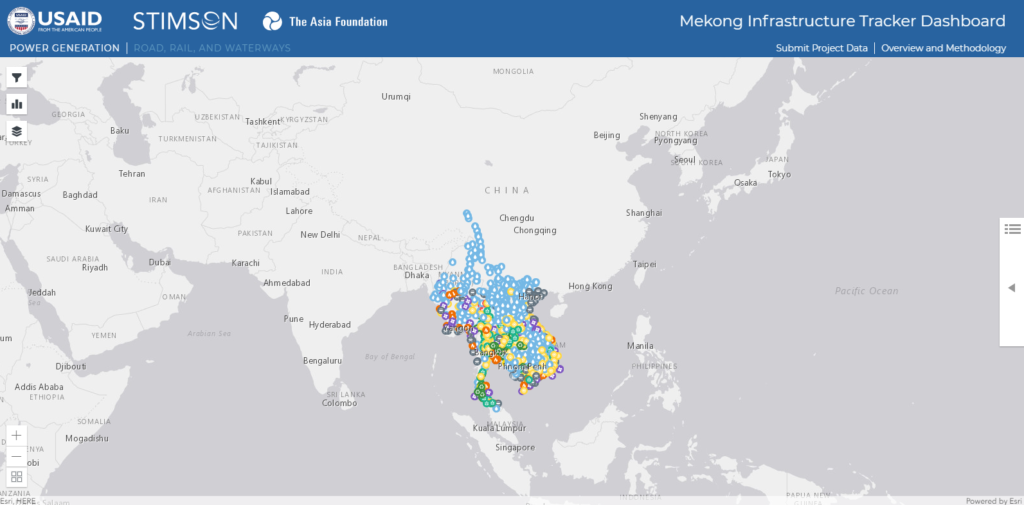
Users access the dashboard and other interactive tools from the Mekong Infrastructure Tracker Project page. Clicking on the tool will launch the Mekong Infrastructure Tracker dashboard as shown above. The default view opens with a zoomed out display of energy infrastructure projects in the region and their respective type of energy as represented by the map icons. Users may begin interacting with the tool from this point by clicking on points of interest which will propagate project information on the right side of the tool, and move around by left-clicking and dragging across the map. Users may also zoom in and out of the map using the mouse wheel, or zoom in by double clicking the area of interest on the map.
List of functions
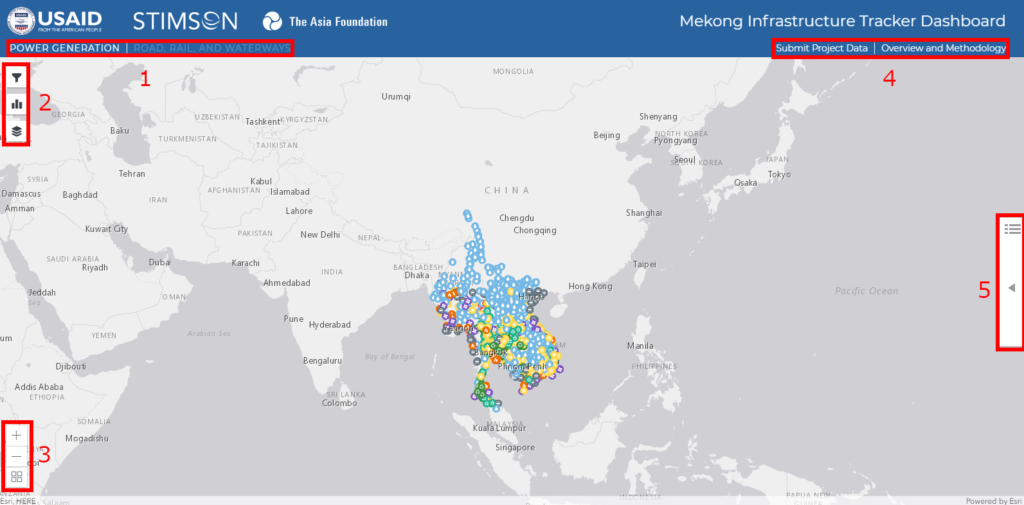
- Infrastructure databases
- Power generation
- Road, rails, and waterways
- Pop-up map widgets
- Filters
- Charts
- Map layers
- Map view controls
- Zoom in/out
- Basemap layers
- External links
- Project data update/submission
- Mekong Infrastructure Tracker project overview and methodology
- Project details
- List of projects from points of interest
- Raw data export
Data and map filters
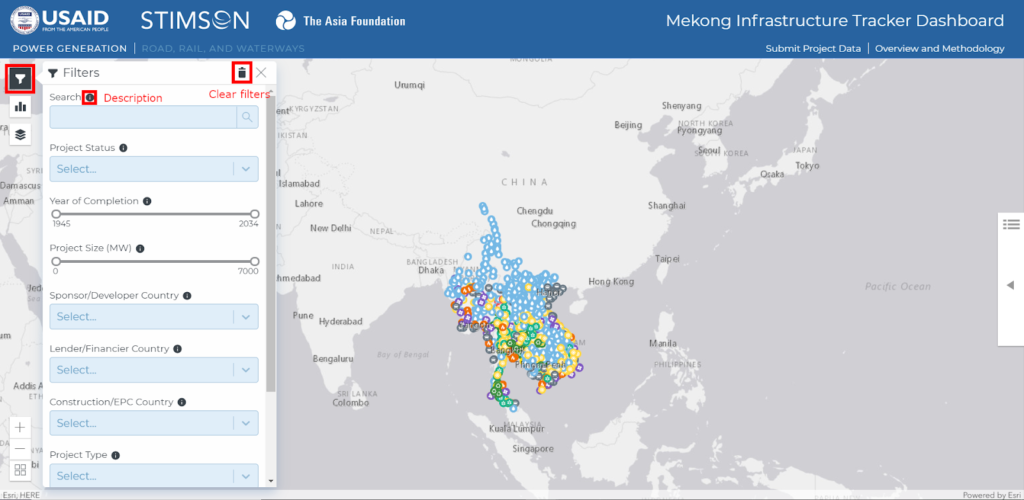
Click on the first widget on the top left of the screen to open the filter panel. Users may search for specific project by name, status, and generation capacity among other categories. Additional information about each category may be found by hovering over the information icon. To clear the filters, press the trash icon at the top of the filter panel.
Viewing and downloading charts
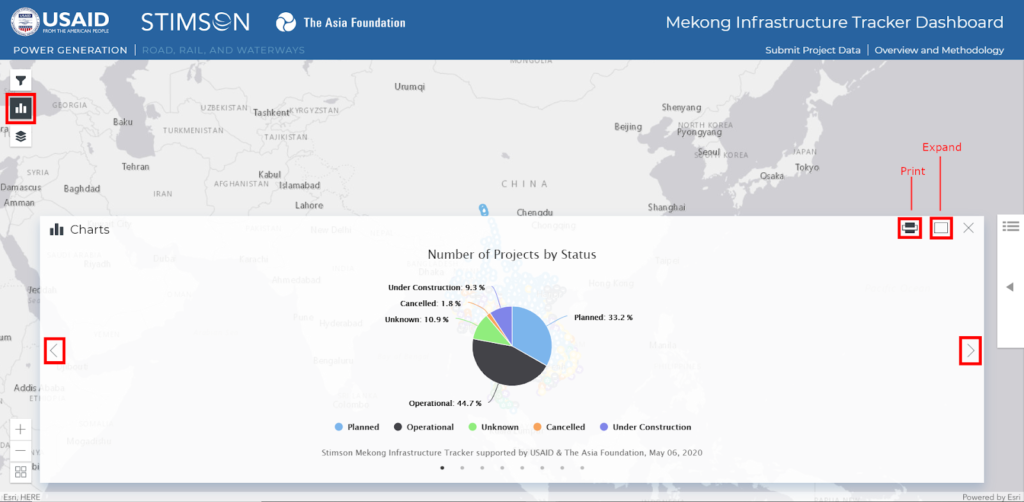
To view charts, click on the second top-left widget. Users may sort through various pre-made charts based on the filtered list of projects with the arrow buttons on both sides of the panel. As a default, all projects are included in the charts if filters have not been used. Additional options include printing the chart which will download the chart in view as a PNG file and expanding the chart panel view. You may also filter the data by clicking on segments in the charts. For example, in the image above, clicking on “Planned” projects in the pie graph will filter the data and map to display only planned projects.
Viewing and changing map layers
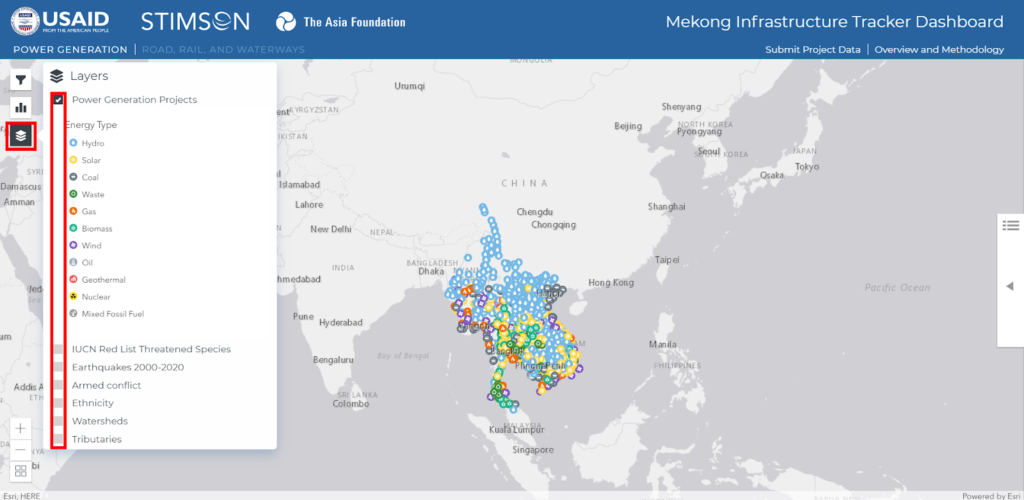
The third widget allows users to turn on/off map layers on the dashboard and view corresponding map legends. The default setting displays the infrastructure projects data, and as users toggle on additional layers, they will be added underneath the infrastructure data. In subsequent updates, additional relevant layers will be added onto the dashboard as announced through periodic updates and users may submit data or requests to the Mekong Infrastructure Tracker team for future inclusions.
Map controls and basemaps
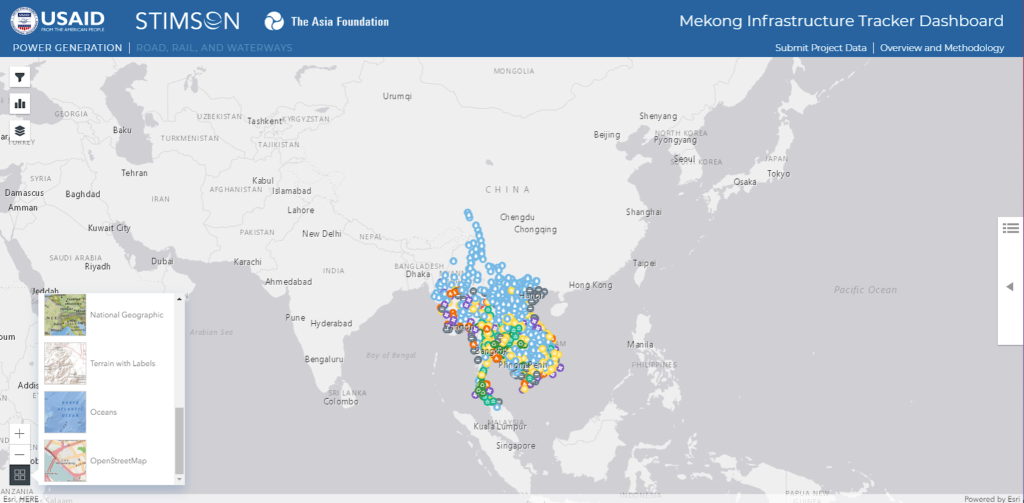
In addition to controlling the map with a mouse, users may control the map using the “+” and “-” buttons to zoom in and out. Users may also change the default gray basemap to any other ArcGIS Online basemaps like satellite imagery and OpenStreetMap.
Project details panel
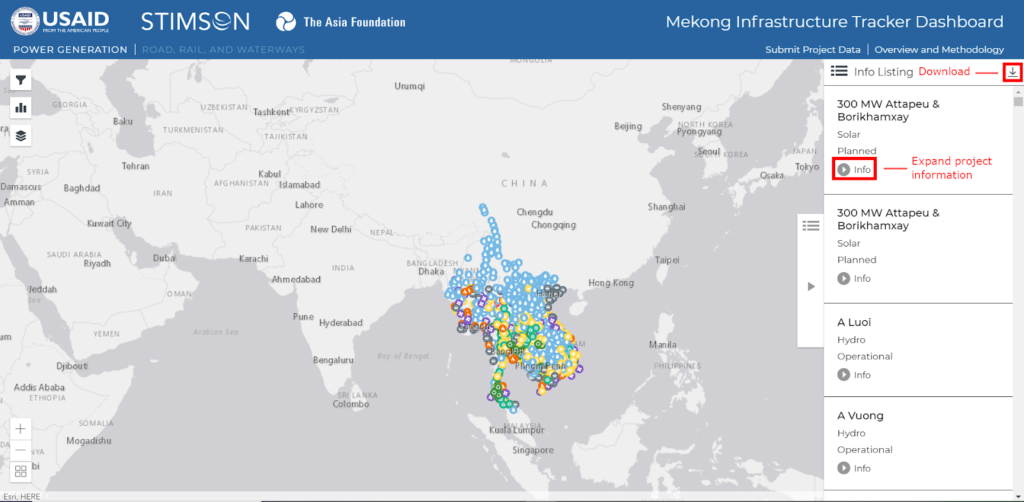
Users can also independently open the project detail panel on the right side by clicking on the button. The panel presents a list of projects on the map and, as users filter through projects, the list will mirror the filtered projects displayed on the map. Additional information may be displayed by clicking on the “info” button, which expands a drop-down list of descriptive information. Finally, users may download the list of projects as an Excel file by clicking the download button located at the top-right of the panel. Maintaining the default setting will download the entire database.
Data submission
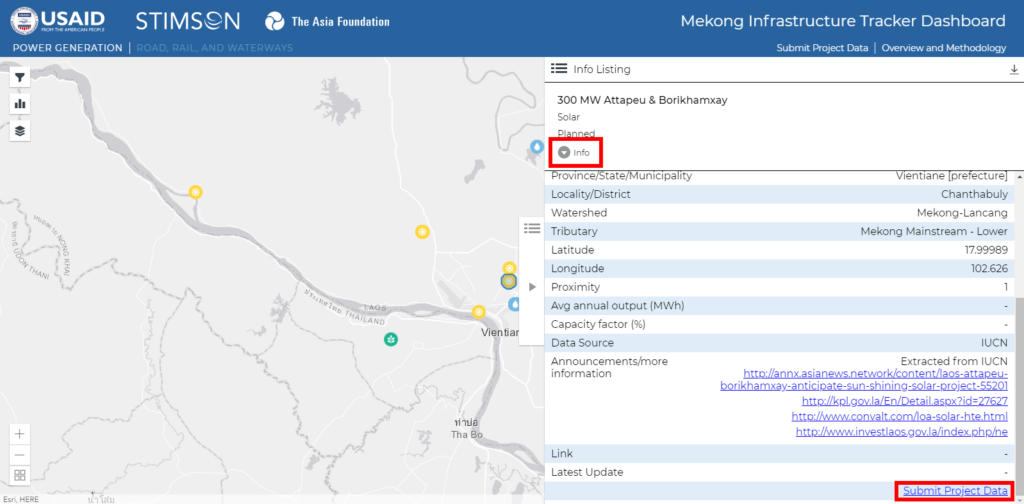
Finally, users may contribute information to the dashboard through data submission links. In addition to the general submission link at the top right, users may submit missing or updated information for a specific project at the bottom of said project’s list of information in the project detail panel. This will lead to a survey propagated with information of that specific project.
How-to example
In this example, we are interested in looking at foreign investment into hydropower infrastructure projects within the Mekong River basin. First, we filter the database to only hydropower under “Project Type” and the “Watershed” variable to Mekong-Lancang.
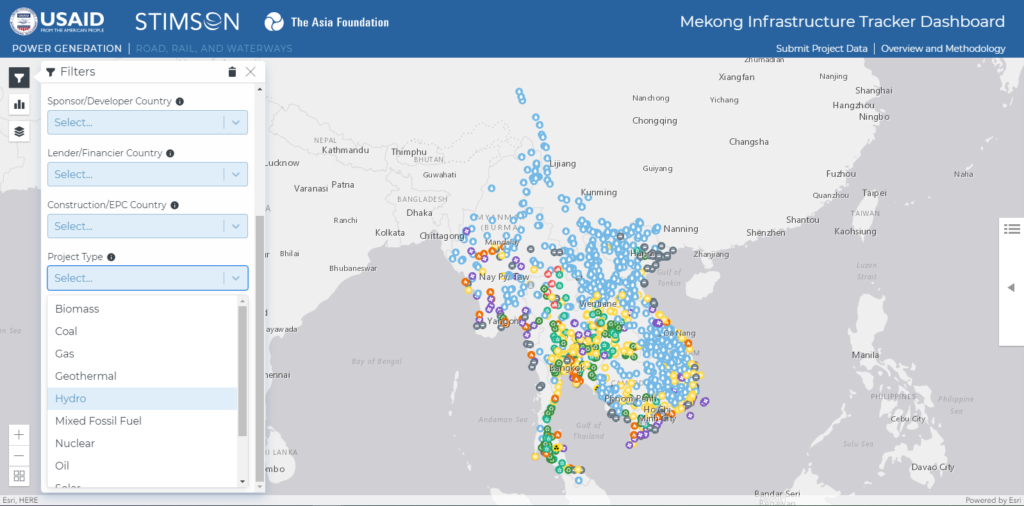
Filtering the power generation database to hydropower sources.
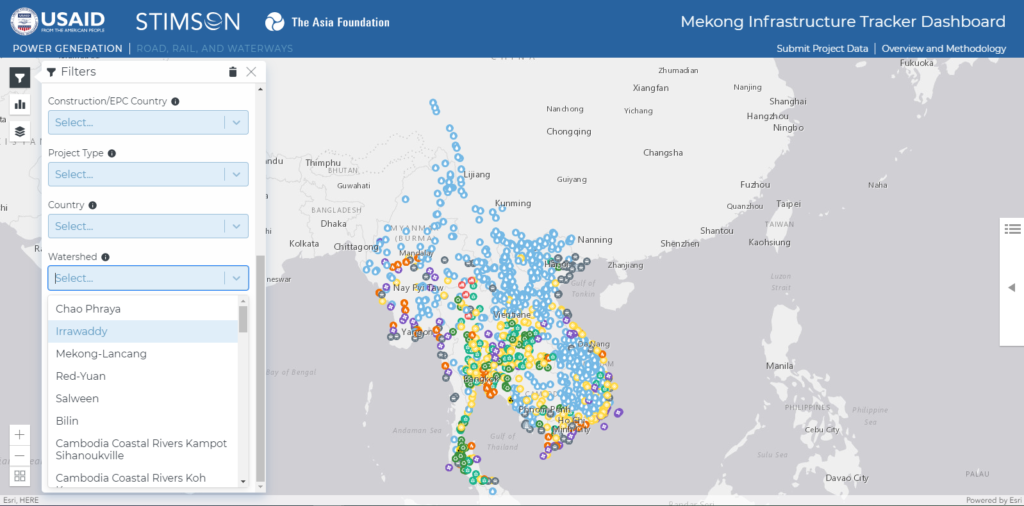
Filtering the database to projects in the Mekong-Lancang River basin.
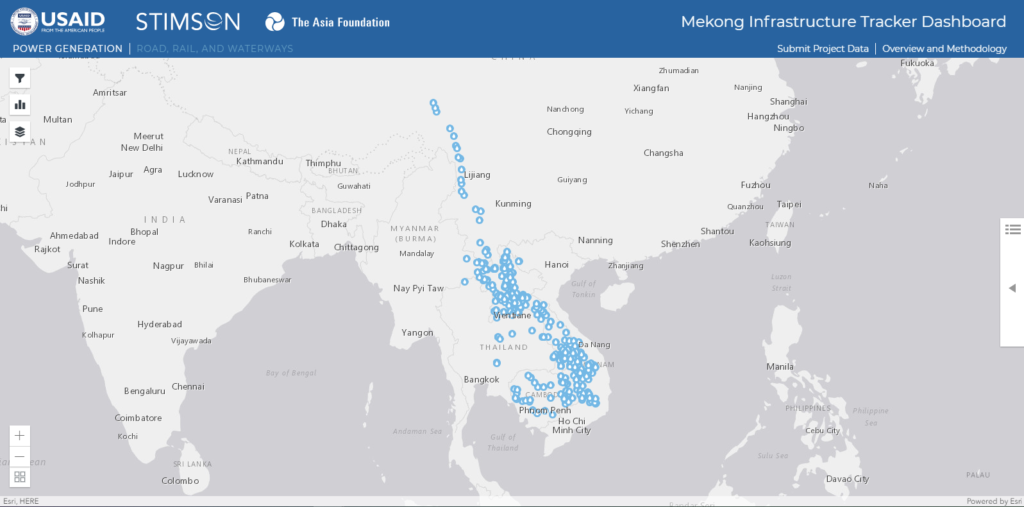
With the filters in place, the map has now been updated to only display hydroelectric power generators in the Mekong River basin. We may be interested in doing a cursory look at these projects and click on random projects to propagate additional information from the project details panel, or we can look at the charts.
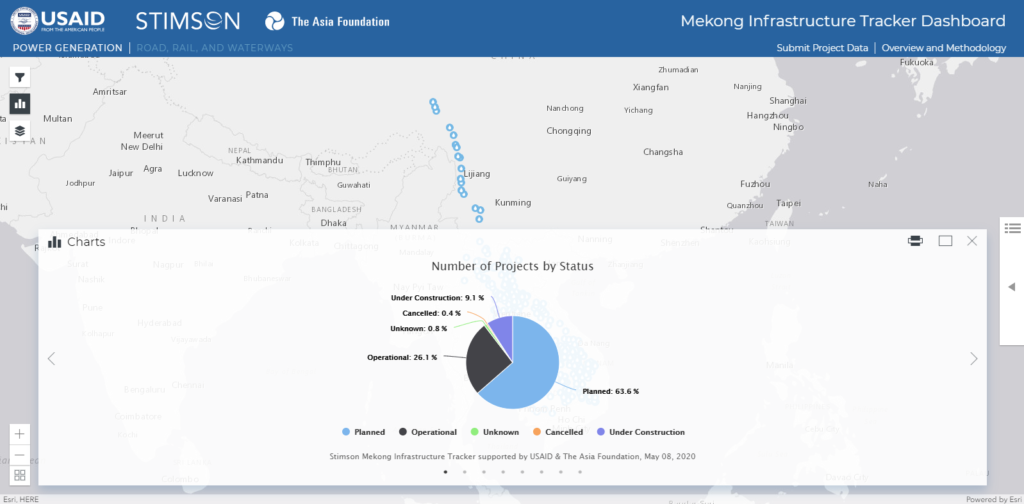
Opening the charts panel, we are presented with several preset charts. In the image above, we find that most hydro power generators have been listed in the planned phase. Hovering over each section of the pie chart will pop up the raw count of projects. As we scroll through different data visualizations, we also can also look at the proposed years of completion for all the projects in the watershed, as shown in the image below.
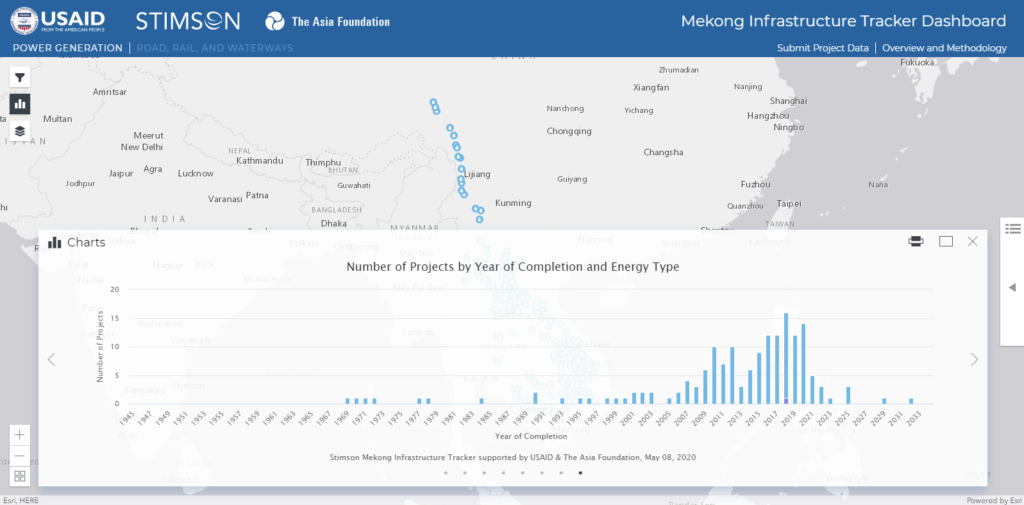
In the chart above, we notice an increasing trend of hydroelectric generators being built and completed in the latter half of the 2000s and continuing to the present. All the charts, including the two included in this walkthrough, may be downloaded and printed for personal use. In this example, we are interested in exporting the dataset we have just filtered through for personal data management and analysis. To download the raw dataset, we open the project details panel on the right side of the dashboard and click on the download button as shown in the project details panel subsection above.
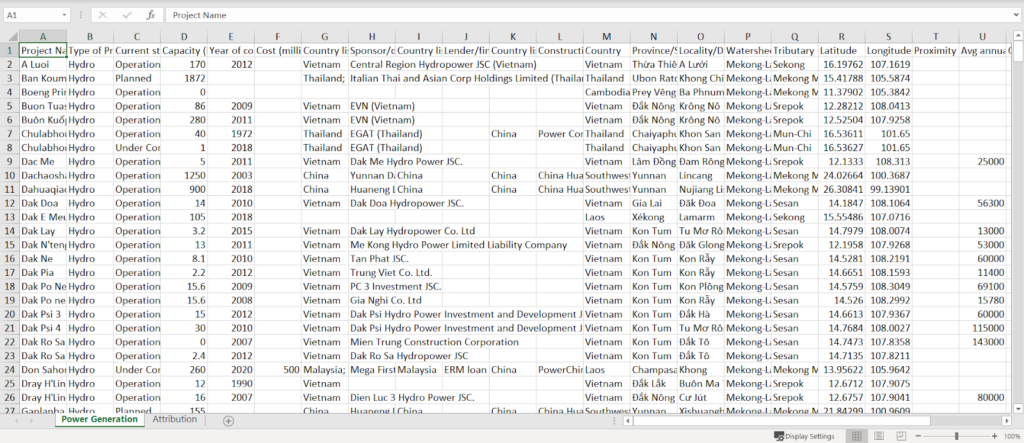
The dataset will be downloaded as an Excel spreadsheet as shown above. Variables of the underlying infrastructure database mirror information presented in the project details panel. With the raw data, we can now manipulate and analyze the dataset to our specific needs using third-party statistical and data visualization software.

