

Regan Kwan is a Research Associate with the Southeast Asia Program at the Stimson Center. His research focuses on the environmental and socioeconomic impact of development in the Greater Mekong Subregion. He manages the technical aspects of the Mekong Infrastructure Tracker project and leads the program’s data collection and management process.
Why do you work at Stimson?
I’ve always known that I wanted to do policy work, but I didn’t want to do it in the conventional sense where the work ends once a report is written and disseminated to policymakers. Instead I want to provide research analysis on different policy issues to a broad audience and engage directly with the user community. And that’s exactly what Stimson does.
What did you do before you worked at Stimson?
I joined the Peace Corps out of college, where I worked on youth and community development projects in Morocco. I came back and worked an office job at the Social Security Administration before deciding to go to graduate school where I focused on program monitoring and evaluation. Specifically, I focused on quantitative evaluation and the intersection of geographic information systems (GIS) and policy work. After graduate school I had the opportunity to do a couple of fellowships. One was at the International Maize and Wheat Improvement Center (CIMMYT) in Kenya, which addresses global food security issues. And then I had the opportunity to do a fellowship with a professor at my graduate school, UC San Diego School of Global Policy and Strategy. All of that led me to Stimson, where I am applying my experience and expertise to the Mekong Infrastructure Tracker platform.
What are you most proud of?
The Mekong Infrastructure Tracker project started before I joined Stimson, but it is something I am excited to be a part of and contribute to. Through this project I get to engage with a variety of people within the region, from researchers, policymakers, media outlets, and local organizations.
It’s so important to engage with communities directly. So often large projects like this have a top-down approach, but thinking about the user experience at all stages of a project is extremely important to me and to our program. One of our core values for the Tracker is to enable people to take a system-scale approach to development, as well as to increase data literacy more generally. While we try to remain relatively agnostic as data providers, we very much thought about local communities during the Tracker’s creation and continue to keep them in mind as we provide trainings and grow the reach of this tool.
For example, people can now get answers to questions like, “Is the power plant near my home impacting key biodiversity areas in my community?” or “Which companies and governments are investing in the new infrastructure project in my community?” That’s really powerful and can help communities connect the dots within a complex web of security issues, from environmental to economic to food security.
We are already seeing people use the Tracker in this way. For example, regional news outlets are using our data to provide a more informed, holistic perspective on the impacts of infrastructure development within their communities. Additionally, the open source nature of this tool has increased our ability to collaborate with local partners organizations. Many of these organization have been collecting this data for a long time but didn’t have access to the software and analysis tools that Stimson uses. Now we can share this data with them in a new way.
What is something you wish people understood about your work?
It is so difficult to collect data outside of Europe and North America in a transparent and accurate manner. As a researcher, that means I need to go to different sources – companies or crowdsourcing with local community organizations – to gather and corroborate information. The crowdsourcing work we do has actually been positive, as it helps us build relationships with local communities and we hope makes the Tracker a more accessible tool. But, it can be time consuming and inefficient.
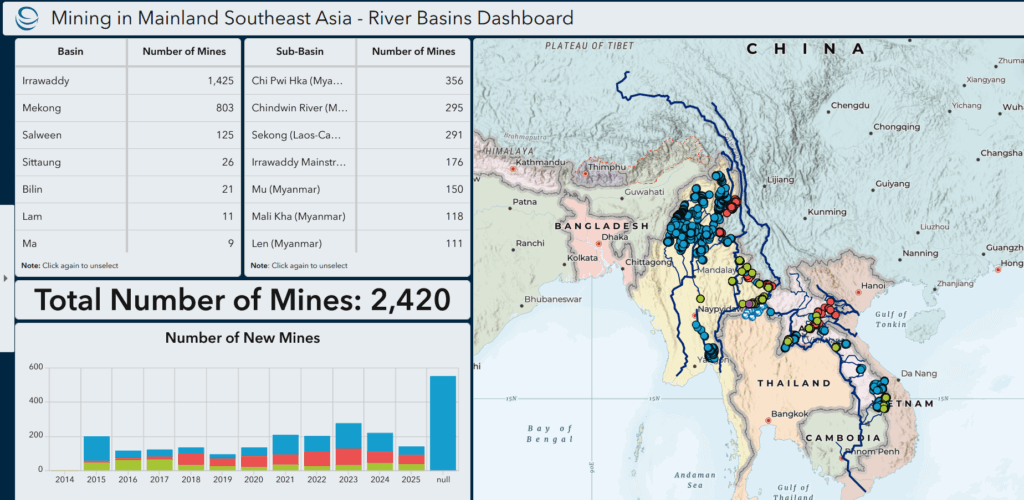
Also, in a strange way, the major contribution I’m bringing to this field of work is time. Actual time. It took a team of five people three months to gather data on 700 infrastructure projects, and that data isn’t even complete yet. No other organization has the capacity or wants to put in the time to do the work we are doing – but they want the information. Our project allows us to spend time collecting this information and share it publicly for free.
What are the future trends in your field?
Remote sensing and leveraging satellite imagery and free online tools like Google Earth Engine are increasingly important to the field and to the movement toward open-source resources. It creates an opportunity for people to expand on existing work and conduct work within their own regions.
Okay . . . can you explain what remote sensing means?
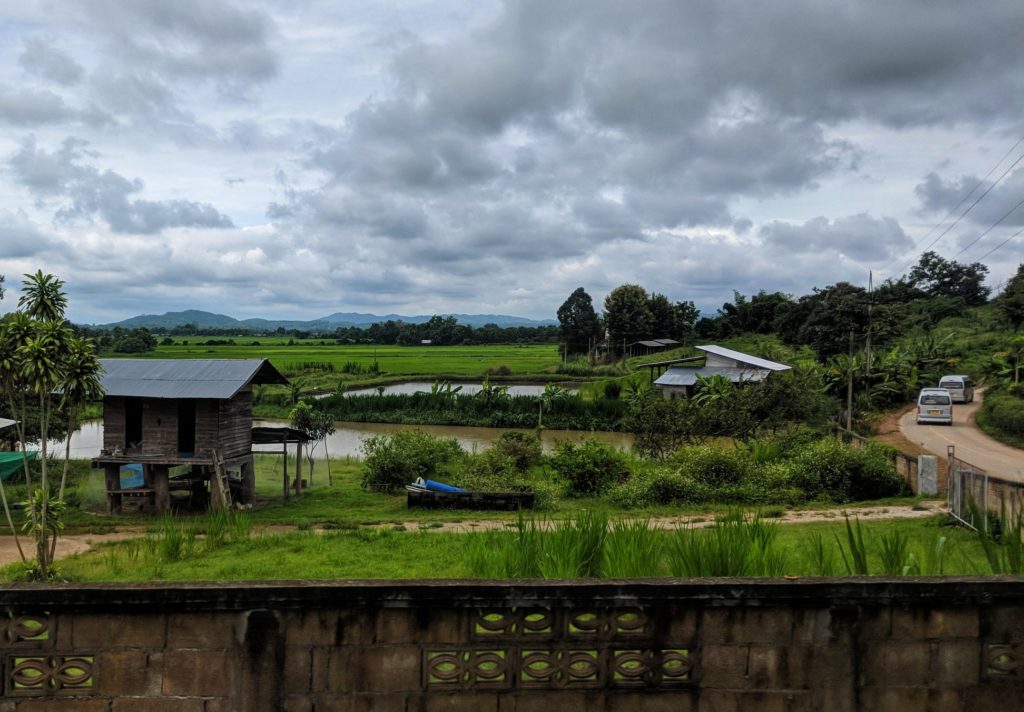
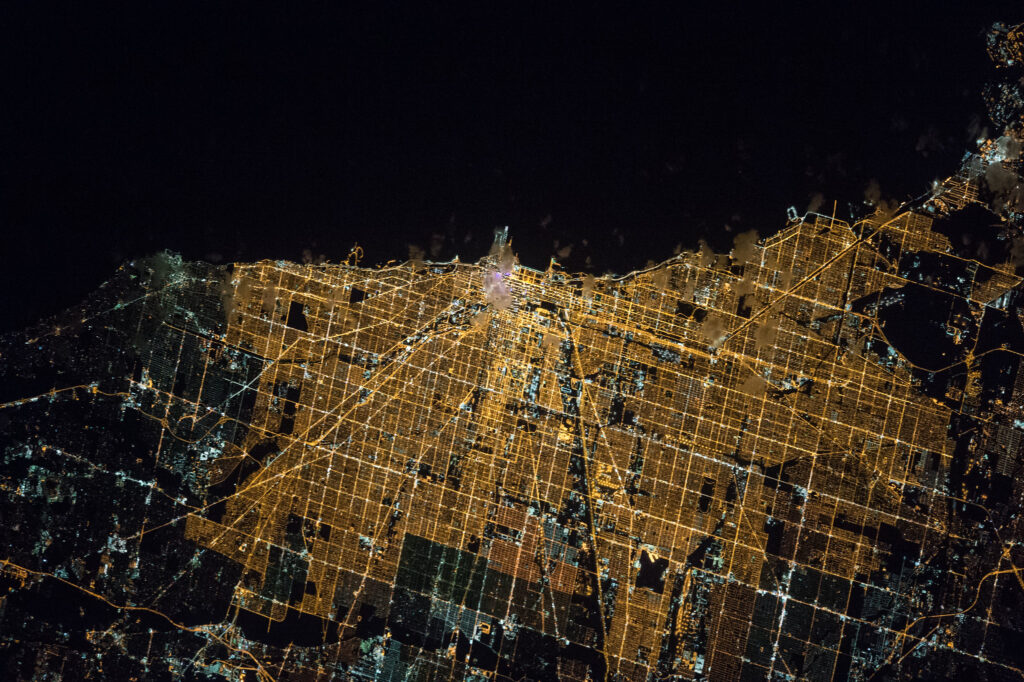
This is going to get a little nerdy, but it’s super interesting. Essentially, remote sensing is using satellite imagery to look at an image from far away as opposed to on-site observation and trying to understand what we are seeing. A satellite can detect and classify land surface which looks like a picture, but what we’re actually looking at is reflections or absorptions of radiation like the electromagnetic spectrum. If you play around with the combinations of colors from the visible to infrared portion of the electromagnetic spectrum that are available for each pixel, then you can accentuate certain aspects of terrain on earth. For example, if I want to see vegetation on a landscape, I can pull up image and make an educated guess that all of the green pixels I’m looking at on the map are probably vegetation. But if I wanted to be sure I would use a workflow that accentuates the fact that plants absorb visible light (i.e. solar radiation) and reflect near-infrared light and then quantify vegetation by measuring the difference between the two. And the satellite is orbiting around earth and collecting data at set time intervals. For example, the European Space Agency’s Sentinel-2 mission has a ten-day cycle to return to the same spot to capture data again. So we can use that data to get relatively up to date information across time, which also means we can travel back in time through these images and track things like economic growth, land cover change, and environmental disasters.
Follow Regan on Twitter @regankwan and learn more about the Southeast Asia Program.


Community Adaptation for a Water Festival Without Clean Water